Chapter 2:
UNDERGRADUATE STUDENTS: AFFORDABILITY
Goals
The goal of the University’s undergraduate financial aid program is to ensure that the University remains accessible to all academically eligible California students, regardless of their financial resources. Affordability is among UC’s highest priorities and the University has maintained a strong record of enabling families from all income levels to finance a high-quality education. The University achieves this through a financial aid program that considers how much parents can afford; federal, state, and University grants; and a manageable student “self-help” contribution from work or borrowing. The University closely monitors the impact of its tuition policies and financial aid programs through the key indicators detailed in this report to ensure financial accessibility and affordability.
The 2022 Multi-Year Compact with the State of California sets additional goals for affordability and total cost of attendance reduction. The University will aim to provide 60 percent of undergraduates, and all low-income California residents, with a debt-free pathway to a UC education by 2025–26. Achieving this will entail providing a combination of self-help (expected family contribution and student earnings) and gift aid from a mix of institutional, state, and federal sources that is adequate to cover the total cost of attendance. The aspirational goal is to provide this debt-free pathway for all undergraduates by 2029–30.
Funding for the state Middle Class Scholarship (MCS) Program will increase significantly in 2022–23. Roughly $164 million will be awarded to students for 2022–23, a significant increase from $32 million in 2021-22. These awards will play a key role in helping low- and middle-income students offset the cost of attendance and may help reduce their borrowing.
This chapter provides key indicators of UC’s success in ensuring access to and the affordability of a UC education.
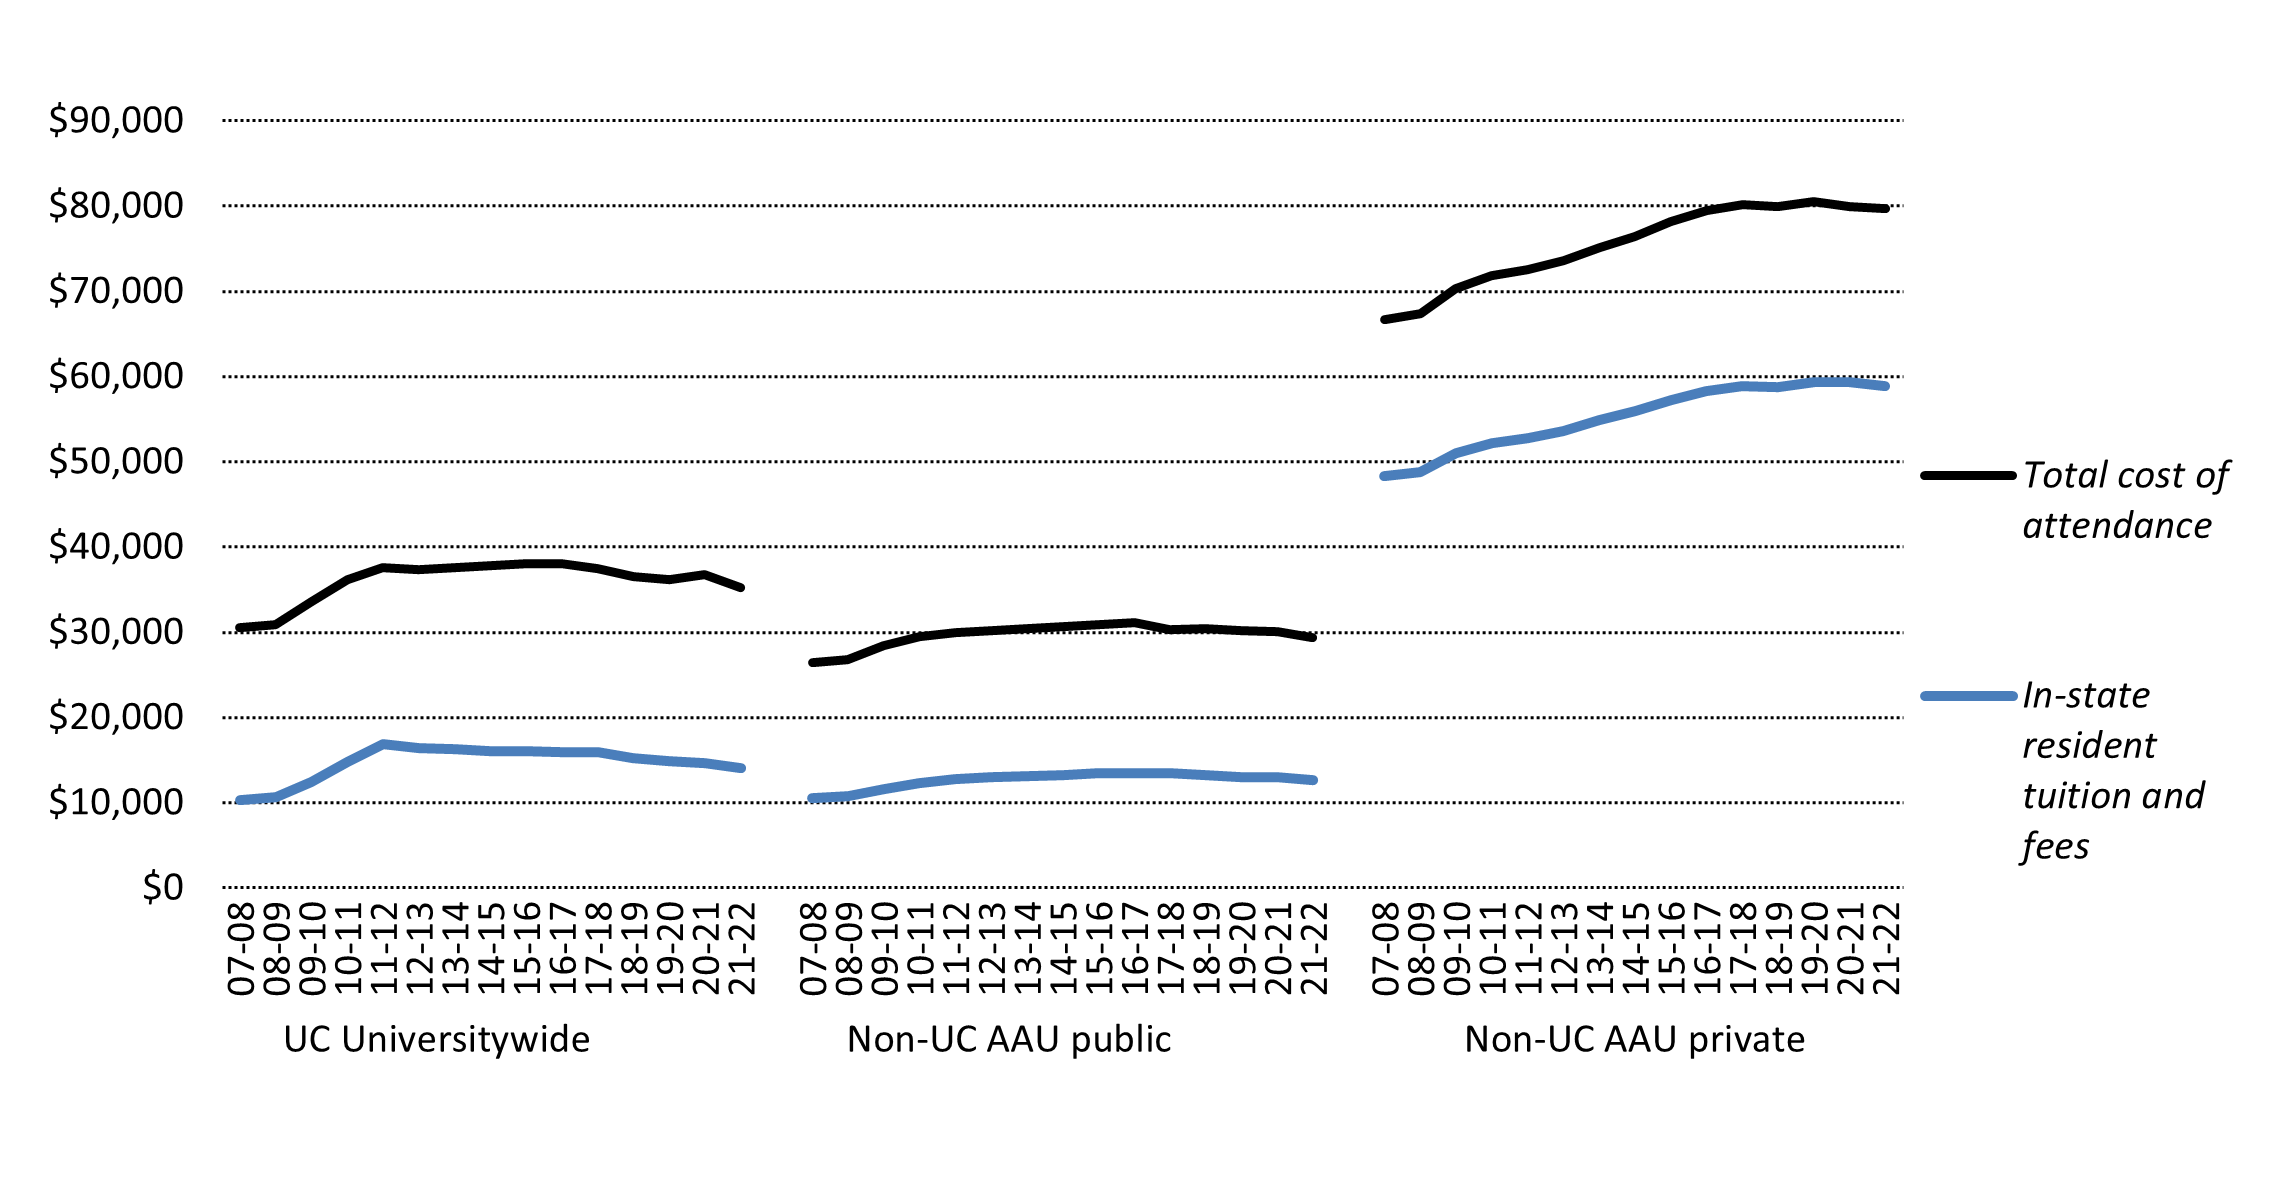
UC in-state tuition and total costs have remained relatively flat over the past several years.
2.1.1 Total cost of attendance for undergraduate in-state residents, Universitywide and comparison institutions, 2021 inflation-adjusted dollars, 2007–08 to 2021–22
Source: IPEDS1
The total cost of attendance at UC has remained stable but is higher than at AAU public comparison institutions primarily because of higher tuition and fees, especially the high cost of living in California.
1Charges are for in-state students living on campus. Averages are simple averages. Weighted averages for UC can be found at the Student Affairs Student budge tables. A list of the 28 non-UC AAU public and 26 AAU private institutions in the comparison groups can be found in the data glossary.
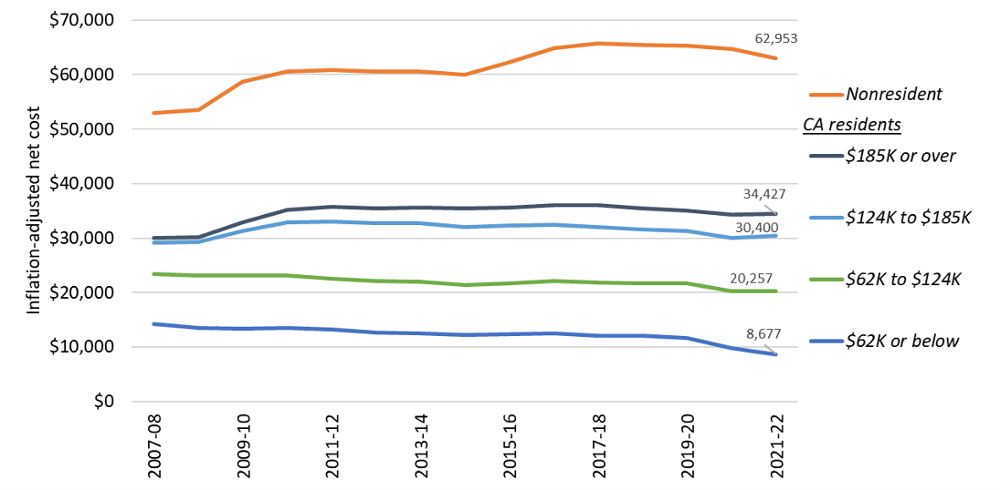
The net cost of attendance for California resident students has remained stable or even declined for some income groups in inflation-adjusted dollars. Nonresident students face a higher net cost of attendance due to supplemental tuition charges.
2.1.2 Net cost of attendance by family income and California residency, Universitywide, 2021 inflation-adjusted dollars, 2007–08 to 2021–22
Source: UC Corporate Student System1
Net cost of attendance represents the total cost of attendance at the University for undergraduates after considering scholarships and grants. California residents, especially those from the lowest-income backgrounds, have seen their net cost of attendance remain flat or decline since 2010–11. Nonresident students have also seen a stable net cost of attendance in recent years although their net cost is much higher due to supplemental tuition charges and their ineligibility to receive institutional need-based aid.
1Income ranges are approximate. Independent students are excluded. Net cost is the full cost of attendance less any grants, scholarships, and fee exemptions. Income is based on amounts reported in either the Free Application for Federal Student Aid (FAFSA) or the UC Application for Undergraduate Admission, or, if missing, is imputed based on demographic profiles.
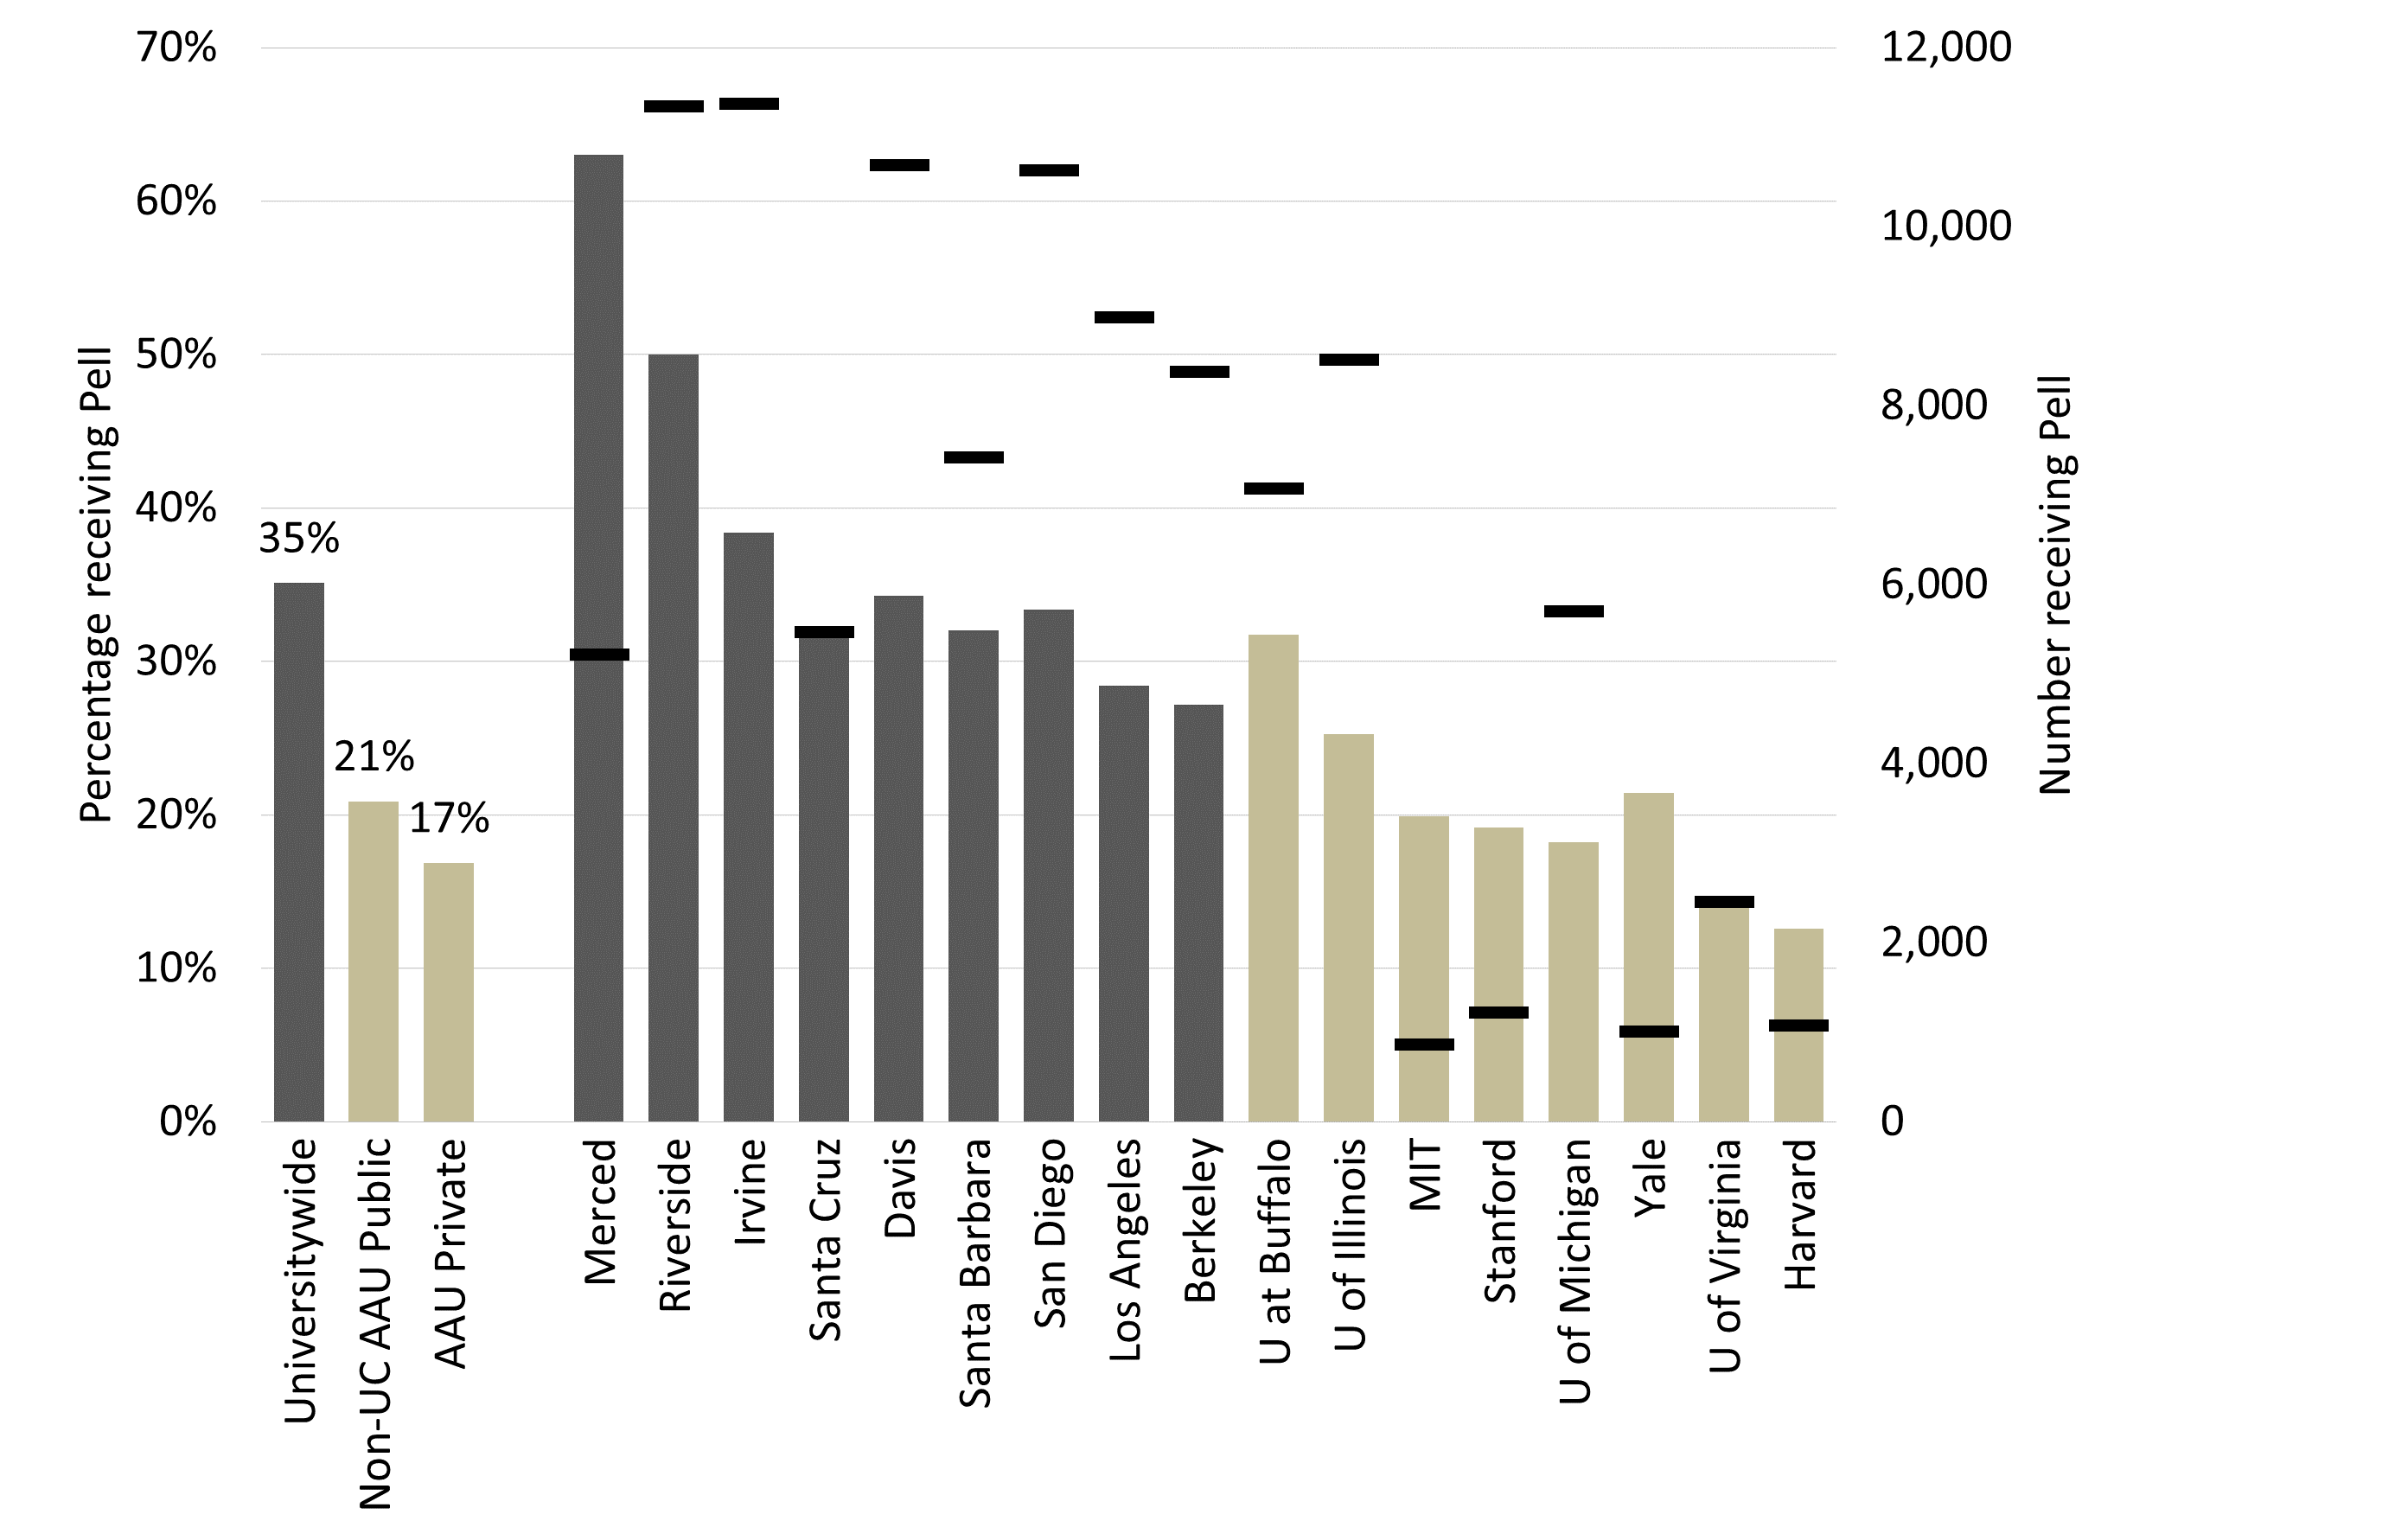
Thirty-five percent of UC undergraduates are Pell Grant recipients, a higher percentage than public or private peers.
2.2.1 Undergraduate Pell Grant recipients, UC and comparison institutions, 2020–21
Source: IPEDS1
UC campuses enroll a significantly higher percentage of undergraduate students with Pell Grants, a federal aid program for low-income students, than their public or private peer institutions. By fall 2022, 33 percent of UC undergraduates and 40 percent of California Residents received Pell Grants.
1Percentage reported is that of students who received Pell Grants at any time during the 2020-21 year as a percentage of all undergraduates.
Note that Pell Grant eligibility criteria change annually because of the federal appropriations process and other formula changes. Thus, trend analysis of Pell recipients w ould not be a valid measure of changes in low-income students but rather would reflect the changes in eligibilitycriteria. A list of the institutions in the AAU comparison groups can be found in the data glossary.
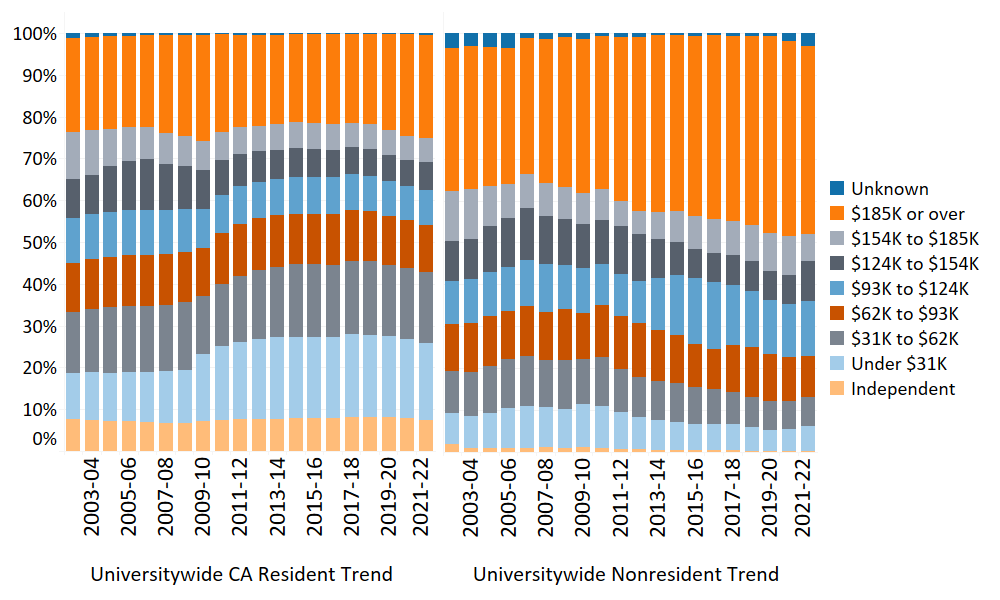
A large proportion of UC students come from low-income families, particularly among in-state students.
2.2.2 Undergraduate income distribution, Universitywide, 2021 inflation-adjusted dollars
Source: UC Corporate Student System1
In-state students are more likely to come from low-income families, with over 40 percent in families earning less than $62,000 in inflation adjusted dollars since 2010-11. Since 2017–18, the proportion of low-income California resident students has decreased slightly, with an offsetting increase in the highest income students. More than 45 percent of nonresident students come from families in the highest income category.
1Note that prior to 2007–08, an increasing number of students at one campus with parent incomes above $100,000 were incorrectly categorized as having an income of $100,000. This problem was fixed in 2007–08, resulting in an apparent (but not actual) decline in the percentage of students shown in the $120K to 150K category and a corresponding increase in the percentage shown in higher income categories.
More than half — six of ten — UC students felt that the cost of attendance was manageable. This proportion has been relatively stable over the past several years.
2.3.1 Student response to “With grants and scholarships, if any, the total cost of attending the school is manageable," Universitywide and comparison institutions 2011–12 to 2019–20
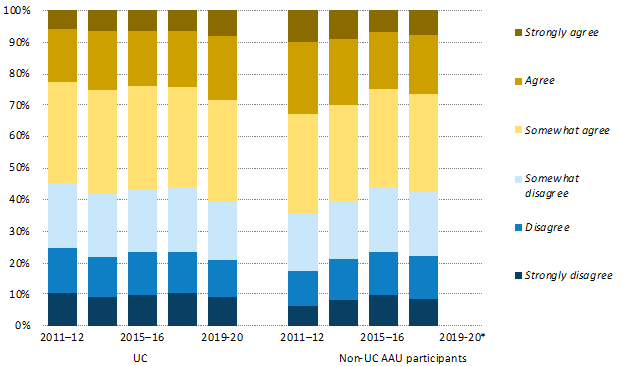
* Results not shown since only two non-UC AAU universities participated in SERU survey in 2020.
Source: UCUES and SERU1
Sixty percent of UC undergraduates in spring 2020 felt that the cost of attendance was manageable. This figure has risen gradually from 55 percent since the spring 2012 UCUES survey and exceeds the 58 percent of survey respondents at other participating American Association of University (AAU) institutions agreeing that the cost of their education was manageable.
1 SERU is the Student Experience in the Research University survey, which is administered at a number of AAU institutions.
The average inflation-adjusted debt at graduation of student borrowers has gradually declined to $18,000 over the past 20 years, while the percent graduating with no debt has increased to 60 percent.
2.3.2 Student loan debt burden of graduating seniors, inflation-adjusted, Universitywide, 2001–02 to 2021–22 (average debt of those with debt shown above each year)
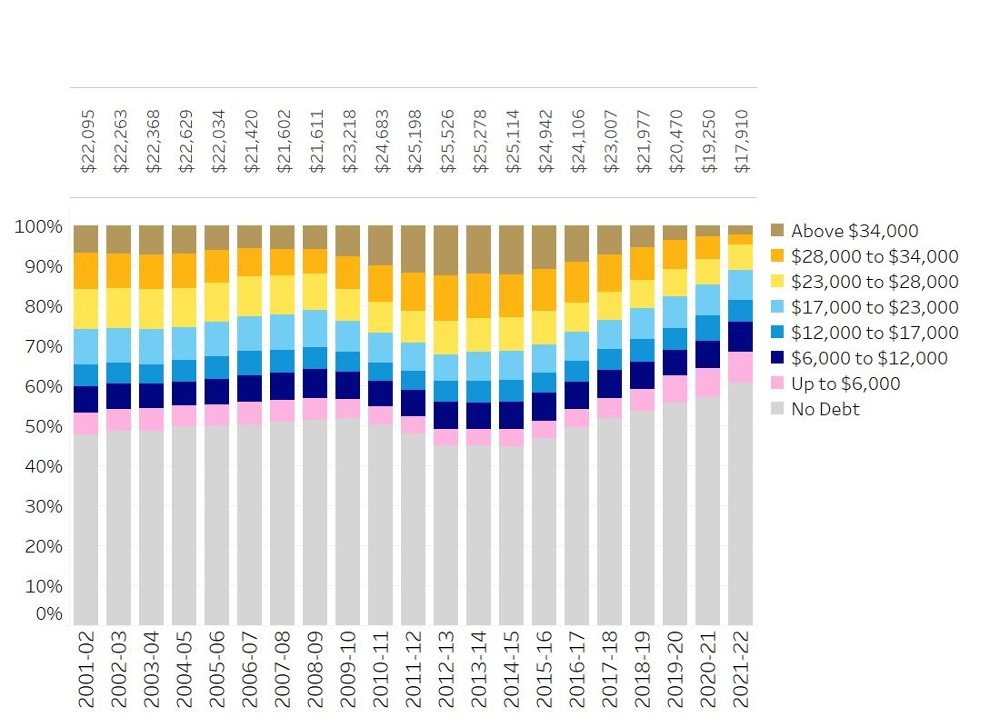
Source: UC Corporate Student System
Sixty percent of UC undergraduates graduate with no student loan debt. For those who do borrow, the average student loan debt at graduation in 2021–22 was about $17,900. California resident students are more likely to graduate with student loan debt, about 46 percent compared to only 12 percent of out-of-state students. In-state graduates’ average debt, however, was significantly lower than that of the out-of-state students who borrowed ($17,200 vs. $29,300).
Some portion of the decline in borrowing during 2020–21 and 202–-22 may be due to impacts from the COVID-19 pandemic. For example, many students moved home to live with their families in 2020–21, reducing their educational costs. Furthermore, federal Higher Education Emergency Relief Fund grants provided economic relief for many low-income UC students.
The proportion of low and middle-income students graduating with loan debt in 2021–22 was lower than what it was 20 years ago, whereas with higher-income students the proportion graduating with debt has been rising.
2.3.3 Student loan debt burden of graduating seniors by parent income, Universitywide, 2021 inflation-adjusted dollars,2002–2003 to 2021–22
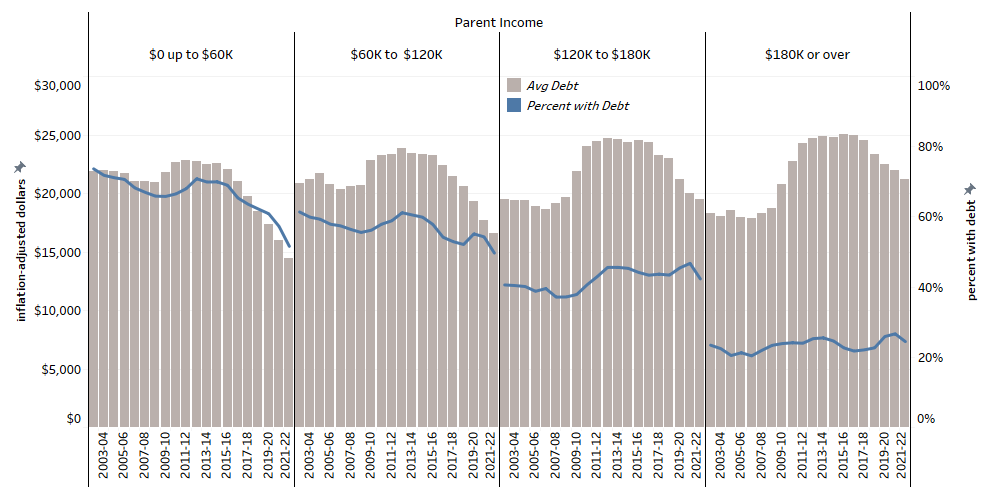
Source: UC Corporate Student System
The proportion of students graduating with debt has decreased steadily since 2002–03 for those in the lowest income categories. About half of students from the lowest income categories graduated with debt in 2021–22 compared to 60 to 70 percent in 2002–03. Higher-income students were about as likely to graduate with debt in 2021–22 as they were two decades prior. Average debt levels have declined consistently across all income groups since 2002–03. Average debt at UC campuses remains well below the most recent national average.
2.3.4 Average cumulative loan debt, UC and national comparison institutions, 2019-20 graduates
|
Merced
|
$17,413
|
|
Davis
|
$17,736
|
|
Irvine
|
$18,398
|
|
Berkeley
|
$18,468
|
|
Santa Barbara
|
$19,034
|
|
UC Average
|
$19,220
|
|
Riverside
|
$19,707
|
|
San Diego
|
$19,969
|
|
Los Angeles
|
$20,200
|
|
Santa Cruz
|
$21,189
|
|
|
|
|
Public four-year
|
$27,539
|
|
Private nonprofit four-year
|
$33,389
|
|
National Average
|
$28,950
|
By five years after graduation, over 90 percent of students have manageable debt-to-earnings ratios of less than ten percent.
2.3.5 Percent of UC undergraduate alumni with manageable debt-to-earnings ratios (below ten percent) at two and five years after graduation by degree major, Universitywide and by Campus, Undergraduate graduating cohorts 2000–2019 who are working in California
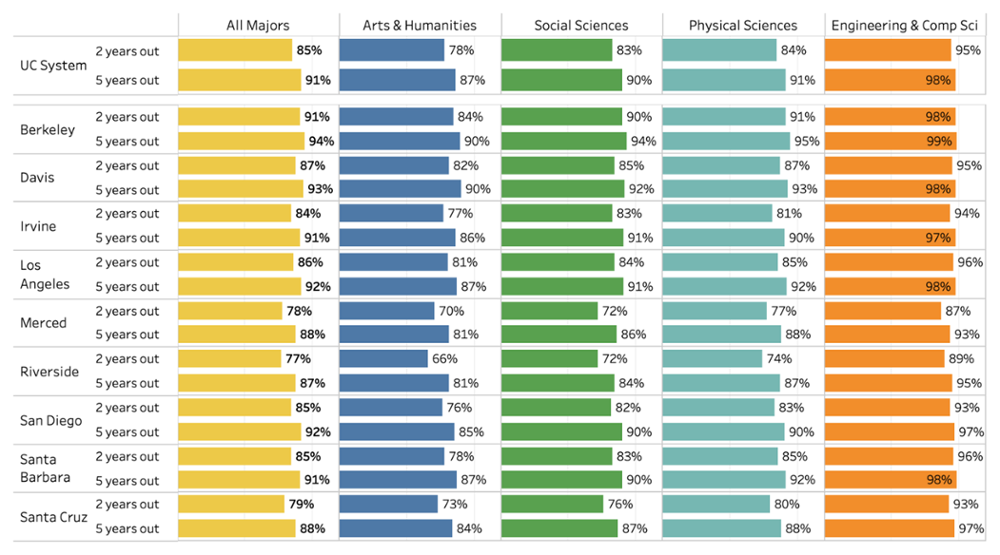
Source: UC Corporate Student System and EDD Quarterly Earnings
The primary benchmark used to evaluate debt manageability is the percentage of average earnings required to repay a student’s debt at graduation based upon a standard ten-year repayment plan. UC considers debt that requires between five percent and nine percent of a student’s postgraduate earnings to be manageable. About 85 percent of UC baccalaureate recipients systemwide have a debt-to-earnings ratio of ten percent or less at two years after graduation and over 90 percent do at five years after graduation. Graduates in arts, humanities, and social science programs are somewhat more likely to have debt ratios more than ten percent at two and five years after graduation.
For more information
UC costs and financial aid, including financial aid estimators (website)
Trends in UC financial aid (website)

Student financial support data tables dashboard with downloadable figures on financial aid awarded by year, campus, and award type
Net cost of attendance dashboard of data tables with downloadable figures on total and net cost of attendance by campus and residency
UC alumni at work dashboard with typical student debt, earnings, percentages of graduates with debt, and debt payoff calculators
The complete UC Information Center Undergraduate affordability subject area
Download data tables for chapter 2 indicators (Excel format)