Chapter 3:
UNDERGRADUATE SUCCESS
MEETING CALIFORNIA'S NEED TO INCREASE DEGREE RECIPIENTS
UC has committed to adding more than 160,000 bachelor’s degree recipients by 2029–30, in part by increasing graduation rates and improving timely graduation. By 2030, UC’s goal is to have nine of ten undergraduates leave with a degree, and to improve four-year freshman graduation rates to 76 percent, and two-year transfer graduation rates to 70 percent. In addition, UC’s goal is to eliminate gaps in timely graduation for California’s Pell Grant recipients, first-generation students, and underrepresented groups (URG), in the spirit of demonstrating progress toward the Governor’s Compact goals and UC Presidential priorities.
This chapter provides a progress report on these critical goals and priorities, covering the following three topics:
- Section 3.1: Graduation rates and time to degree for freshmen and transfers, including subgroups
- Section 3.2: First-year retention rates for freshmen and transfers, including subgroups
- Section 3.3: Outcomes, including undergraduate degrees awarded and alumni employment and earnings
Although the overall freshman and transfer graduation rates have increased over the years and are showing good progress toward UC 2030 goals, there are still gaps in rates between subgroups. Low-income students, first-generation students, URG students, and less academically prepared students have lower average graduation rates, especially four-year graduation rates for freshmen and two-year graduation rates for transfers. Additionally, academic preparedness seems to explain more of the difference in graduation rates than the other aforementioned student characteristics. The effects of missed and lost learning experienced during the COVID-19 pandemic will likely exacerbate the trend seen with low socioeconomic-status students and less academically prepared students.
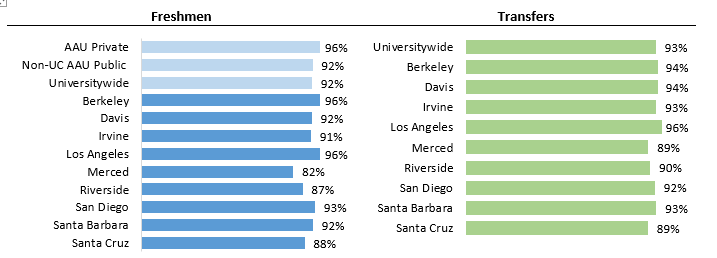
About 73 percent of UC freshmen graduate within four years and over 86 percent of them graduate within six years, both higher than comparable AAU public universities.
3.1.1 Freshman graduation rates, UC and comparison institutions, Cohorts entering fall 2016, 2017, and 2018; fall 2015 cohort for AAU comparison
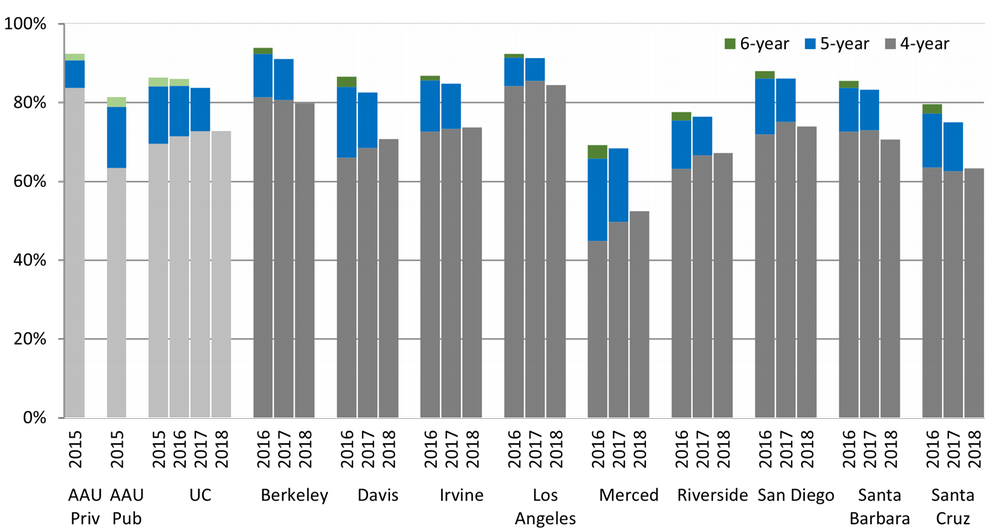
Source: UC Data Warehouse and IPEDS1
By 2030, UC is striving to raise four-year graduate rates to 76 percent and six-year graduation rates to 90 percent. UC has identified a wide range of programs to promote the academic success of undergraduates and is seeking financial support from the State to achieve these goals.
The six-year graduation rate of UC freshmen is close to 90 percent when students who finished their degrees at a non-UC institution are included.
3.1.2 Freshman extended graduation rates, including those who graduated from a non-UC institution, Universitywide and UC campuses, Cohort entering fall 2016
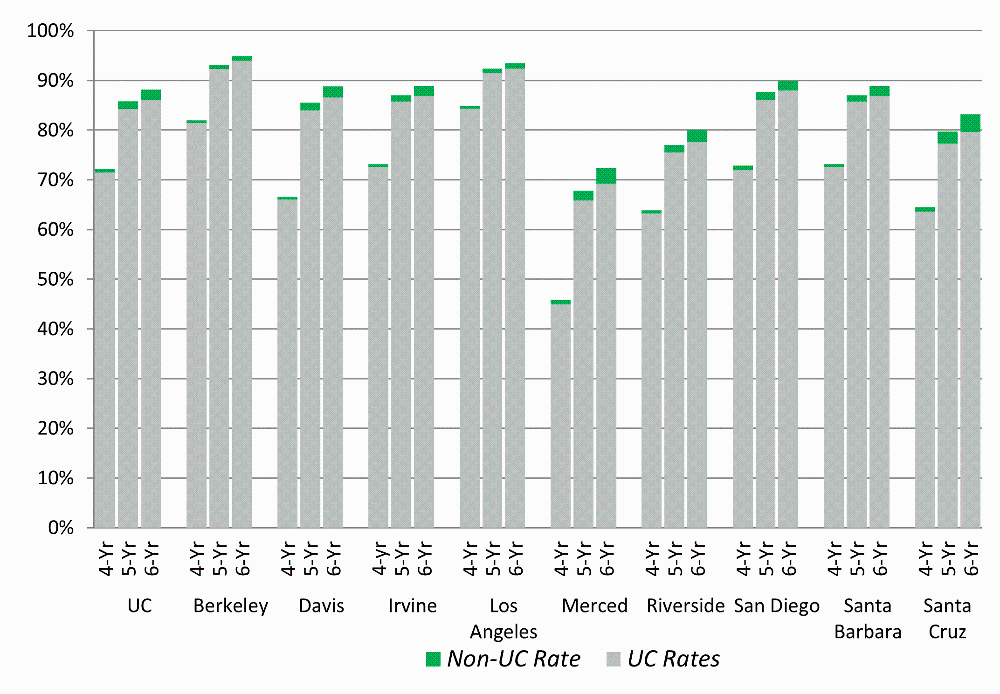
Source: UC Data Warehouse and the National Student Clearinghouse1
The extended graduation rate of students who begin their studies as freshmen at UC includes those who transfer to a non-UC institution and complete their bachelor’s degree within four, five, or six years.
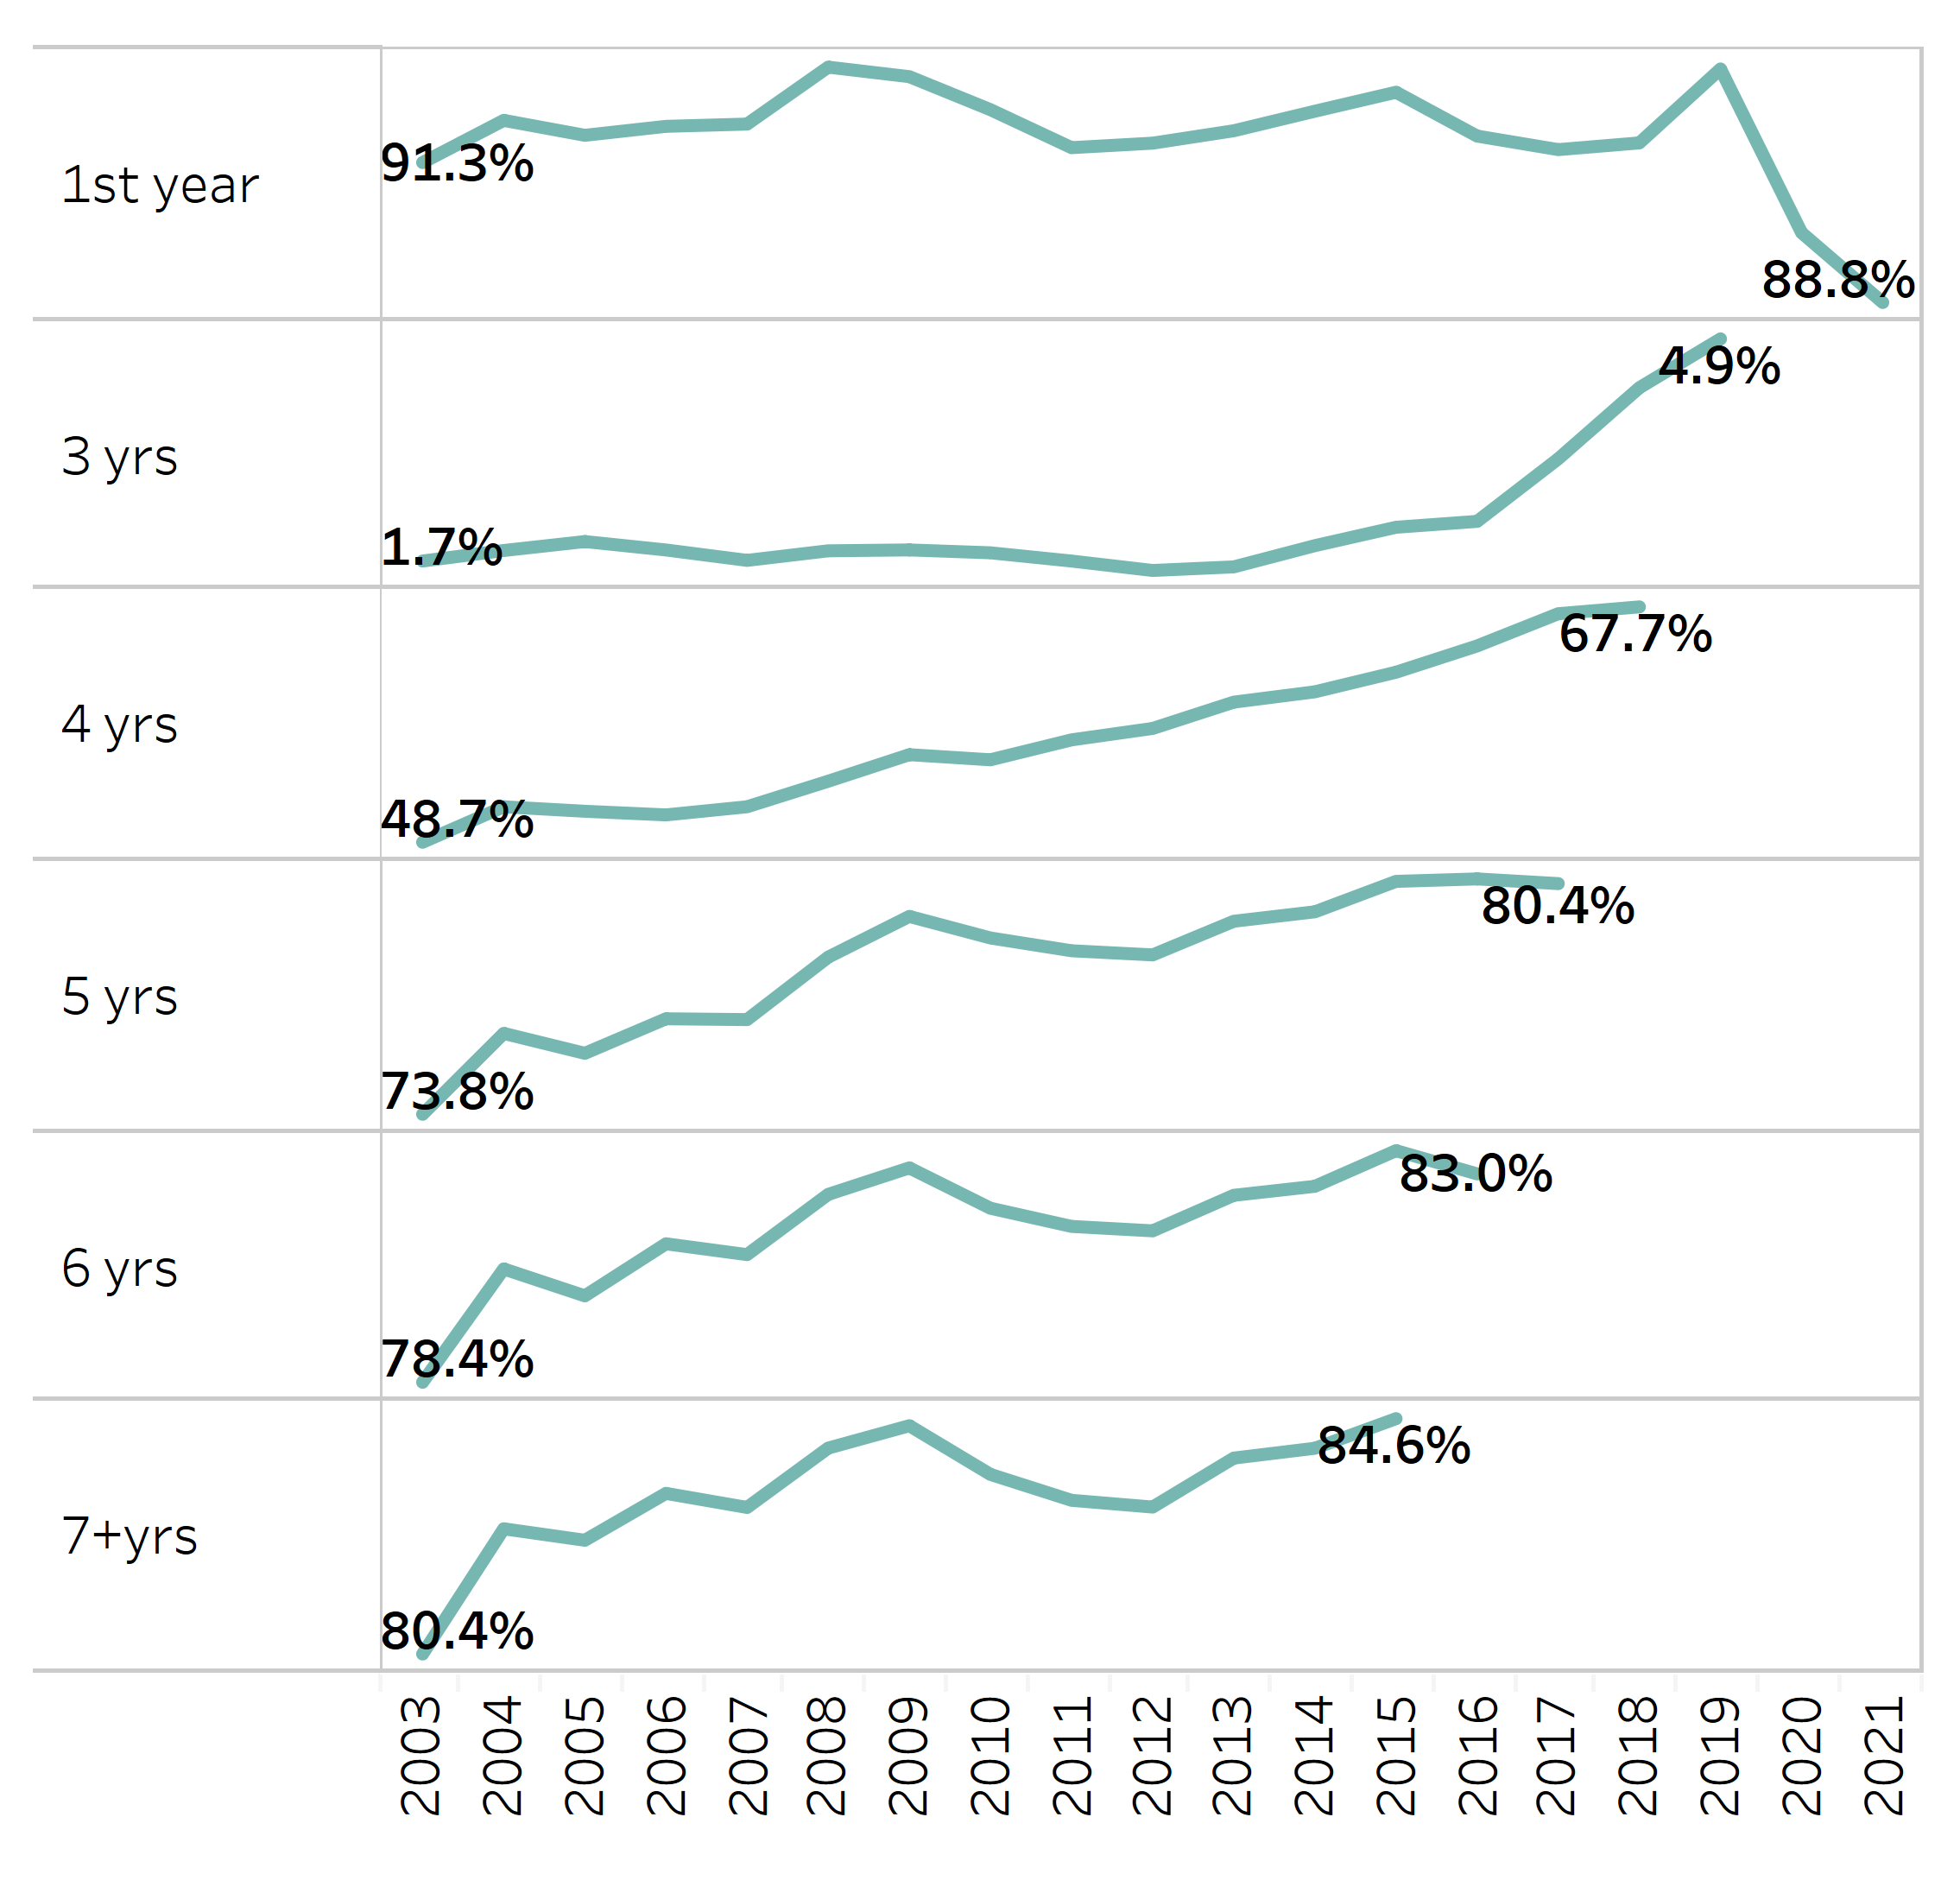
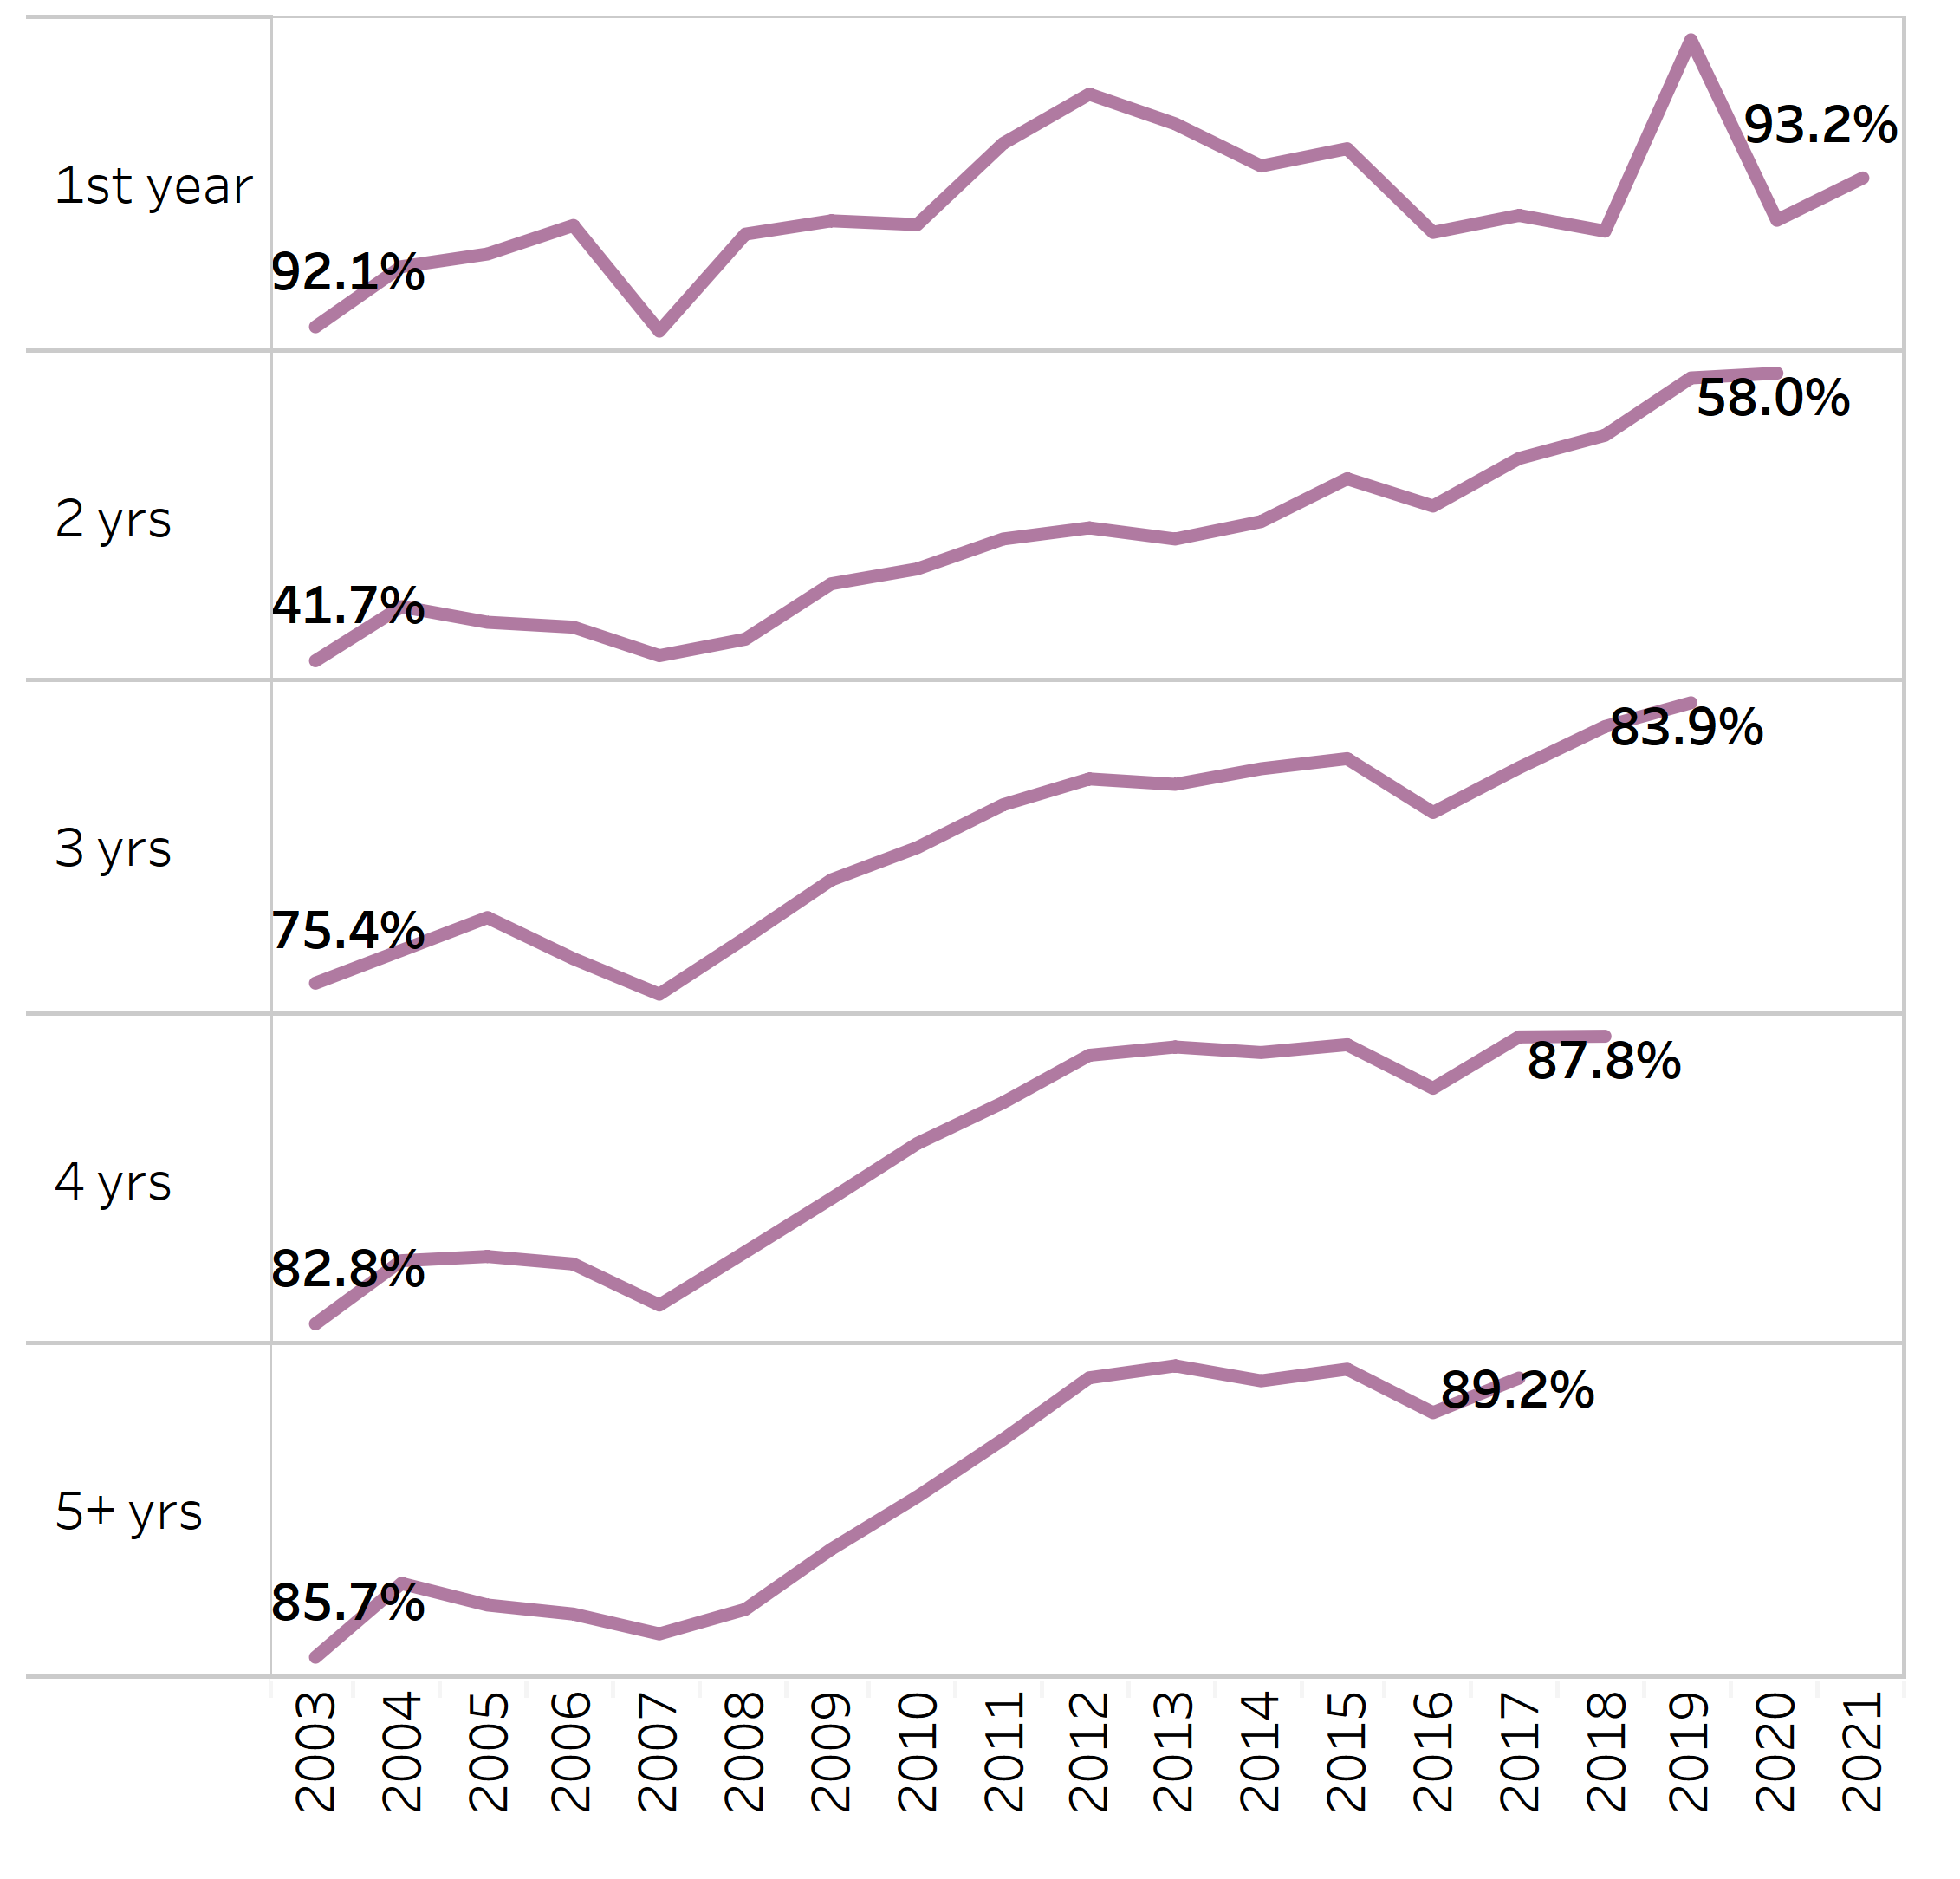
About 60 percent of transfer students graduate within two years, and close to 90 percent within four years.
3.1.3 Transfer graduation rates, Universitywide and UC campuses

Undergraduate graduation rates dashboard
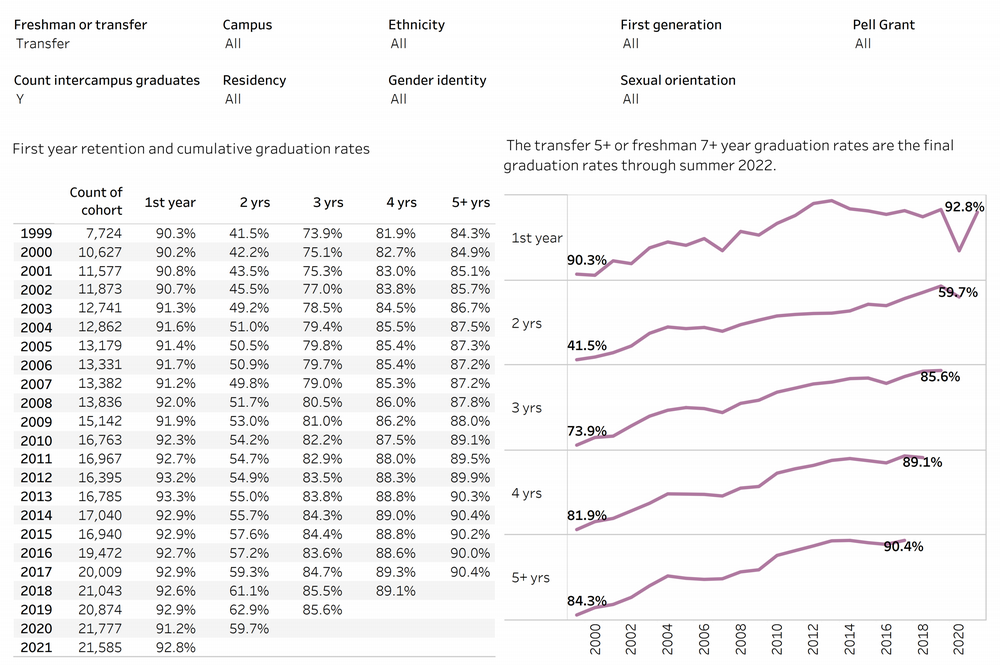
UC is striving to improve two-year graduation rates to 70 percent by 2030. UC is seeking financial support from the State to expand programs and services to achieve these ambitious goals.
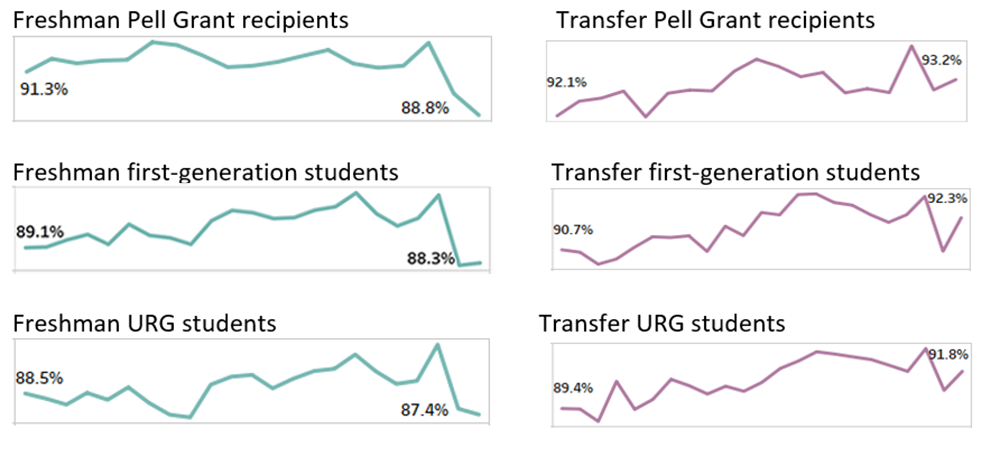
About 62 percent of freshman underrepresented group (URG) students at UC graduate within four years, and 79 percent graduate within six years. The rates are higher when compared to URG students at other AAU public institutions, but gaps exist with other UC peers.
3.1.4 Freshman URG graduation rates
Undergraduate graduation rates dashboard
By 2030, UC is looking to eliminate graduation gaps for underrepresented groups. All URGs decreased their four-year graduation rates from that of the previous cohorts. This is likely an impact of missed and lost learning experienced during the COVID-19 pandemic.
Freshman graduation rates by race/ethnicity between UC and comparison institutions, cohort entering fall 2015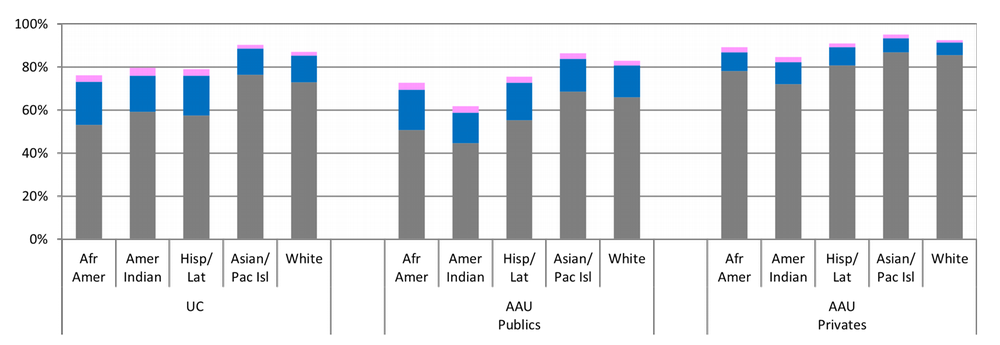
Source: UC Data Warehouse and IPEDS
Regardless of race/ethnicity, transfer students graduate at a high rate, and the rate for two-year graduates of all racial/ethnic groups is rising.
3.1.5 Transfer graduation rates by race/ethnicity, Universitywide
Undergraduate graduation rates dashboard
(select individual races/ethnicities for these views)
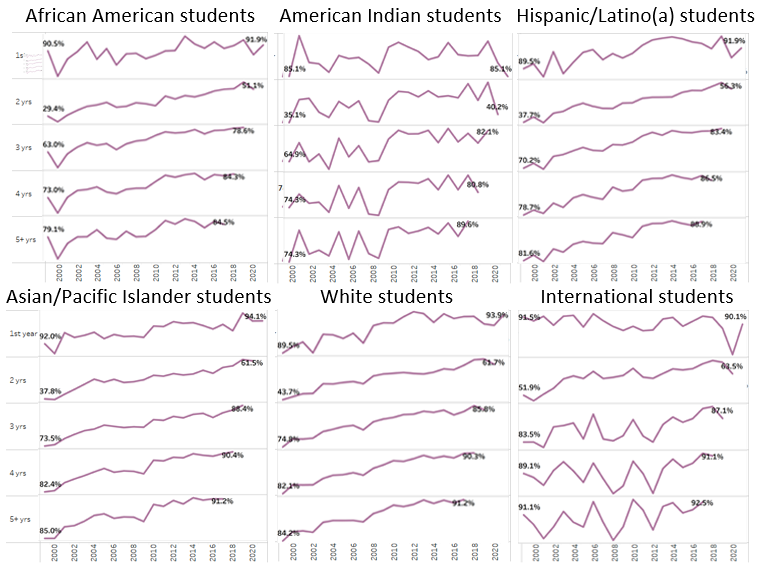
The rate for two-year graduates of all racial/ethnic groups and three-year graduates for international students decreased from that of the recent cohort. COVID-19 may have an impact on this decrease. UC continues to seek additional recourses and make an effort to eliminate graduation gaps for URGs.
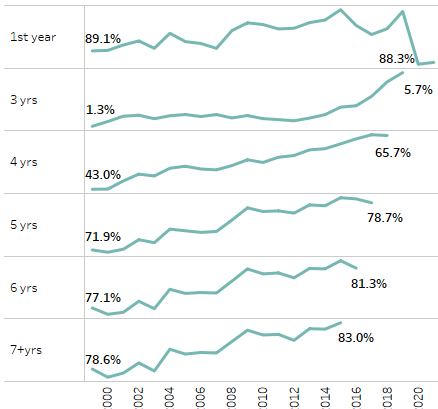
Eighty-three percent of freshman Pell Grant students graduate within six years, and 88 percent of transfer Pell Grant students graduate within four years.
3.1.6 Freshman graduation rates by Pell Grant recipient status, Universitywide
Undergraduate graduation rates dashboard
Freshman Pell Grant recipients
3.1.7 Transfer graduation rates by Pell Grant recipient status, Universitywide
Undergraduate graduation rates dashboard
Transfer Pell Grant recipients
Although there is an eight-percentage point gap at the four-year mark between freshman Pell Grant recipients (68 percent) and non-Pell Grant recipients (76 percent), this gap is reduced to six percentage points at the five-year mark. The gap at the two-year and four-year graduation rates between transfer Pell grant and non-Pell Grant recipients is about three percentage points.
Over 81 percent of freshman first-generation students graduate within six years, and 88 percent of transfer first-generation students graduate within four years.
3.1.8 Freshman graduation rates by first-generation status, Universitywide
Undergraduate graduation rates dashboard
Freshman first-generation students
3.1.9 Transfer graduation rates by first-generation status, Universitywide
Undergraduate graduation rates dashboard
Transfer first-generation students
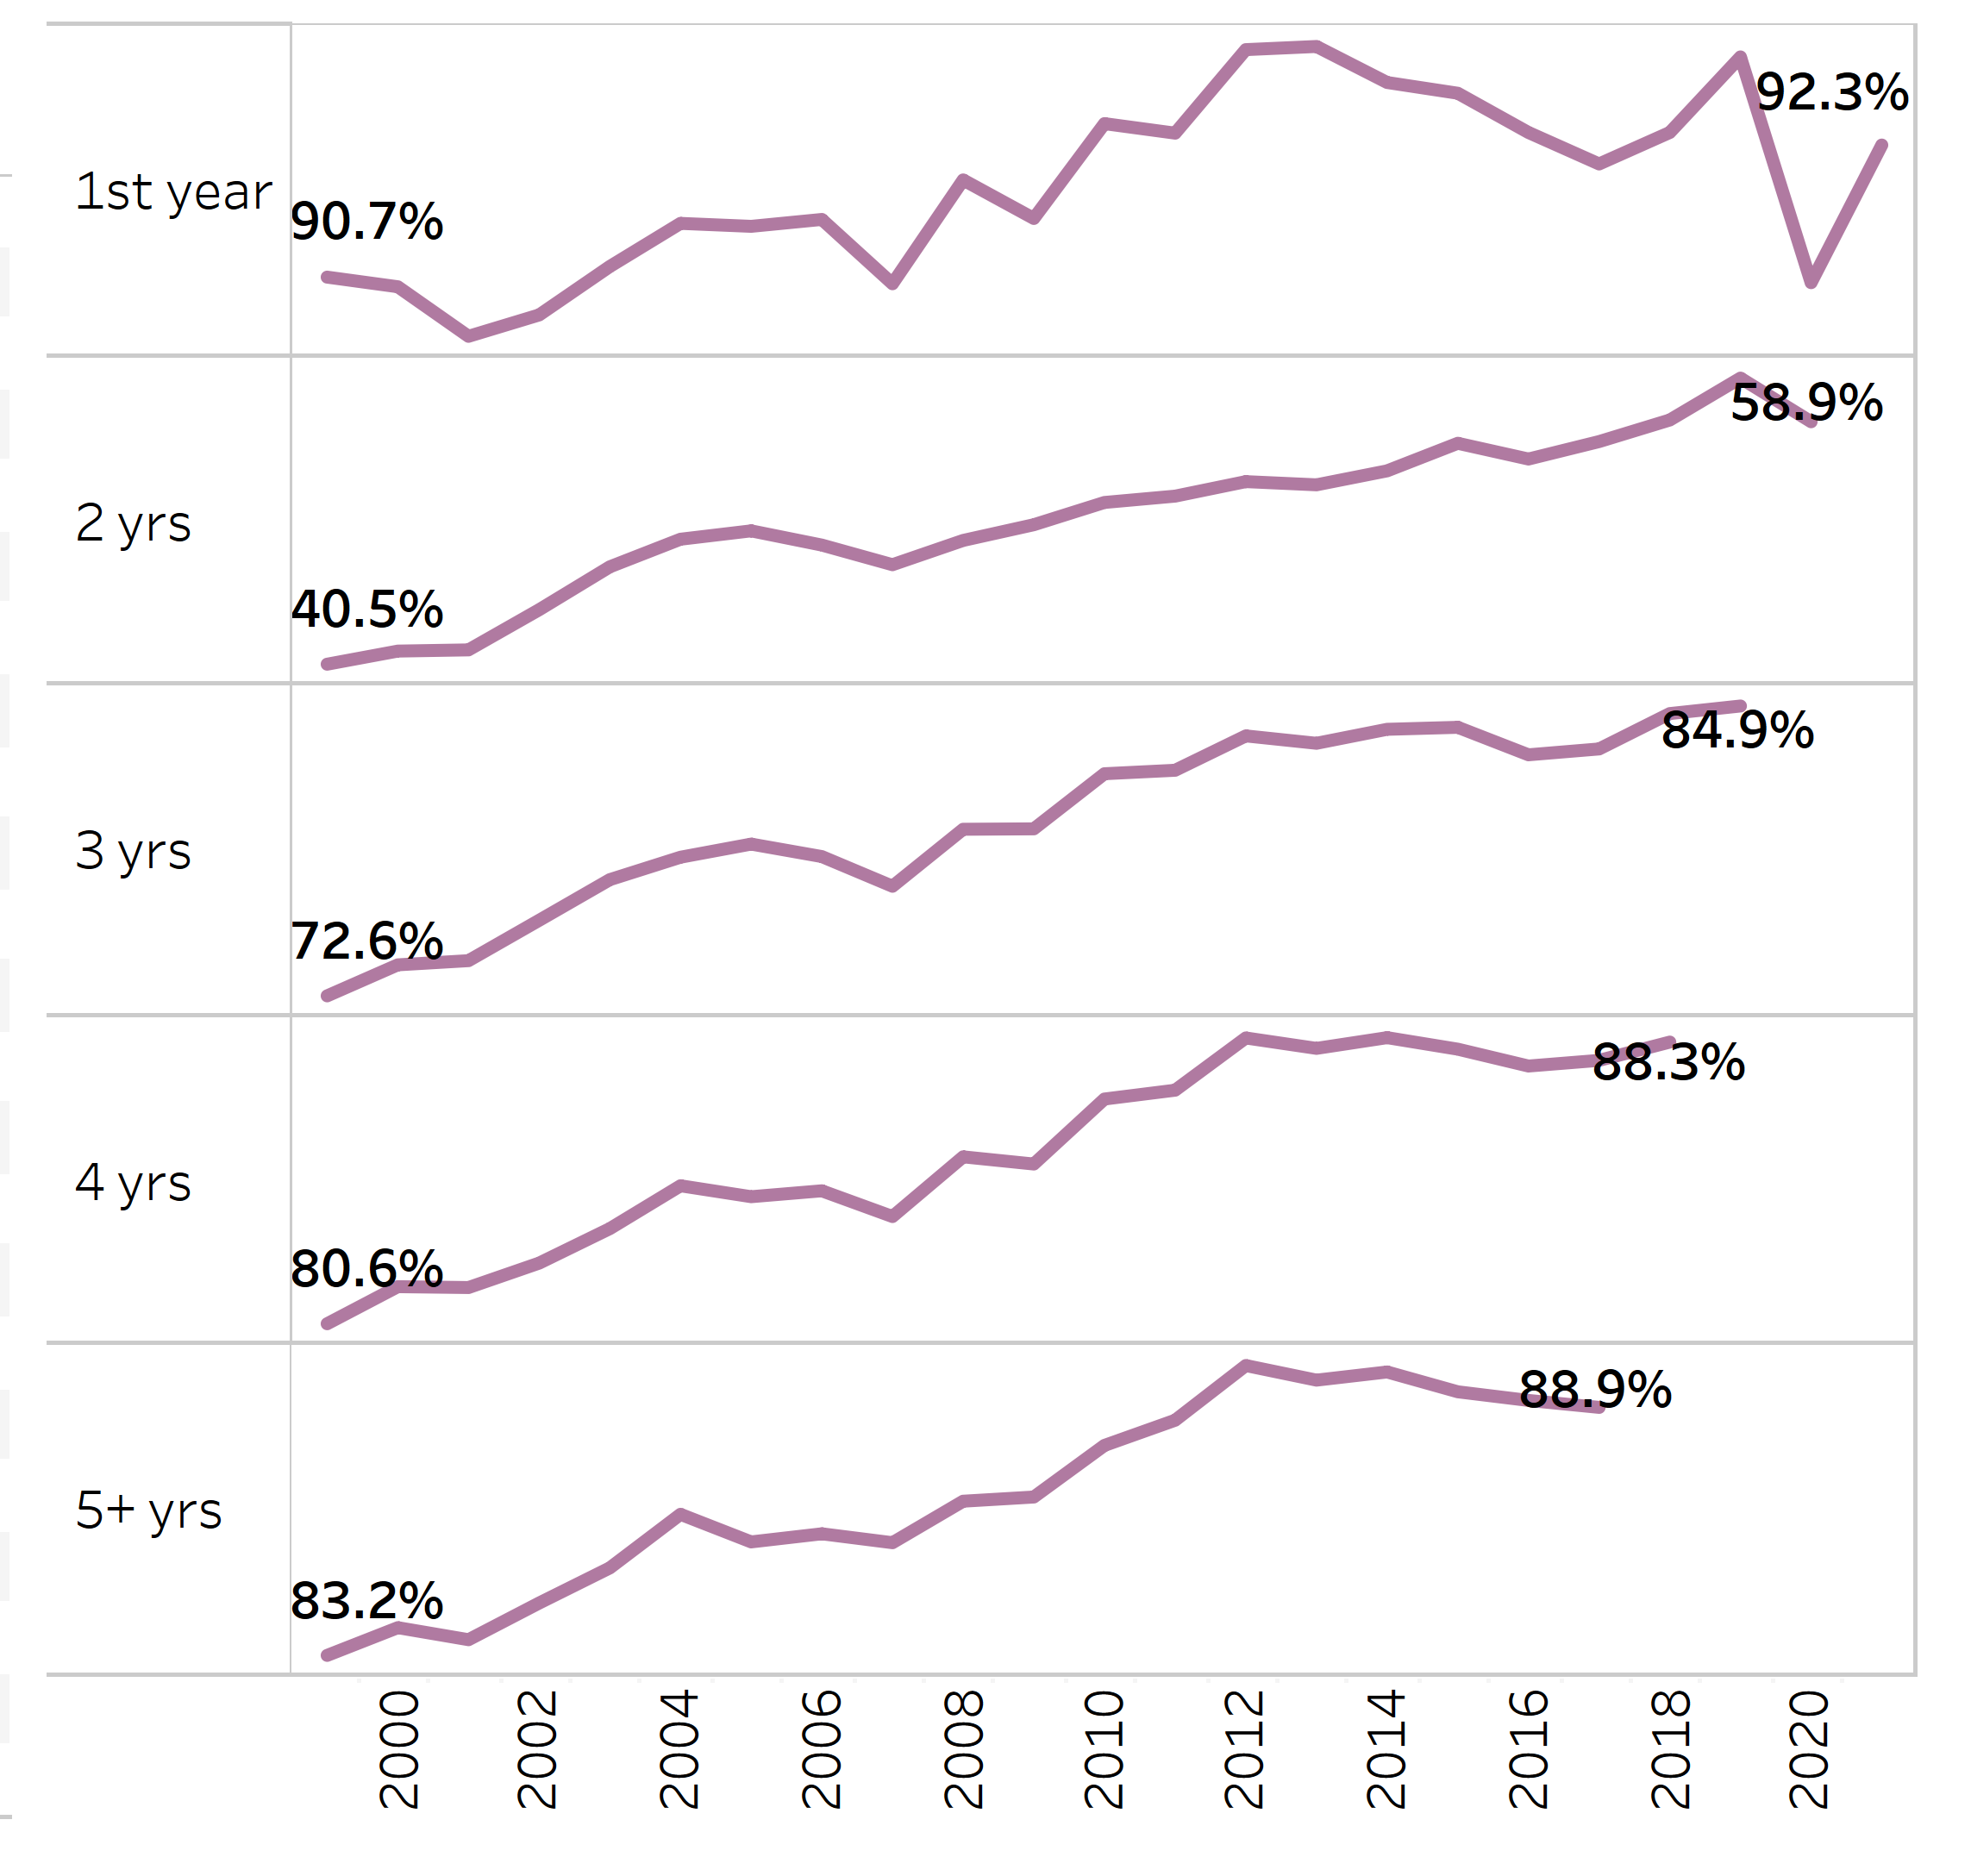
Although the four-year graduation rate of transfer first-generation students remains the same as that of the previous cohort, the six-year graduation rate of freshman first-year generation students for the recent cohort dropped slightly from that of the previous cohort. The gap in six-year graduation rates for freshmen and four-year graduation rates for transfers between first-generation and not-first-generation students is widening.
3.1 GRADUATION RATES
Academic preparation explains more of the difference in freshman graduation rates than race/ethnicity, Pell recipient status, or first-generation status alone.
3.1.10 Freshman graduation rates by HS GPA (top, middle, and bottom thirds) and race/ethnicity, Pell Grant recipient status, and first-generation status, Universitywide,Cohort entering fall 2016
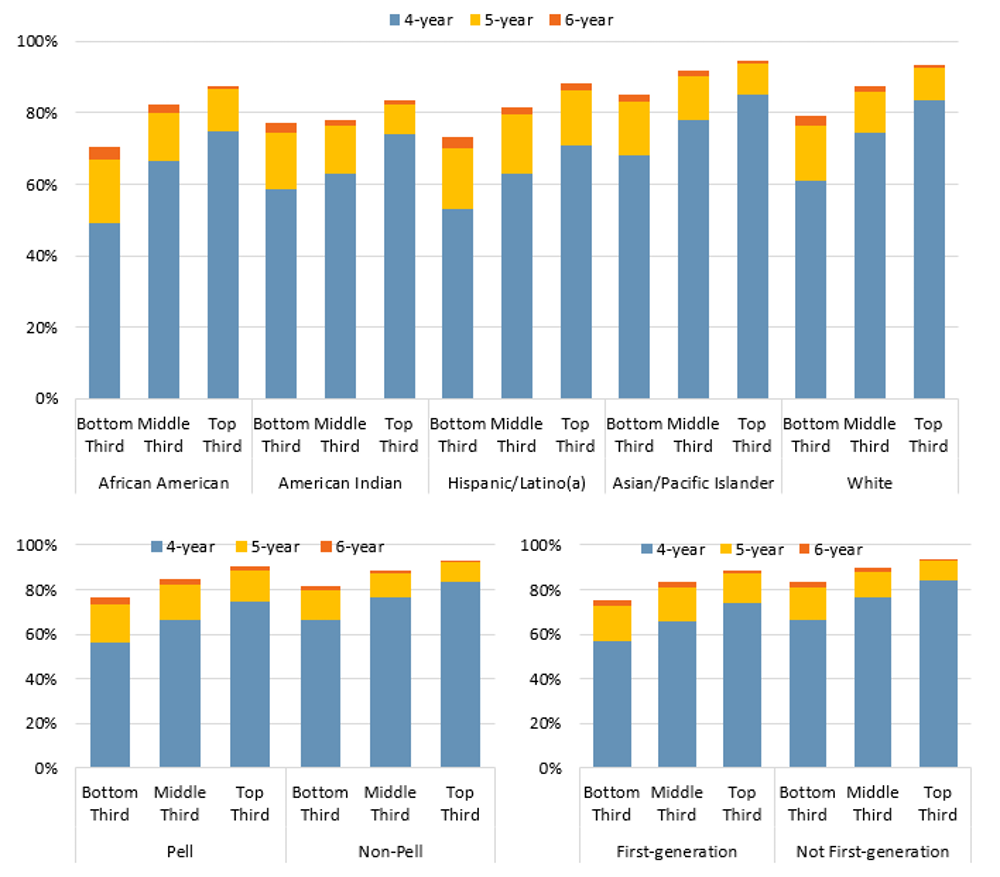
Source: UC Data Warehouse
Larger differences in graduation rates are explained by high school unweighted grade point average (GPA), which is used as a proxy measure for academic preparation of entering freshmen students. The within-group gaps for graduation rates between the lowest GPA category (“bottom third”) and highest GPA category (“top third”) are much wider than the gaps between groups when comparing the same GPA categories.
However, the four-year graduation rate gap between Pell Grant recipients and non-Pell recipients in all GPA terciles is about ten percentage points. The gaps are similar when looking at high school GPA within race/ethnicity categories and when looking at first-generation and not-first-generation students.
3.1 GRADUATION RATES
Academic preparation explains more of the difference in transfer graduation rates than race/ethnicity, Pell recipient status, or first-generation status alone.
3.1.11 Transfer graduation rates by incoming transfer GPA (top, middle, and bottom thirds) and race/ethnicity, Pell Grant recipient status, and first-generation status, Universitywide, Cohort entering fall 2018

Source: UC Data Warehouse
Larger differences in graduation rates are explained by transfer grade point average (GPA). The within-group gaps for graduation rates between the lowest GPA category (“bottom third”) and highest GPA category (“top third”) are wider than the gaps between groups when comparing the same GPA categories.
Academic preparation is an important factor to consider for those who seek to eliminate equity gaps in graduation rates and may help campuses create preemptive initiatives for students in their first year on campus.
3.1 GRADUATION RATES
Undergraduate students at UC are graduating more quickly than in previous years.
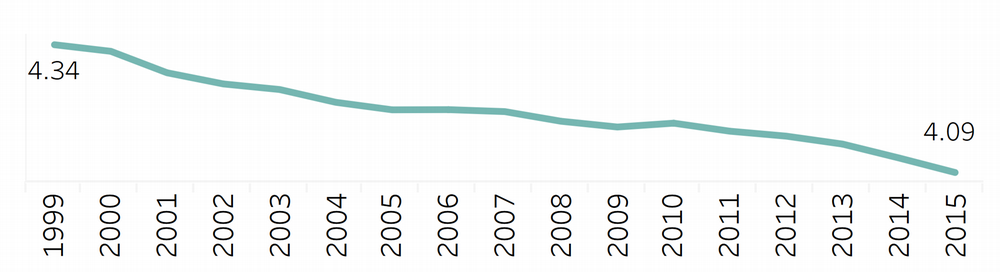
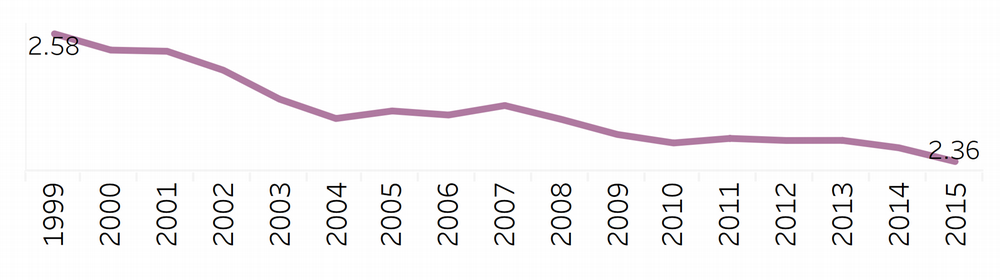
3.1.12 Average time to degree, Universitywide and UC campuses
Undergraduate graduation rates dashboard
Freshman average time to degree
Undergraduate graduation rates dashboard
Transfer average time to degree
The average time1 to earn a bachelor’s degree at UC has decreased fairly steadily since 1994. Students entering as freshmen in 2015 took an average of 4.09 years, down from 4.29 years in 2001.
For students entering as transfers, the average time to degree is 2.36 years, down from 2.55 years in 2001.
1Average time to graduation only includes students who graduated from UC within seven years.
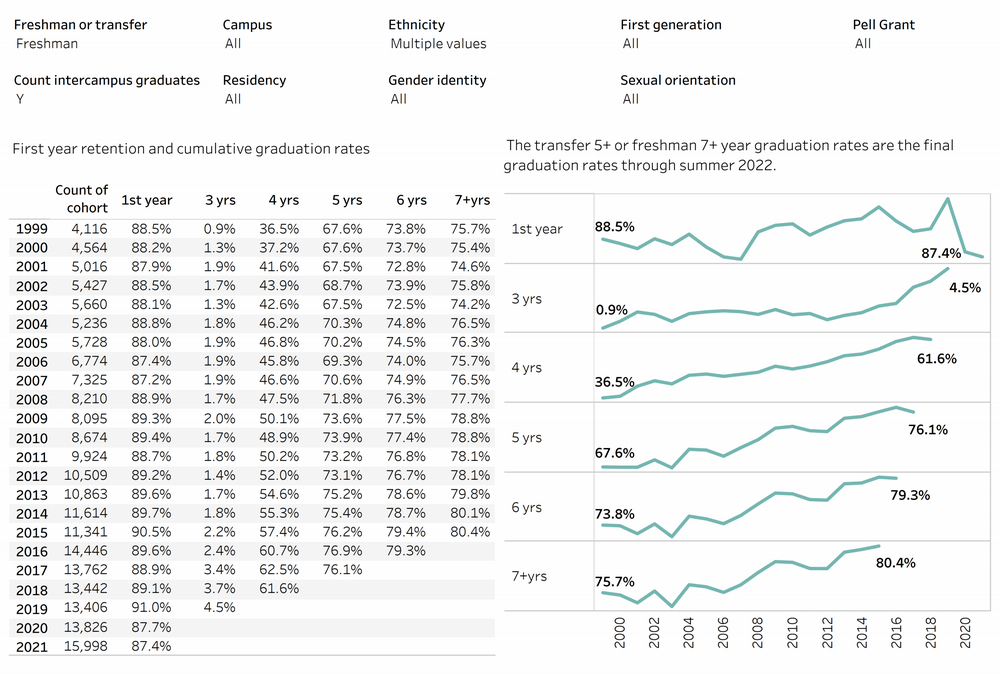
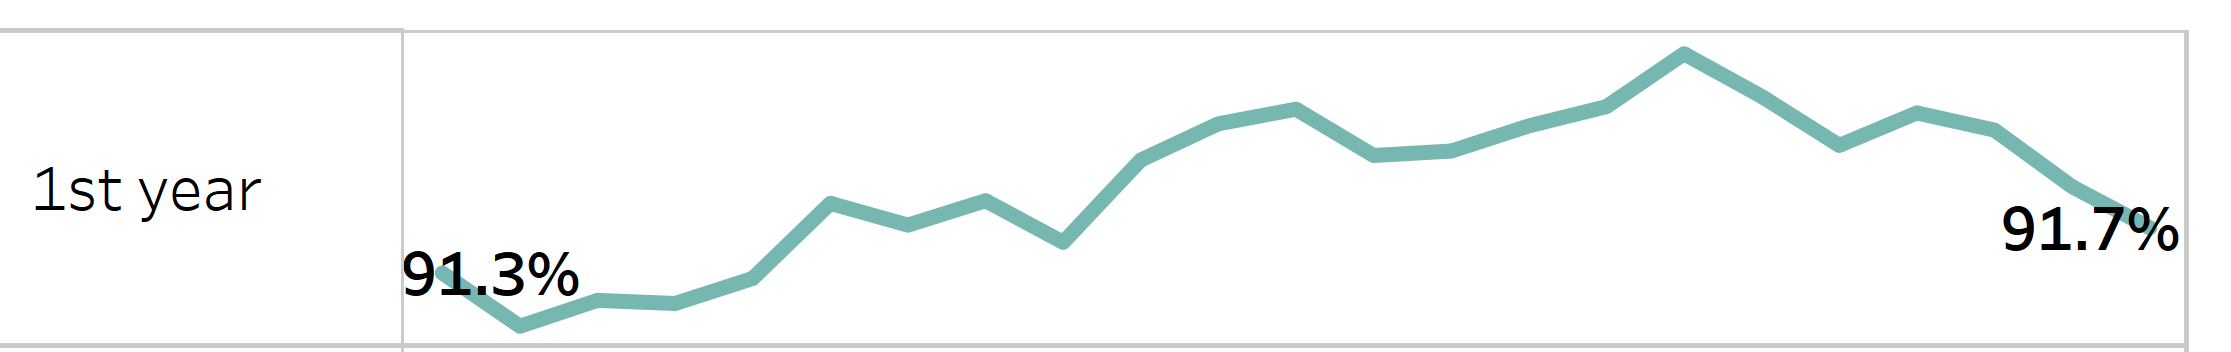
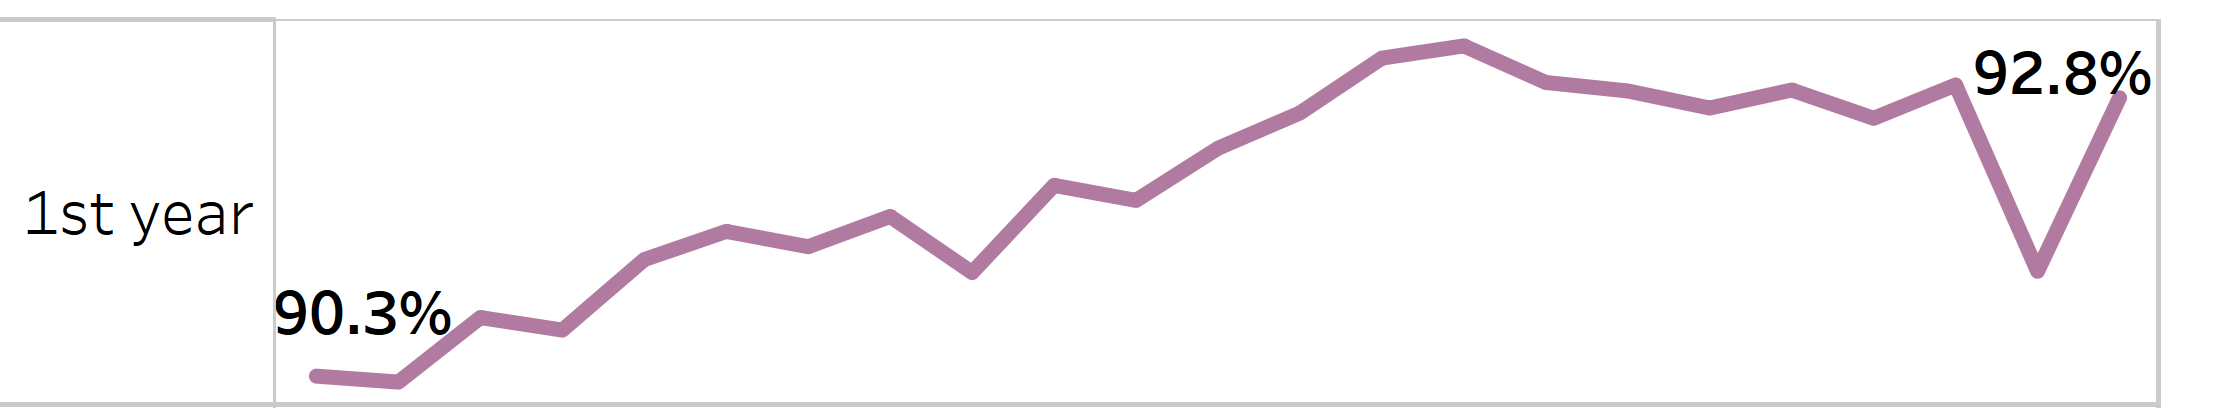
Retention rates are still over 90 percent, but freshman rates have declined recently even as the three-year and four-year graduation rates have increased.
3.2.1 First-year retention rates, UC systemwide, Cohorts entering fall 2010 to fall 2021
Undergraduate graduation rates dashboard
Freshman first-year retention rates for cohorts entering from fall 2010 to fall 2021
Undergraduate graduation rates dashboard
Transfer first-year retention rates for cohorts entering from fall 2010 to fall 2021
3.2.2 First-year retention rates, UC and comparison institutions, Cohorts entering fall 2021
Source: Freshman data from IPEDS.1 Transfer data from UC Data Warehouse. Comparison data are not available for transfers.
The current Universitywide retention rate for freshmen is 92 percent with a slight decrease from that of the previous cohort. This is comparable to non-UC AAU public institutions (92 percent) and AAU private institutions (96 percent). The Universitywide retention rate is 93 percent for transfer students, with an increase by 1.6 percentage points from the previous cohort.
1Freshmen are first-time, full-time, degree-seeking students from the fall who enroll again in the next fall term. The most recent available comparison data available from IPEDS is for 2021.
3.2.3 First-year retention rates universitywide and for Pell Grant recipients, first-generation, and URG students, Freshmen and transfer students, Cohorts entering fall 2019 and fall 2020
Undergraduate graduation rates dashboard
(select freshman or transfer and filter by category)
African American students have seen a significant decrease in first-year retention rates by two percentage points for freshmen and about eight percentage points for transfers.
Social science, life sciences, and engineering and computer science are the largest segments of bachelor’s degree recipients.
3.3.1 Undergraduate degrees awarded by discipline, UC and comparison institutions, 2020–21
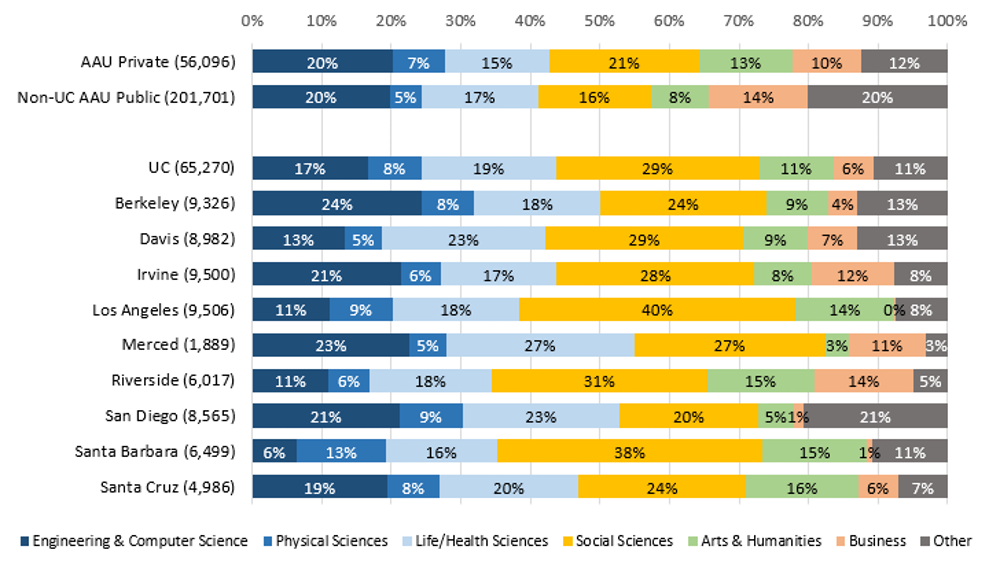
Source: IPEDS
About 44 percent of all undergraduate degrees awarded by UC in 2020–21 were in science, technology, engineering, and mathematics (STEM) fields. This is similar to the proportion at AAU public and private comparison institutions (42 and 43 percent, respectively).
Overall and across most disciplines, undergraduate degree recipients double their earnings between two and ten years after graduation.
3.3.2 Inflation-adjusted average and median alumni wages by selected majors, two, five, and ten years after graduation, Universitywide
UC undergraduate alumni outcomes in California
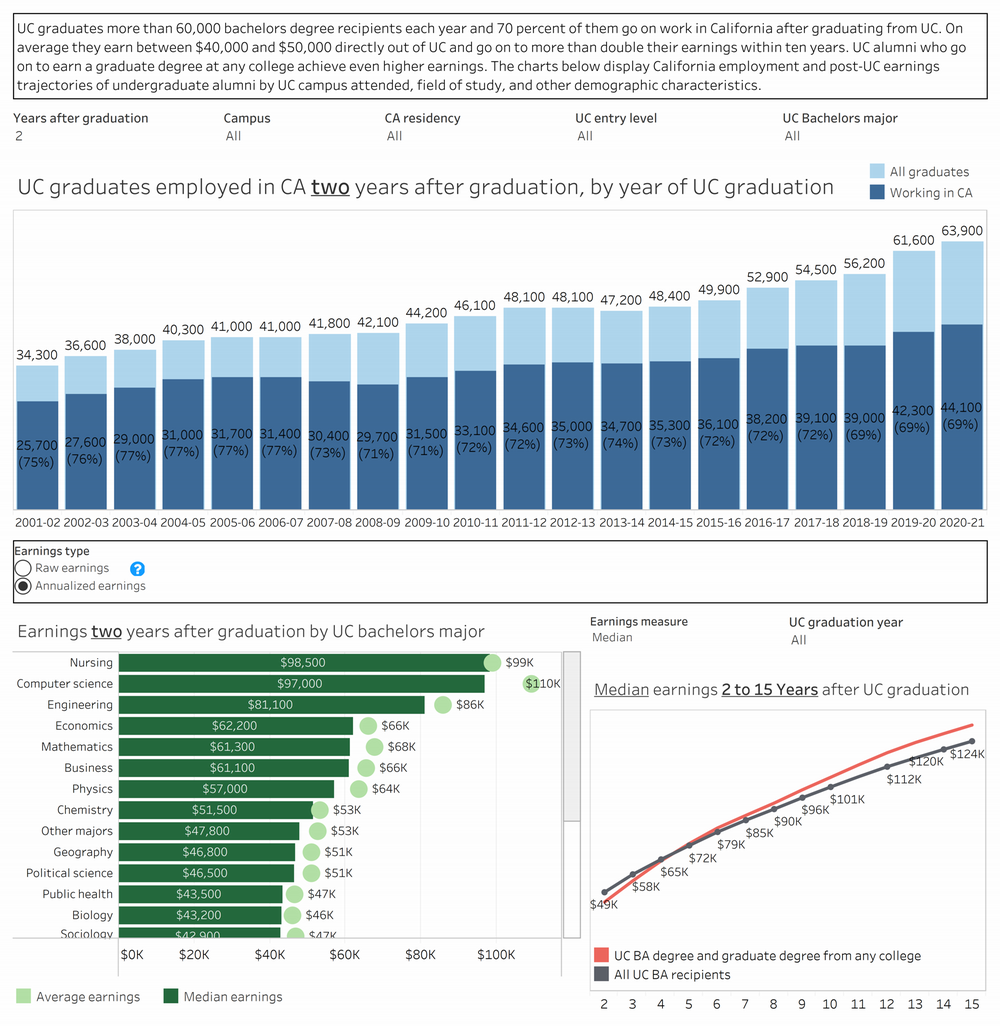
Alumni employment data provide evidence of UC’s contribution to the California economy and its role as an engine of economic mobility. Overall and across most disciplines, undergraduate degree recipients double their earnings between two and ten years after graduation.
Over time, an increasing share of degree recipients go on to work across diverse California industries, particularly health care, public administration, education, and technology- and internet-related fields.
3.3.3 Industry of employment of UC bachelor’s graduates by discipline and years after graduation, Universitywide, 2001–02 to 2019–20 graduating cohorts, combined
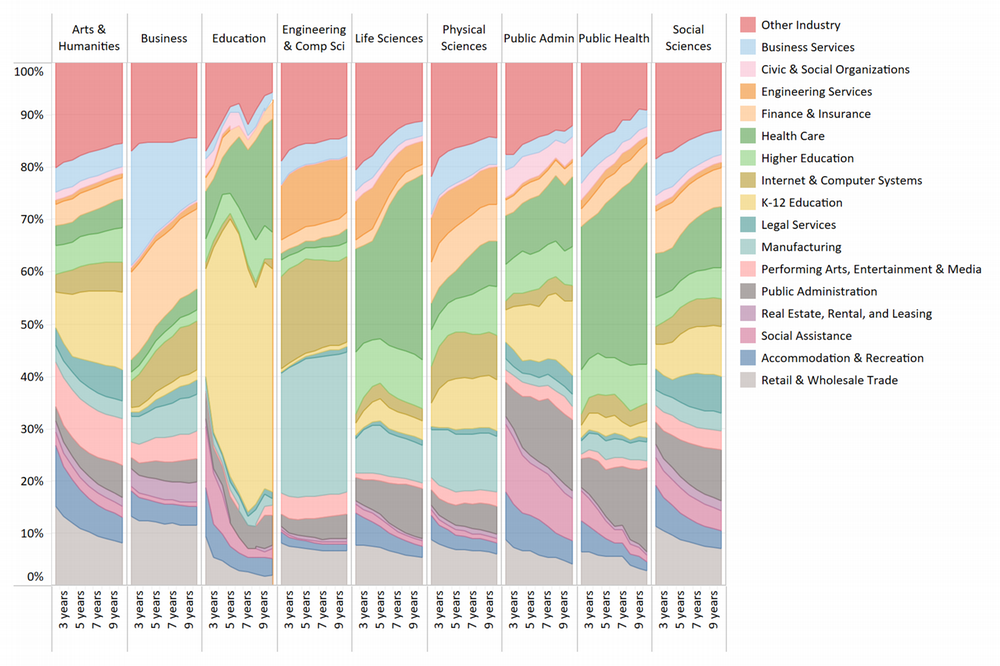
Source: California Employment Development Department and UC Corporate Student System.
Includes alumni employed in the state of California only.
UC graduates go on to work in a wide range of industries in California. Over time, bachelor’s degree graduates move to high-skill industries such as education, health care, public administration, engineering, and internet and computer systems.
A significant number of UC graduates go on to become educators within California’s K–12 and higher education systems. About four percent of UC graduates work in the states K–12 education system right after graduation and about eight percent do so within ten years of receiving their UC degree.
A large number of UC graduates also work in the state’s health care and social assistance workforce. At ten years after graduation, about 13 percent work in health care or social assistance (31 percent among life science majors).
3.3 OUTCOMES
Thirty-seven percent of undergraduate degree recipients go on to earn a graduate degree, the majority of which are masters-level degrees.
3.3.4 UC undergraduate alumni graduate degree attainment by campus, 2000 to 2016 graduating cohorts, combined, as of spring 2022
UC alumni graduate degree outcomes
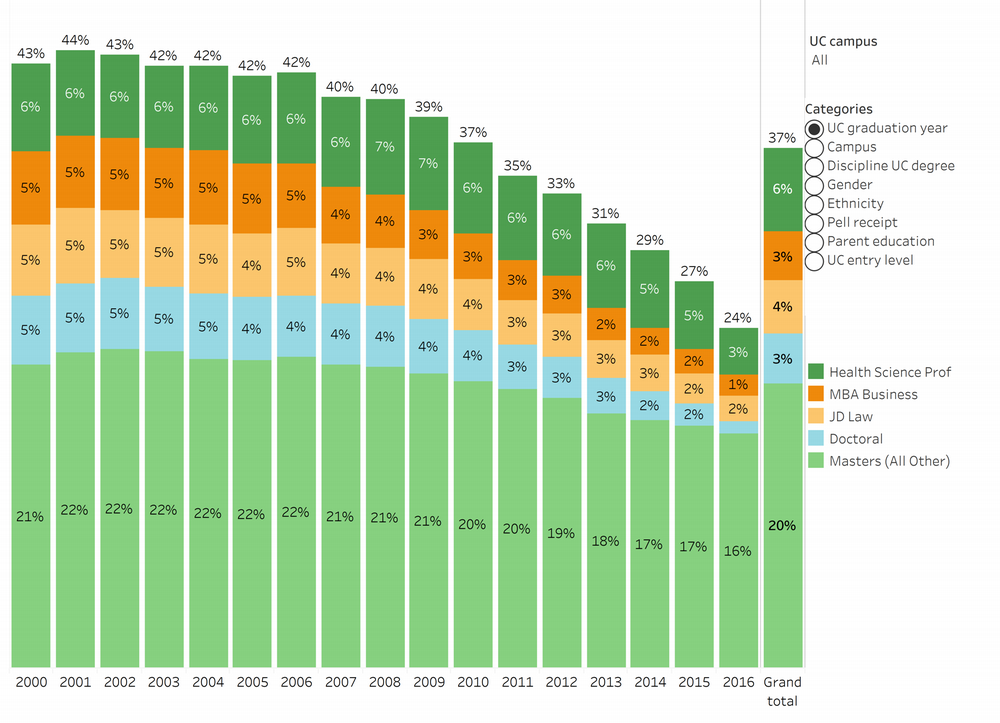
Earning a graduate degree is a major objective of many undergraduates who attend a research university. Nearly 40 percent of undergraduate students go on to earn a graduate degree after their undergraduate studies at UC. By 2030, UC aims to increase access to graduate degrees for populations that currently are less likely to attend graduate school.
For more information
UC First-Generation Faculty Initiative (website)
Eliminating gaps in timely graduation (pdf)
UC’s report on Advising Strategies to Support Timely Graduation (pdf)
Beyond economic impact: Understanding societal impacts and public value of a UC degree (pdf)
Fiat Lux: What is the value of a UC degree? (pdf)
UC 2030 dashboard outlines systemwide and campus 2030 goals
Undergraduate graduation rates dashboard with graduation rates and goals by campus, gender, Pell, residency status, race/ethnicity, and other factors
UC undergraduate alumni outcomes in California dashboard describes UC’s undergraduate alumni outcomes, including employment industries and earnings
Degrees awarded data dashboard shows total degrees awarded by degree type, campus, gender, and race/ethnicity
CLIMB mobility analysis dashboard explains UC’s role in enabling low-income students to achieve intergenerational economic mobility
First-generation college students dashboard
UC undergraduate student research, internships, and service learning dashboard
UC student success dashboards
The complete UC Information Center Undergraduate outcomes subject area
The complete UC Information Center Alumni economic mobility subject area
Download data tables for chapter 3 indicators (Excel format)