Chapter 4:
GRADUATE ACADEMIC and GRADUATE PROFESSIONAL STUDENTS
goals
California’s Master Plan for Higher Education gives the University of California the responsibility of enrolling and preparing graduate academic and professional students to help meet the workforce needs of California and the nation and to further the UC mission of teaching, research, and public service. As part of its 2030 Framework, UC is pursuing a goal of producing 200,000 additional degrees through 2030 beyond the projected baseline of one million degrees. About 40,000 of these additional degrees are projected to be at the graduate level, with growth primarily achieved through increased graduate enrollment across the system.
A more diverse and inclusive community of scholars at all levels has been another longstanding goal for UC. UC’s Growing Our Own: Graduate Enrollment and Diversifying Ph.D. Pathways systemwide initiative aims to improve inclusion within UC’s academic community by building sustainable pathways for students from first-generation, low-income, and underrepresented racial/ethnic groups to the professoriate. It seeks to achieve these goals by expanding existing programs at UC and creating stronger connections among institutions of higher education for identifying and cultivating talent. In particular, the Growing Our Own initiative plans to increase the number and proportion of UC undergraduate degree recipients who earn an academic doctoral degree, and to increase the number and proportion of UC academic doctoral graduates from UC, California State University (CSU), other Hispanic-Serving Institutions (HSIs), Historically Black Colleges and Universities (HBCUs), and Tribal Colleges and Universities (TCUs). Using relevant data, each UC campus established growth targets achievable by 2030 for Ph.D. enrollments from UC undergraduates and students from CSU, HBCU, other HSI, and TCU institutions. The goal is to increase enrollments from these schools to 40 percent from the current level of 27 percent.
The 2022 Multi-Year Compact with the state of California sets additional goals for UC’s graduate education enterprise through 2026–27. First, UC will seek to increase graduate enrollment by adding 2,500 additional graduate students across the system. Second, UC will aim to prioritize its graduate enrollment growth in high-need disciplines that support state workforce needs, including healthcare, STEM, climate action, and education. Lastly, UC will endeavor to increase the number of graduate STEM degrees and academic doctoral degrees to both support high-demand career pipelines and to produce future faculty for the state’s public higher education segments.
This chapter provides an update on progress toward these goals along with other key indicators of the success and impact of UC’s graduate education enterprise.
Universitywide graduate academic master’s enrollment has increased since 2013, while doctoral enrollments have remained relatively flat.
4.1.1 Graduate academic applications, admits, and new enrollees by degree program, Universitywide, Fall 2013 and 2022

Graduate admissions dashboard
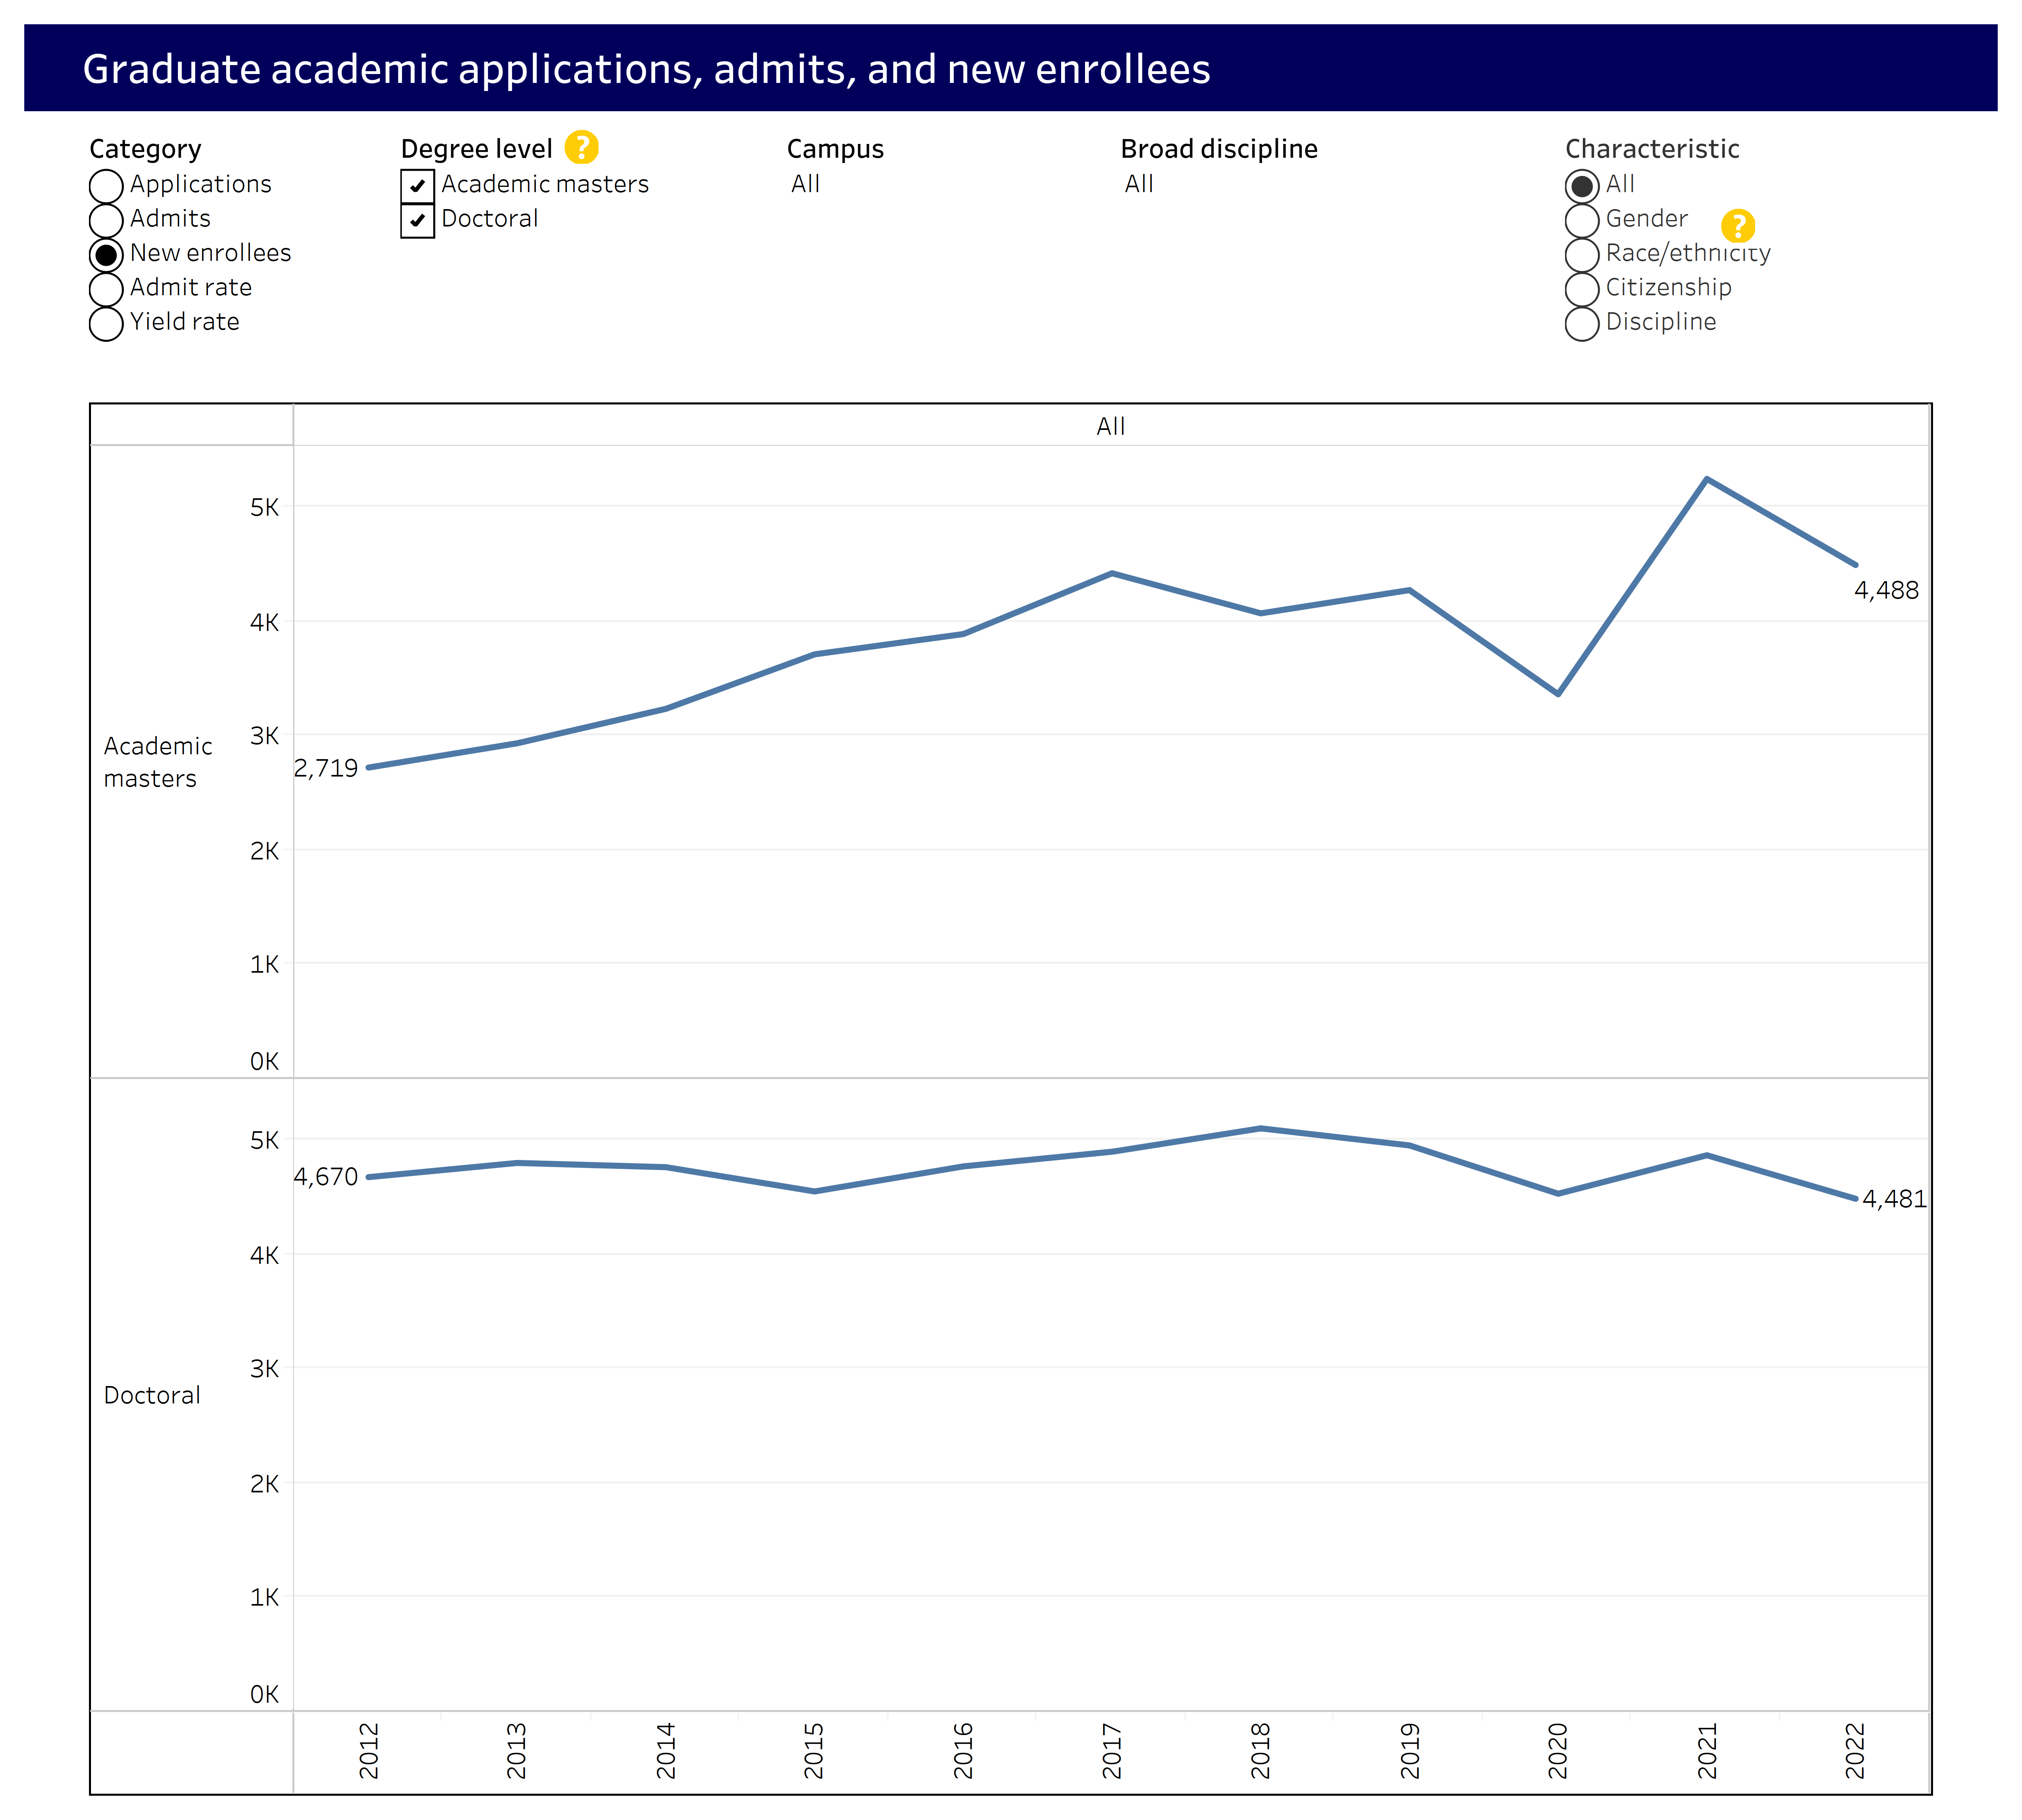
The demand for UC academic master’s and doctoral programs remains strong and has grown substantially over the last decade but admits and new enrollees for doctoral programs have remained flat. Enrollment growth in engineering and computer science at the master’s level, however, has been robust. Increasing the size of entering classes of graduate students will be important in achieving enrollment and degree production goals in the next several years.
Note: A small number of professional doctoral programs are also included in these data. Universitywide applications and admits are duplicated in this report since students often apply to more than one campus.
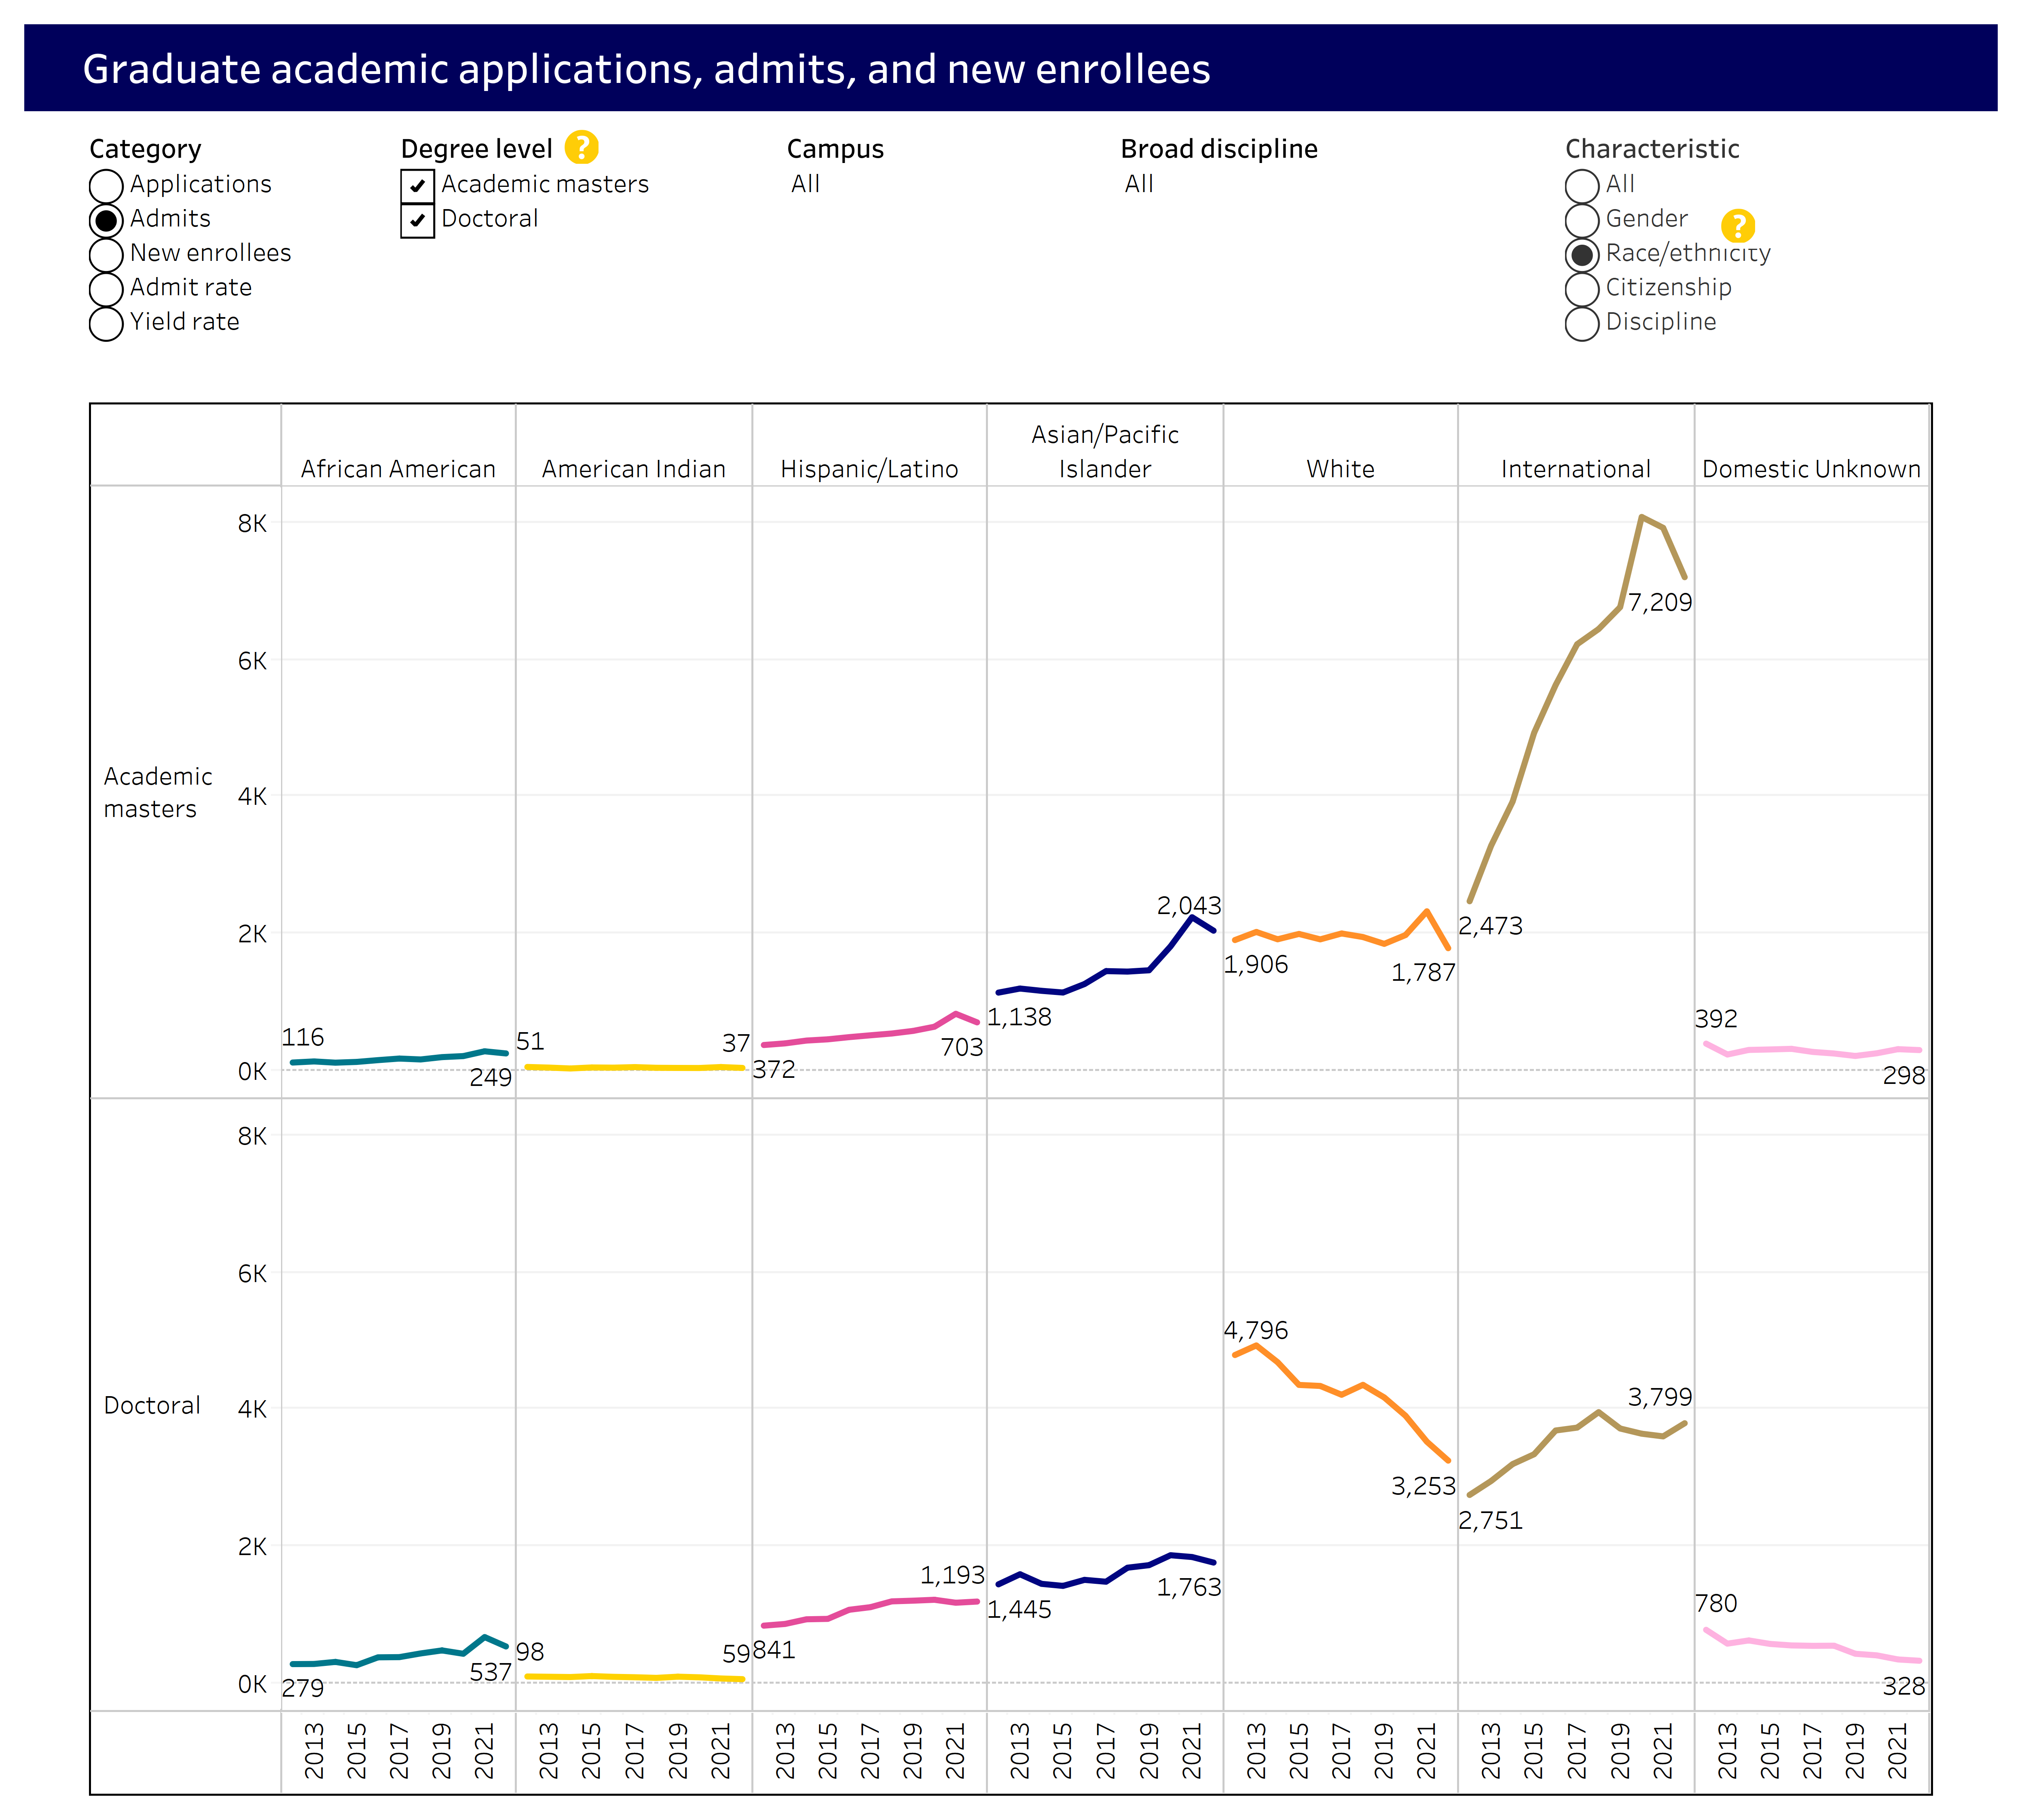
Since 2013, the number and share of graduate academic master’s admissions have significantly increased for international students but less so for doctoral admits.
4.1.2 Graduate academic applications, admits, and new enrollees by race/ethnicity and discipline, Universitywide, Fall 2013 and 2022
Graduate admissions dashboard applicants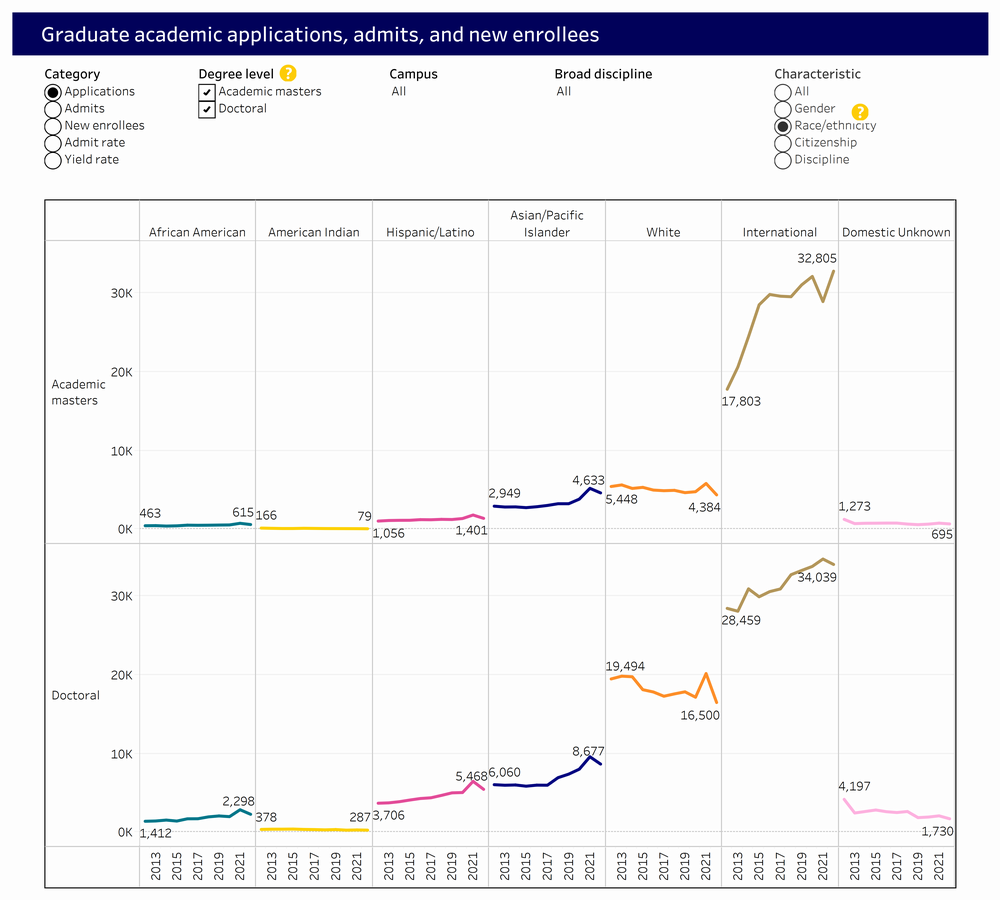
Graduate admissions dashboard admits
Graduate admissions dashboard enrollees
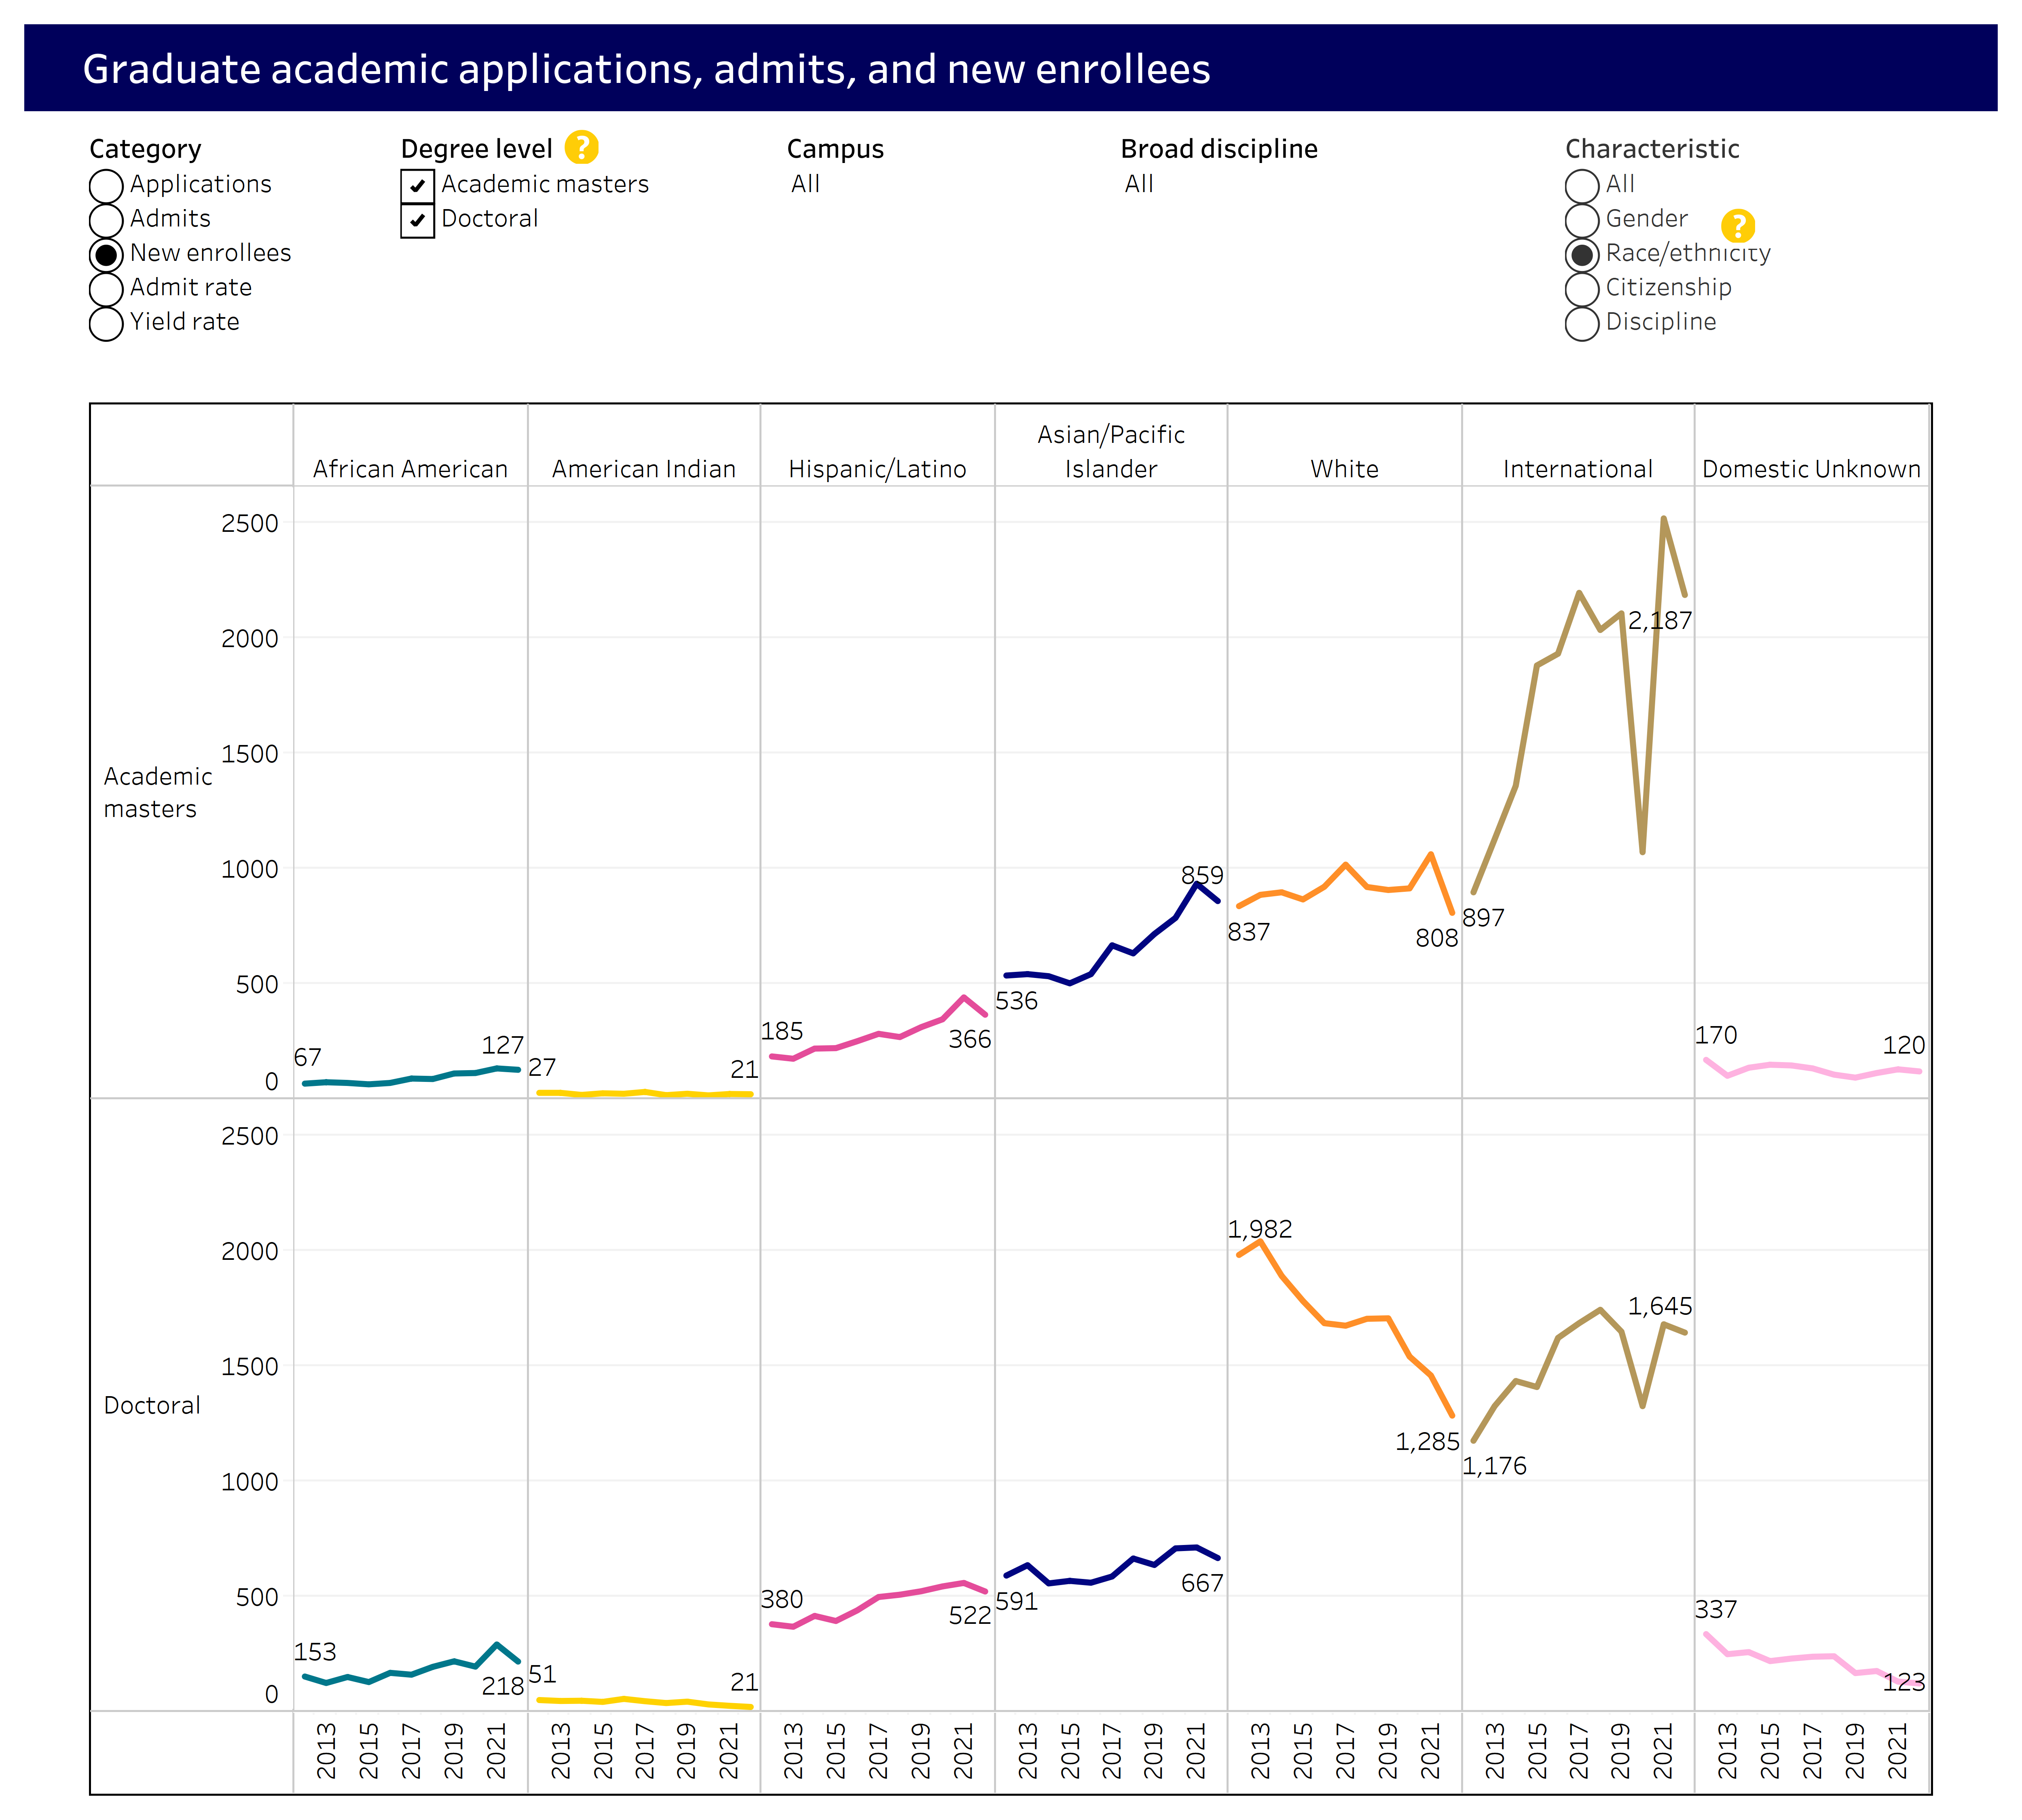
International students represent the majority of applicants, admits, and new enrollees in engineering and computer science graduate academic master’s programs. Social science and humanities programs have the highest shares of enrollment among students from underrepresented racial/ethnic groups, and those shares increased between 2013 and 2022.
Note: A small number of professional doctoral programs are also included in these data. Universitywide applications and admits are duplicated in this report since students often apply to more than one campus.
Graduate enrollment, as a share of UC’s total undergraduate and graduate enrollment, has increased slightly in recent years due to growth of self-supporting programs.
4.2.1 Graduate enrollment share of total, Universitywide, Fall 2003 to Fall 2022
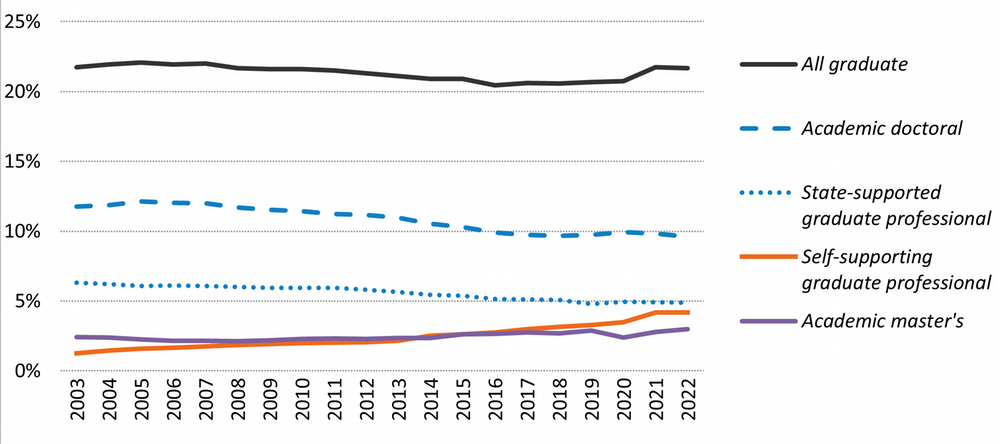
Source: UC Corporate Student System
With 22 percent graduate enrollment in 2022, including health science students, UC was lower than the average for non-UC AA public institutions, at 28 percent, and the average for AAU private institutions, at 57 percent. Growth in UC’s academic master’s and professional self-supporting programs has been the most robust in recent years, with academic doctoral enrollments remaining steady.
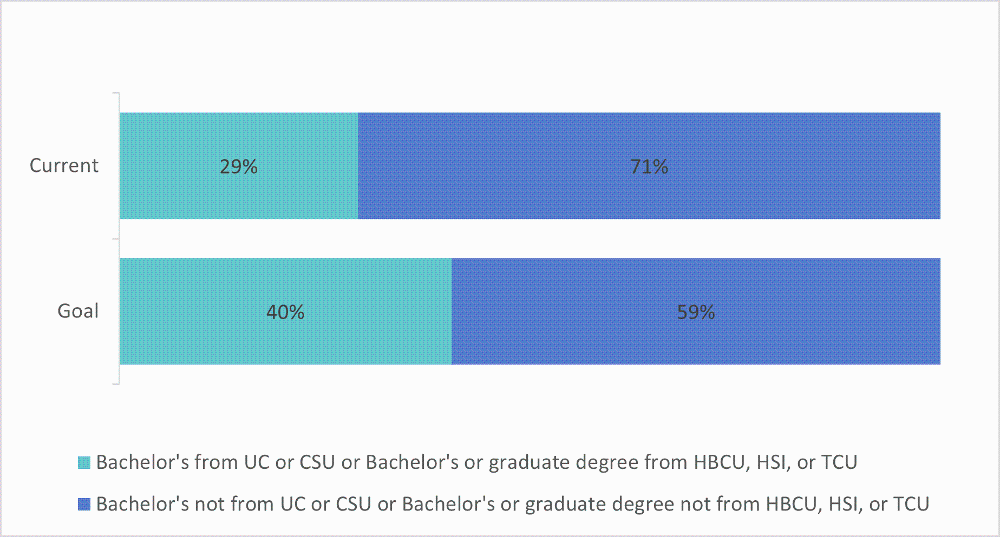
UC’s goal is to have 41 percent of academic doctoral students come from UC, CSU, HBCUs, other HSIs, and TCUs that are more racially/ethnically diverse than students from other undergraduate institutions.
4.2.2 Academic doctoral entering student enrollment by undergraduate institution and race/ethnicity, Universitywide, Fall 2018–2022
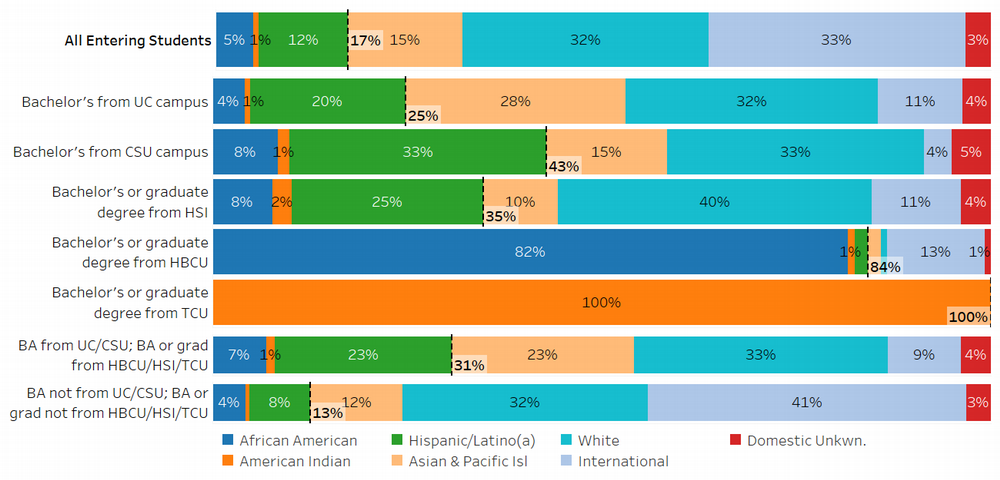
Current percent of all academic doctoral students from UC/CSU/HBCU/HSI/TCU and Growing Our Own goal
Source: UC Corporate Student System
UC seeks to enroll a higher proportion of academic doctoral students from a UC, California State University (CSU), Historically Black College and Universities (HBCU), Hispanic Serving Institutions (HSI; non-UC/CSU), or Tribal Colleges and Universities (TCU). Students from these institutions are nearly twice as likely to be from underrepresented groups, thus helping UC achieve its goals of diversifying both its doctoral student population and the California professoriate. Since 2022, UC has moved closer to this goal by increasing the share of doctoral students from these target institutions from 27 percent to 29 percent.
More than three-quarters of UC academic doctoral students graduate with no debt. Doctoral students in the physical and life sciences have seen smaller increases in debt since 2007–08 and graduate with less loan debt than those in the social sciences and arts and humanities.
4.2.3 Academic doctoral students’ graduate debt at graduation, by discipline, domestic students, Universitywide, Graduating classes of 2007–08 to 2021–22 (every two years)
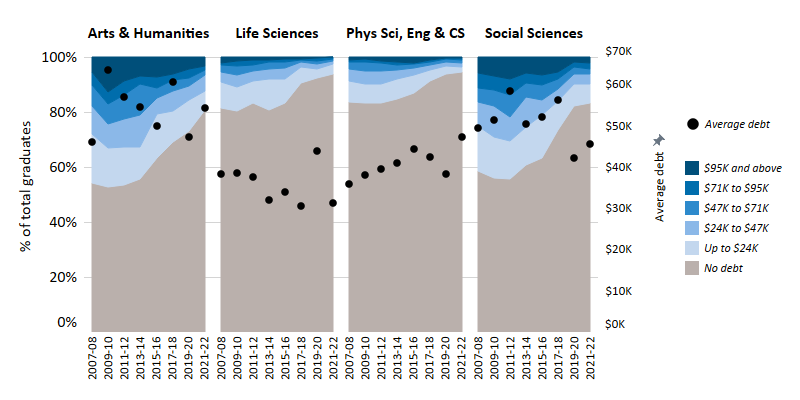
Source: UC Corporate Student System
Depending on the field of study, 80 percent or more of UC academic doctoral students graduate with no student loan debt. Several factors account for the variation in debt across the STEM fields and social sciences or humanities, including higher levels of funding through research grants available in STEM fields and longer average time to degree in social sciences and humanities.
Graduates with the highest debt levels come from professional schools that charge higher supplemental tuition.
4.2.4 Graduate professional degree student debt at graduation, by discipline, domestic stufdents, Universitywide, Graduation classes of 2007–08 to 2021–22 (every two years)
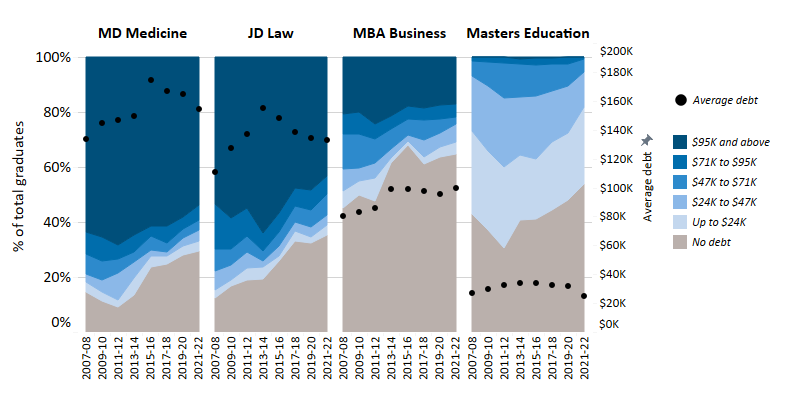
Source: UC Corporate Student System
Graduate professional students rely more on borrowing, with roughly 50 percent of their financial support coming in the form of loans. Graduate funding models require greater reliance on loans for professional degree students, as their programs are of shorter duration, and many fields offer potentially higher incomes after graduation.
UC awards 78.5 percent of graduate academic degrees in science, technology, engineering, and mathematics (STEM) fields.
4.3.1 Graduate academic degrees awarded by discipline, UC and AAU private and public comparison institutions, Number of degrees grouped in 3-year intervals: 2009–10 to 2020–21
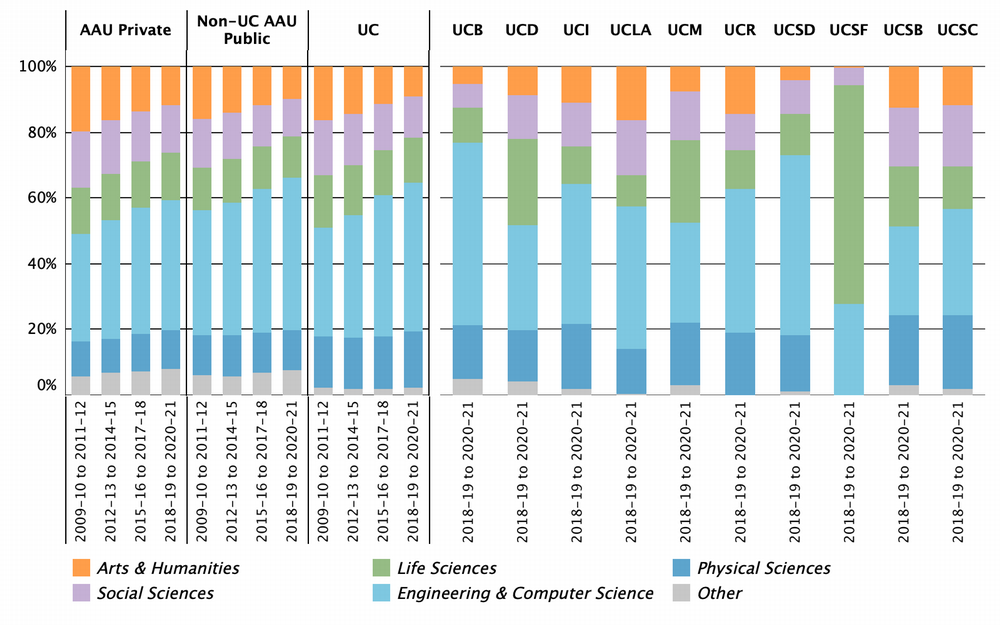
Source: IPEDS
UC’s graduate STEM programs reflect the predominant industries in California’s economy. In addition to leading all California institutions in the production of engineering and computer science degrees, UC far outpaces them in the production of degrees in the biological sciences.
UC’s doctoral completion rate increased in nearly every field over the two most recent cohorts studied.
4.3.2 Doctoral completion rates after ten years, by broad field, Universitywide, Fall 2004–2006, 2007–2009, and 2010–2012 entry cohorts
Doctoral persistence and completion dashboard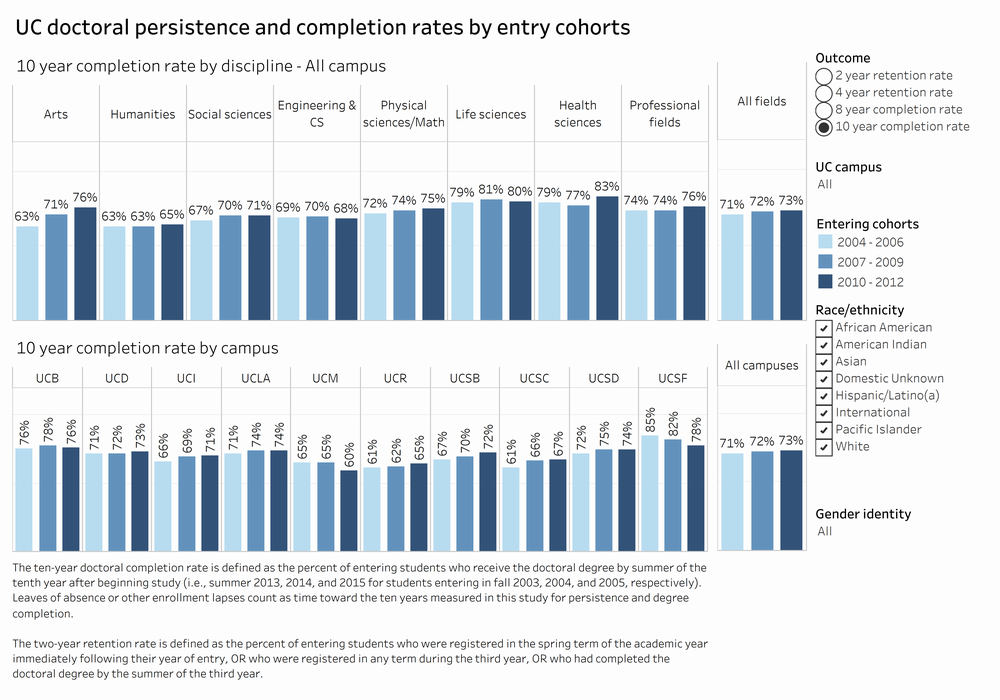
Over 70 percent of UC academic doctoral students complete their degrees within ten years. Life sciences and health sciences continue to have the highest completion rates compared to social sciences and humanities, which typically have longer normative completion time.
UC’s median time-to-doctorate by race/ethnicity and gender compares well with AAU institutions.
4.3.3 Median time-to-doctorate, by ethnicity and gender, Universitywide, AAU public and AAU private comparison institutions, 2015 to 2019 exit cohort
Time-to-doctorate dashboard
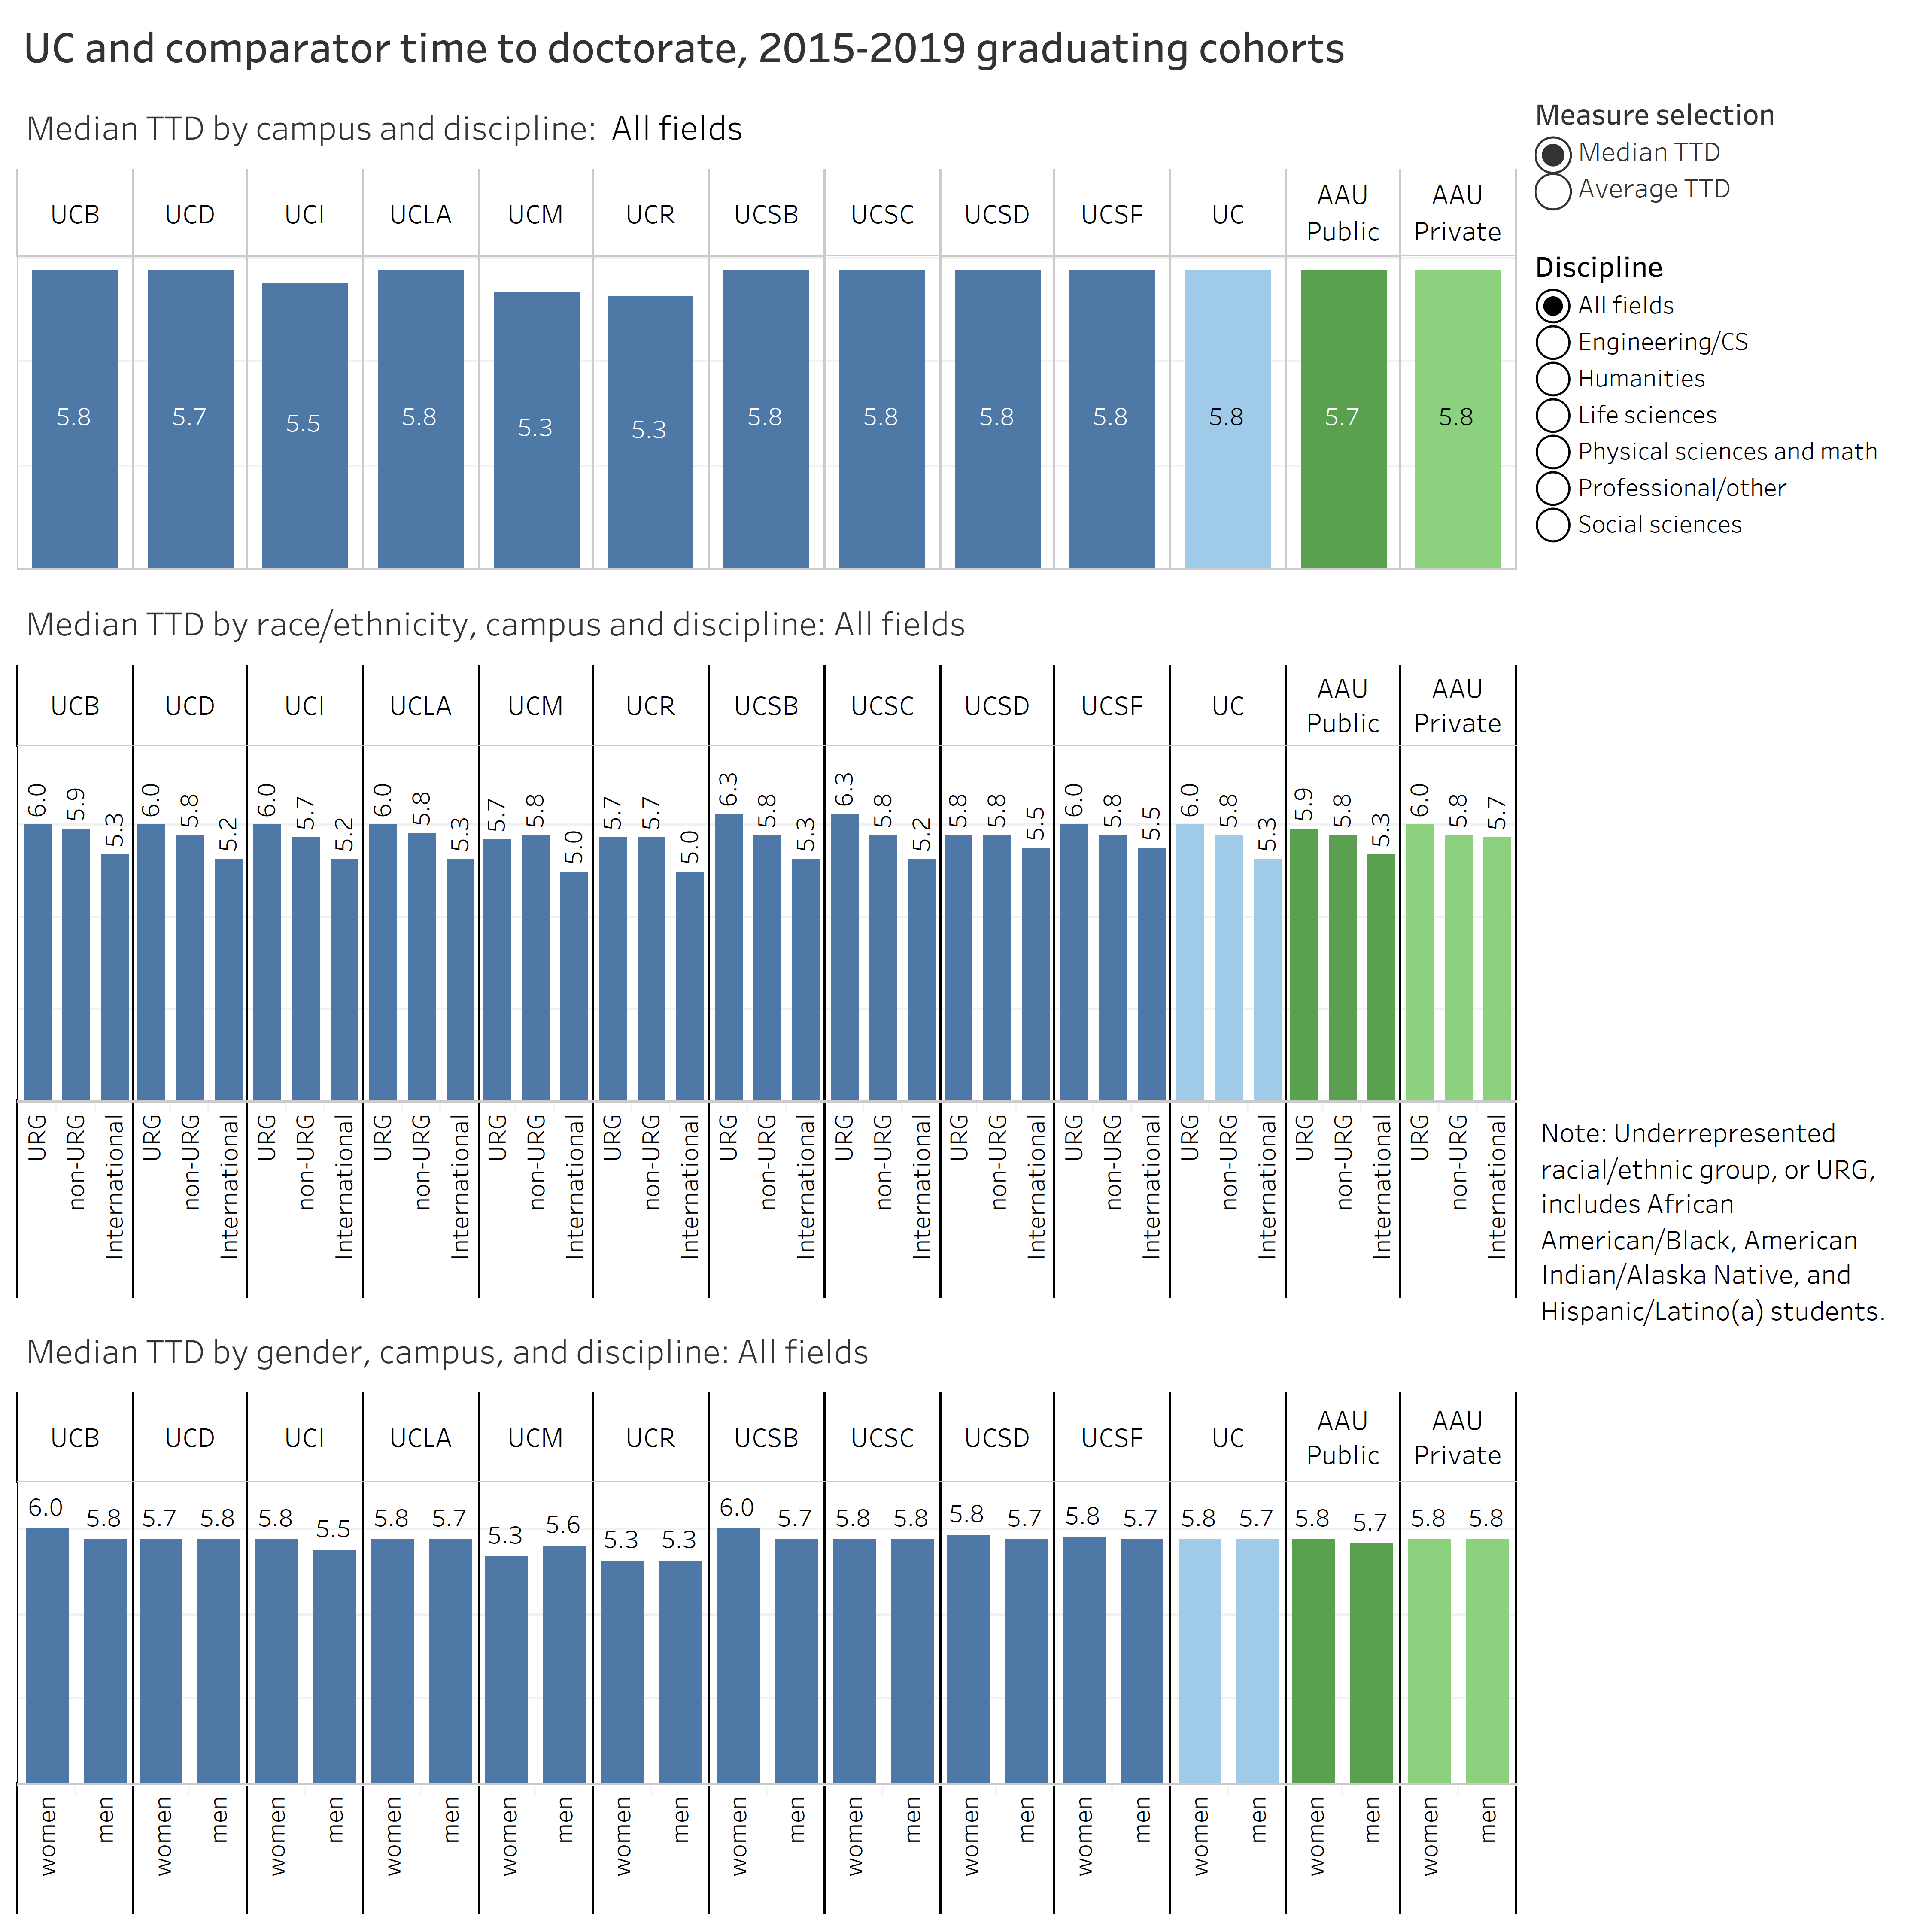
The median number of years required to complete a doctoral degree at UC is comparable to that at other major research universities. Men and women complete the doctorate in about the same amount of time at UC. Students from underrepresented groups (URG) have longer time-to-doctorate at UC and comparison institutions, whereas international students required substantially less time to complete the doctorate.
UC’s median time-to-doctorate varies by race/ethnicity, gender, and discipline, ranging from 4.0 to 7.8 years.
4.3.4 Median time-to-doctorate, by race/ethnicity and discipline, Universitywide, 2019 through 2021 exit cohort
Time-to-doctorate dashboard
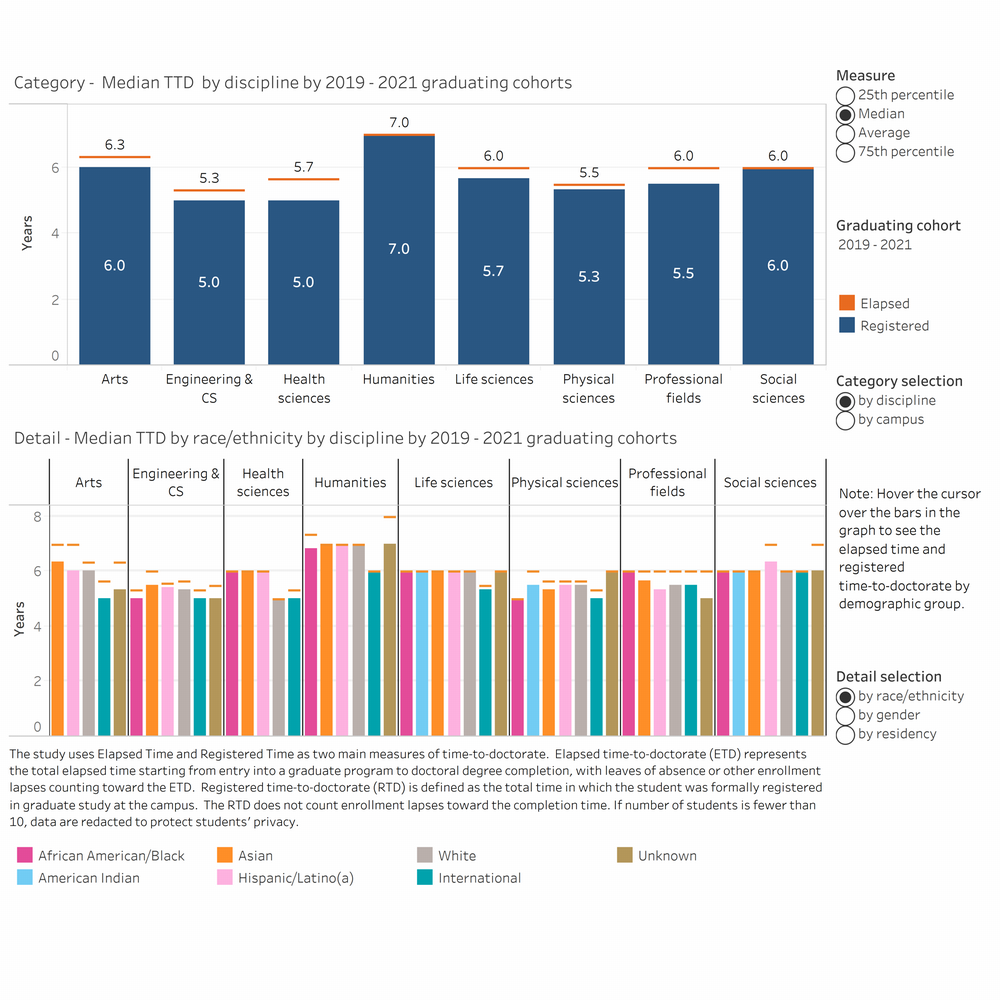
4.3.5 Median time-to-doctorate, by gender and discipline, Universitywide, 2019 through 2021 exit cohort
Time-to-doctorate dashboard
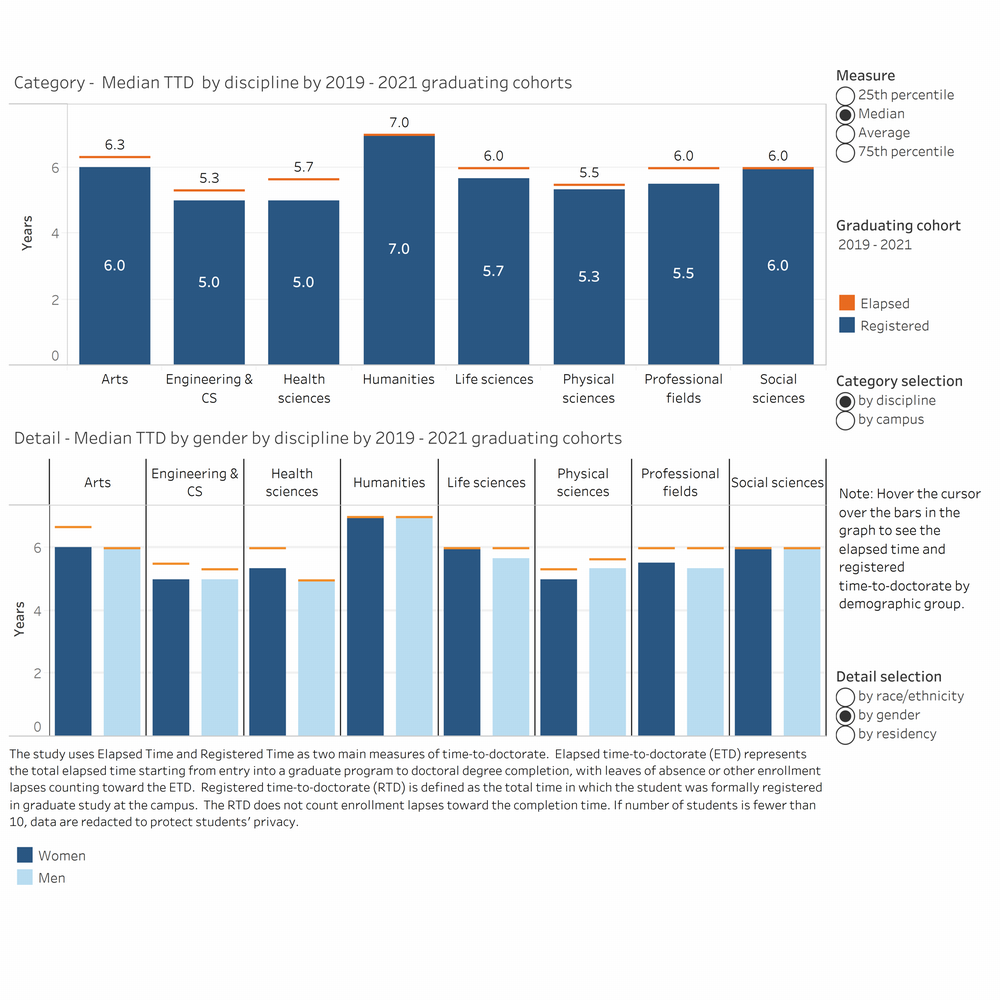
Registered and elapsed time-to-doctorate vary by discipline, with most students requiring about seven years of total time and five to six years of registered time. International students have shorter elapsed time-to-doctorate (ETD) and registered time-to-doctorate (RTD) in most disciplines. Men and women generally have comparable time-to-doctorate.
Note: Elapsed time-to-doctorate (ETD) represents the total elapsed time starting from entry into a graduate program to doctoral degree completion, with leaves of absence or other enrollment lapses counting toward the ETD. Registered time-to-doctorate (RTD) is defined as the total time in which the student was formally registered in graduate study at the campus.
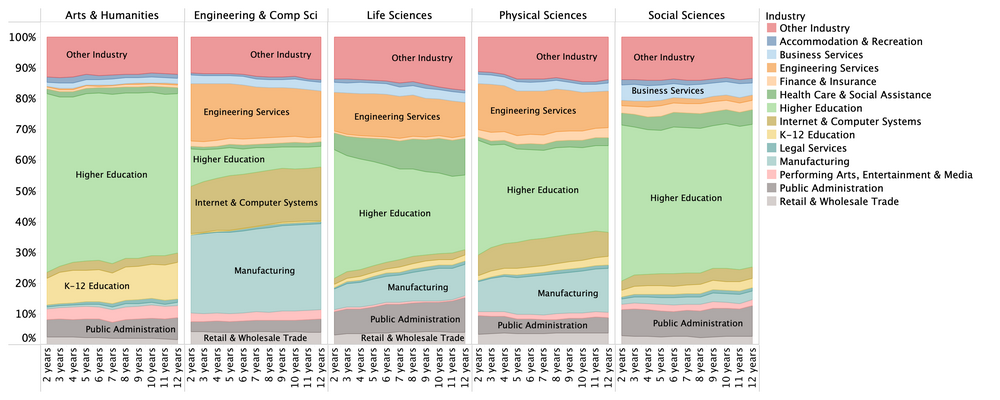
Half of UC academic doctoral and master’s graduates who stay in California work in higher education.
4.3.6 Industry of employment of UC graduate academic students in CA, by year after graduation, Universitywide, 2000 to 2019 graduating cohorts
Source: California Employment Development Department and UC Corporate Student System
Graduates of UC academic doctoral and master’s degree programs go on to work in a broad range of industries in California. Large proportions of graduates in most disciplines go on to work in higher education, while engineering and computer science graduates are more likely to work in a broader set of industries including manufacturing, engineering, and internet and computer systems.
UC awards a high proportion of professional degrees in business and law.
4.4.1 Graduate professional degrees awarded by discipline, UC and AAU private and public comparison institutions, Number of degrees grouped in 3-year intervals: 2009–10 to 2020–21
Source:IPEDS
The proportion of professional degrees awarded by UC is comparable to AAU private and public institutions, with the greatest proportion of degrees awarded in business and law.
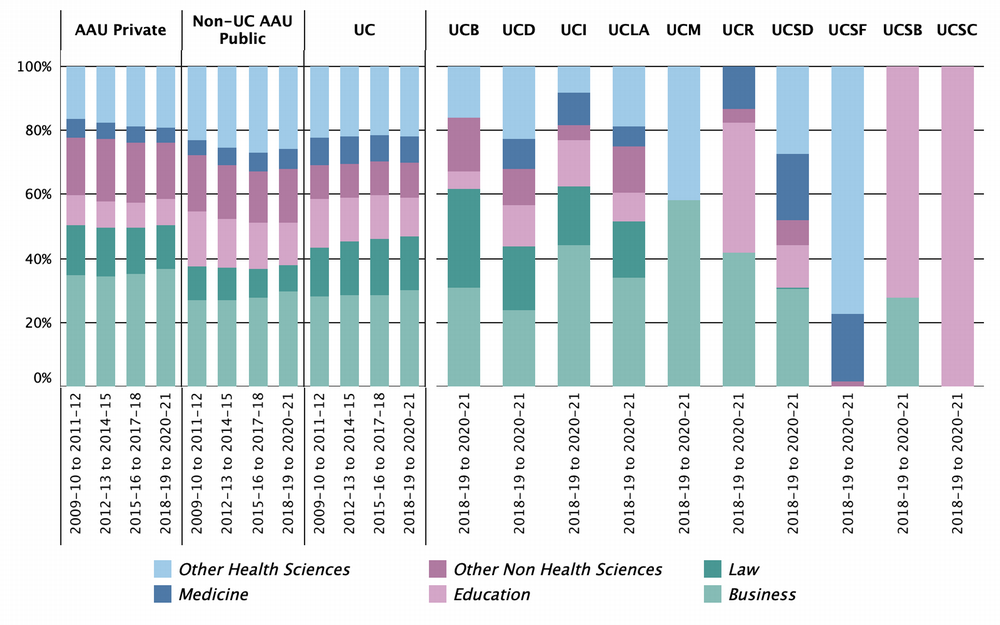
UC professional programs prepare graduates for careers closely related to their field of study.
4.4.2 Industry of employment of UC graduate professional students in California, by year after graduation, Universitywide, 2000 to 2019 graduating cohorts
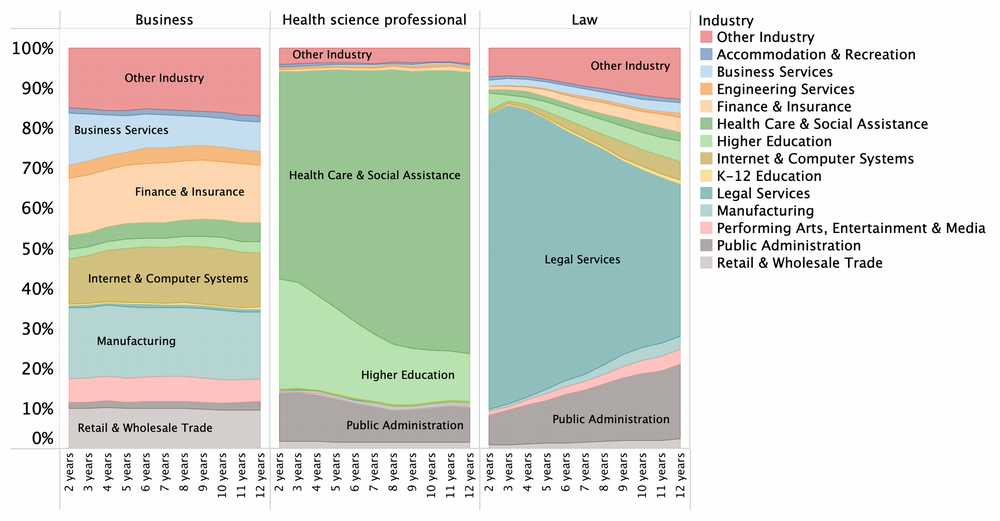
Source: California Employment Development Department and UC Corporate Student System
High proportions of UC’s law school and medical school graduates go on to work in the legal or health care fields, respectively. Graduates of UC Master of Business Administration (MBA) programs go on to work in a wide range of fields in California including finance, business services, and internet and computer services.