The California Master Plan for Higher Education designates the University of California as the primary State-supported academic agency for research. UC research contributes to the state and to the nation through discoveries that improve health, technology, welfare, and the quality of life. Research represents the creation of new knowledge, which can be communicated, curated, and cultivated to benefit society.
This chapter presents a largely quantitative description of UC’s research. These measures, however, do not capture the wide range of curiosity-driven research at UC. Quantitative measures emphasize fields that receive sizable funding and produce large numbers of publications, such as medicine, physical and material sciences, and engineering. These measures underrepresent research achievements in the arts, humanities, social sciences, and theoretical sciences, where work leaves less of a financial footprint, and where results are often disseminated in books or performances rather than in journal articles.
Quantitative measures cannot fully capture the multi-faceted ways by which UC research contributes indirectly and over time to the state, the nation, and the world. UC research advances knowledge in ways that directly improve health, technology, and the quality of life. It enables UC graduate and undergraduate students to participate in research and to receive instruction from the world’s foremost researchers, thus enhancing their learning experiences. It makes cutting-edge discoveries readily available to the healthcare, agricultural extension, and other vital public services that UC provides, greatly enhancing their value to the people of California. It creates thoughtful work in the arts and humanities that furthers understanding of our rich diversity and of our place in the world.
UC Natural Reserve System — science promoting environmental stewardship
The UC Natural Reserve System (NRS) manages a network of protected natural areas throughout California, representing most of California’s major habitat types, including coastal tide pools, inland deserts, lush wetlands, and redwood forests. Its 41 sites include more than 47,000 acres, making it the largest university-administered reserve system in the world. These lands provide undisturbed environments to conduct research, enhance student educational experiences, and provide sites for public service programs.
Federal funds support most of the research conducted at UC. Salaries and benefits represent more than half of all research expenditures.
9.1.1 Total research expenditures by source, Universitywide, 2009–10 to 2021–22
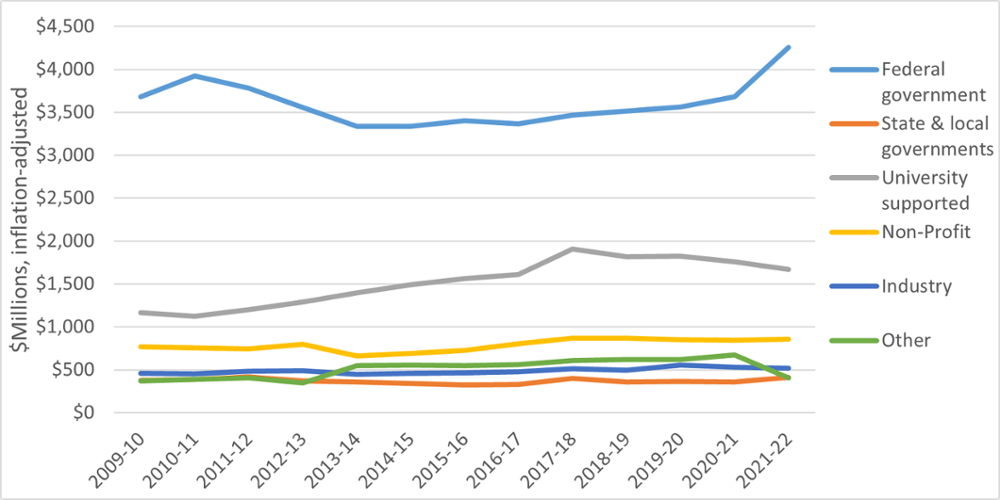
Source: National Science Foundation (NSF) Higher Education Research & Development survey. Expenditures have been adjusted for inflation and reflect the NSF’s methodology for calculating indirect costs.
9.1.2 Total research expenditures by cost type, Universitywide, 2021–22
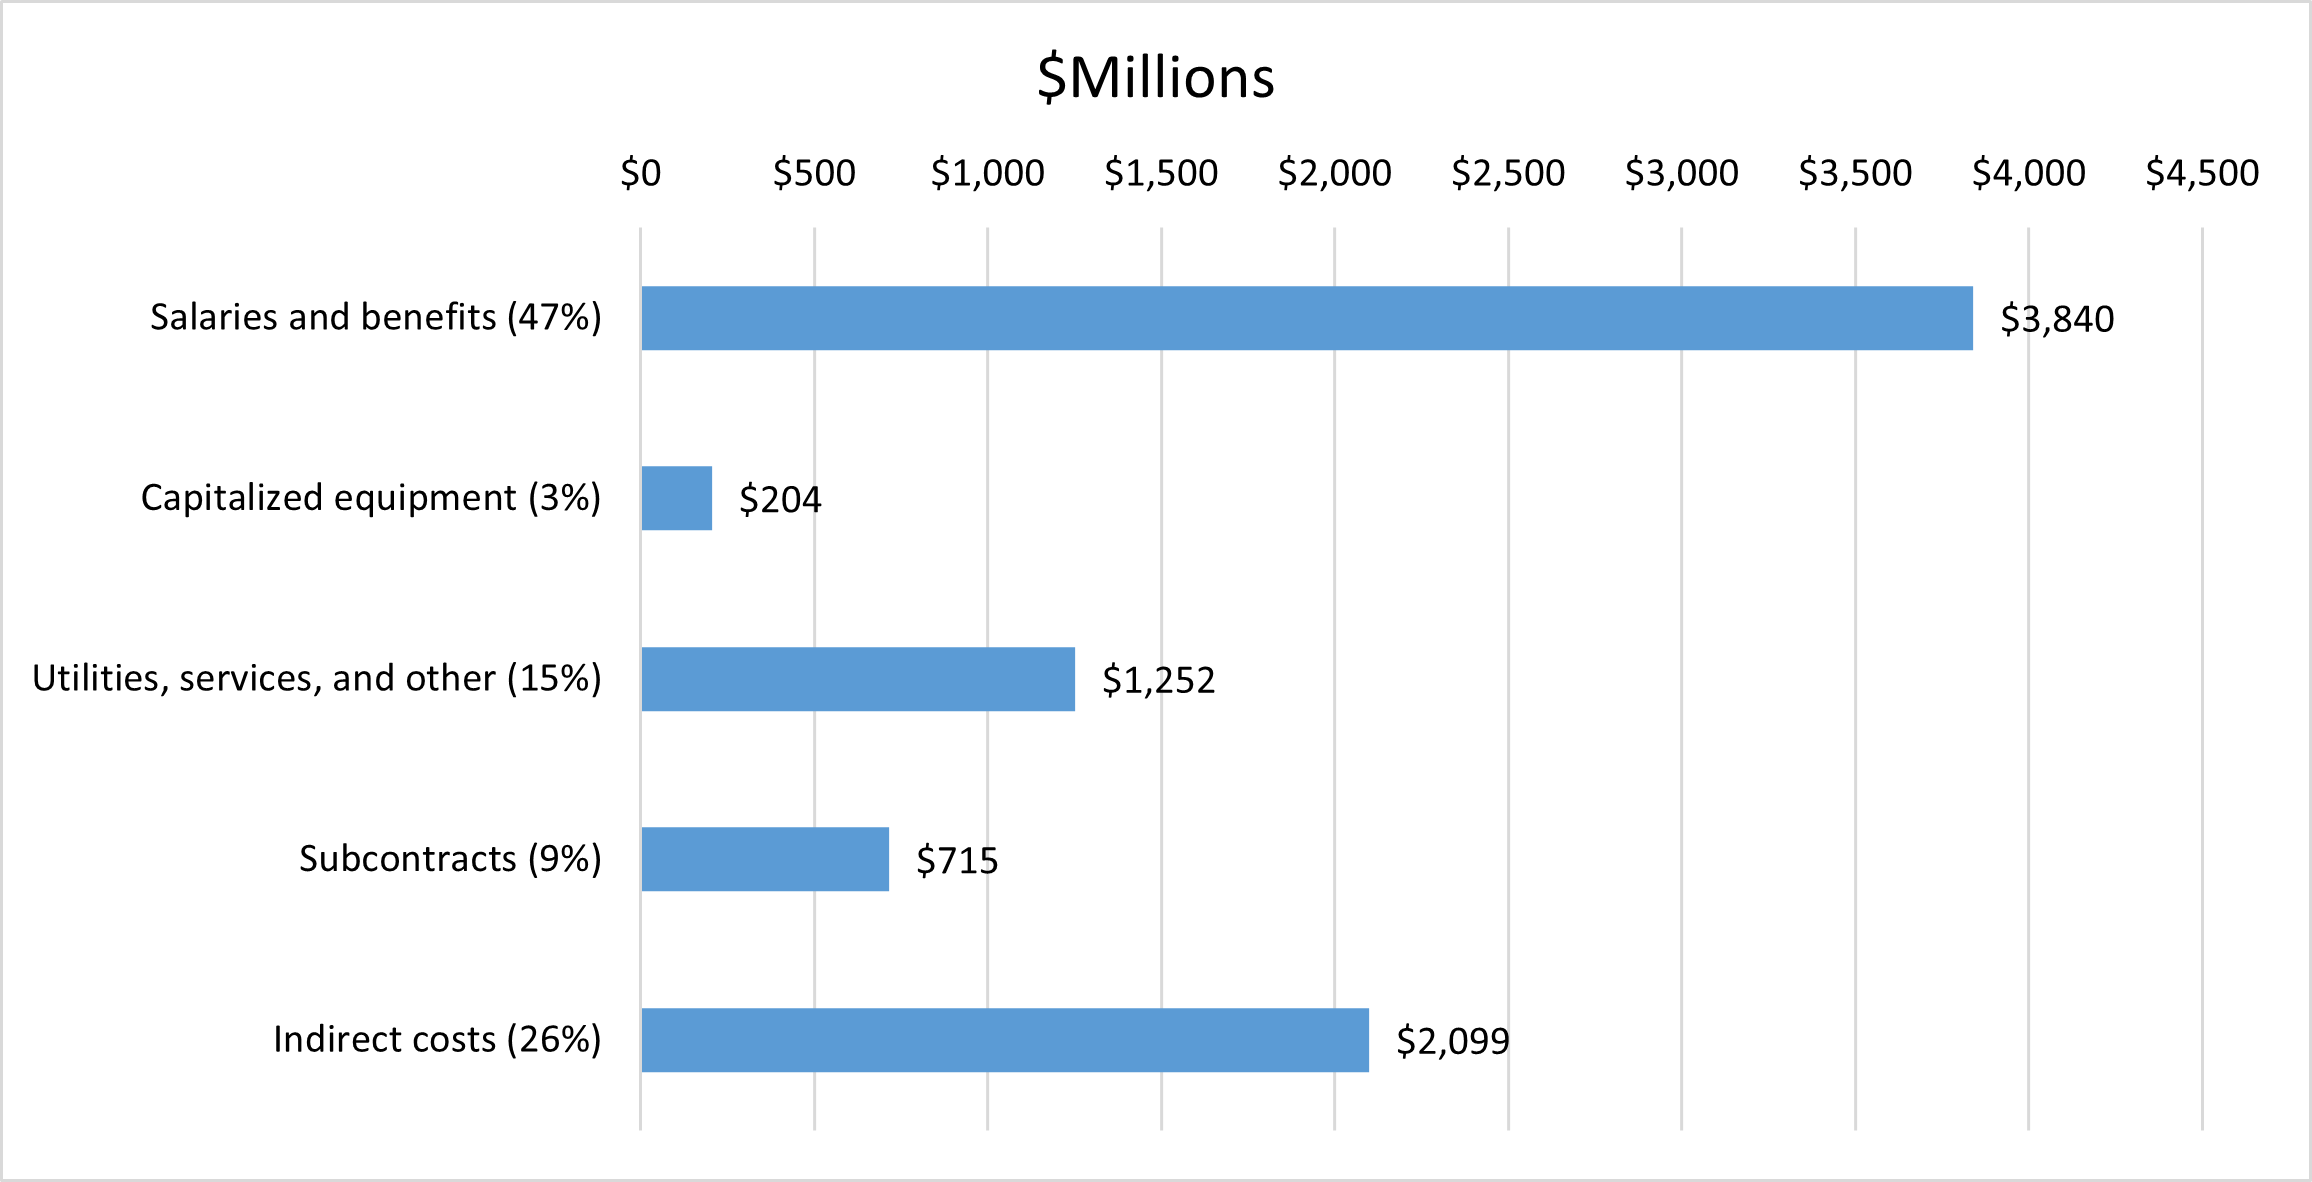
Source: National Science Foundation (NSF) Higher Education Research & Development survey.
Indirect costs are calculated using the NSF’s methodology.
Medicine and Life sciences represent the majority of all research expenditures.
9.1.3 Total research expenditures by discipline, Universitywide, 2009–10 to 2021–22
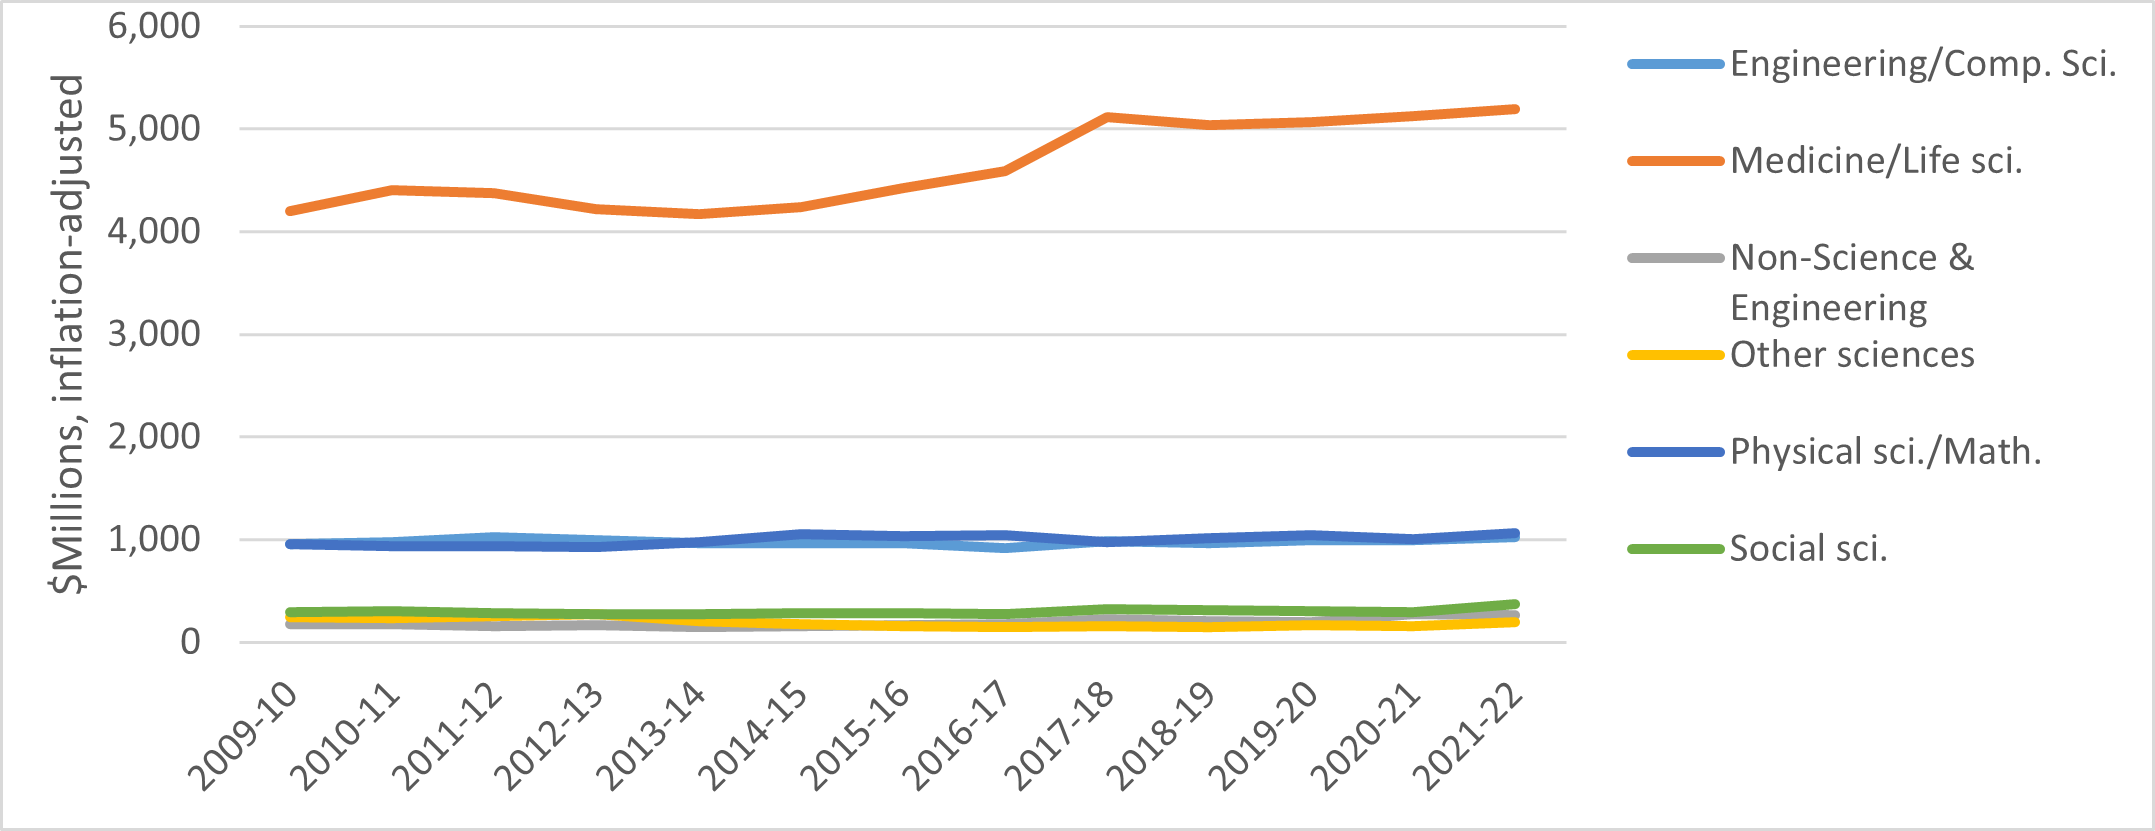
Source: National Science Foundation (NSF) Higher Education Research & Development survey. Expenditures have been adjusted for inflation and reflect the NSF’s methodology for calculating indirect costs.
UC accounts for almost nine percent of direct research expenditures at all US universities. Average research expenditures per ladder-rank faculty are higher at UC than its AAU public peers.
9.1.4 Direct research expenditures, US four-year universities, 2020–21
|
Direct research
expenditures
|
Percent of
US total
|
| UC universitywide |
$6.0 B |
8.9% |
| Other public universities |
$36.7 B |
54.5% |
| Private universities |
$24.6 B |
36.5% |
Source: IPEDS. Excludes for-profit institutions, which conduct a negligible share of research. This figure is slightly different from the NSF’s direct expenditure calculation due to differences in how IPEDS treats non-functional expenses.
9.1.5 Average direct research expenditures per ladder-rank faculty, UC and AAU comparison universities, 2012–13 to 2020–21
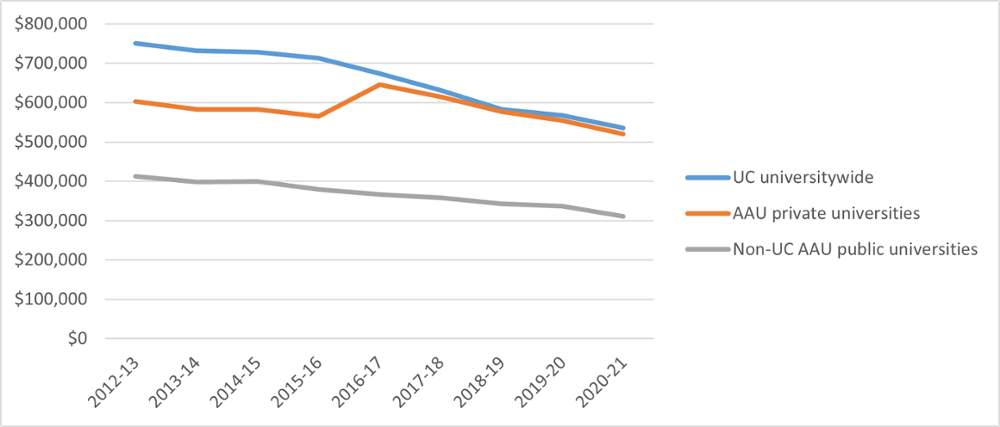
Source: IPEDS. Expenditures have been adjusted for inflation.
| UC Location |
Research expenditures
per ladder-rank faculty |
| San Francisco |
$4,196 K |
| San Diego |
$636K |
| Los Angeles |
$595K |
| UC AVERAGE |
$542K |
| Berkeley |
$480K |
| Davis |
$436K |
| Irvine |
$289K |
| Santa Cruz |
$249K |
| Santa Barbara |
$233K |
| Riverside |
$197K |
| Merced |
$193K |
*UC San Francisco is an exclusively health sciences campus, where many non-ladder rank (clinical) faculty conduct significant research.
9.1 RESEARCH EXPENDITURES
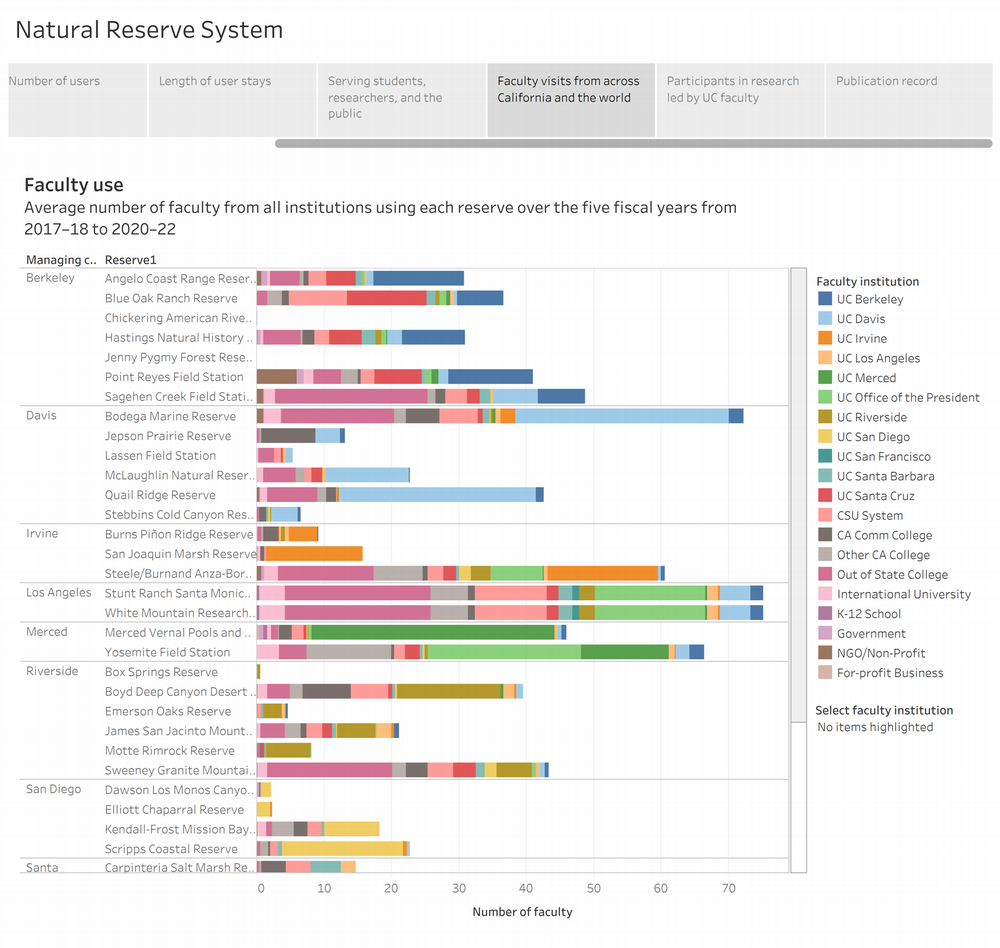
UC Natural Reserve System has hosted 4,340 researchers and 1,265 faculty to conduct research in 47,000 acres of protected California habitat since 2016.
9.1.6 UC Natural Reserve System use data

UC’s Natural Reserve System use data dashboard provides additional detail by campus
9.1.7 UC Natural Reserve System locations and campus affiliation
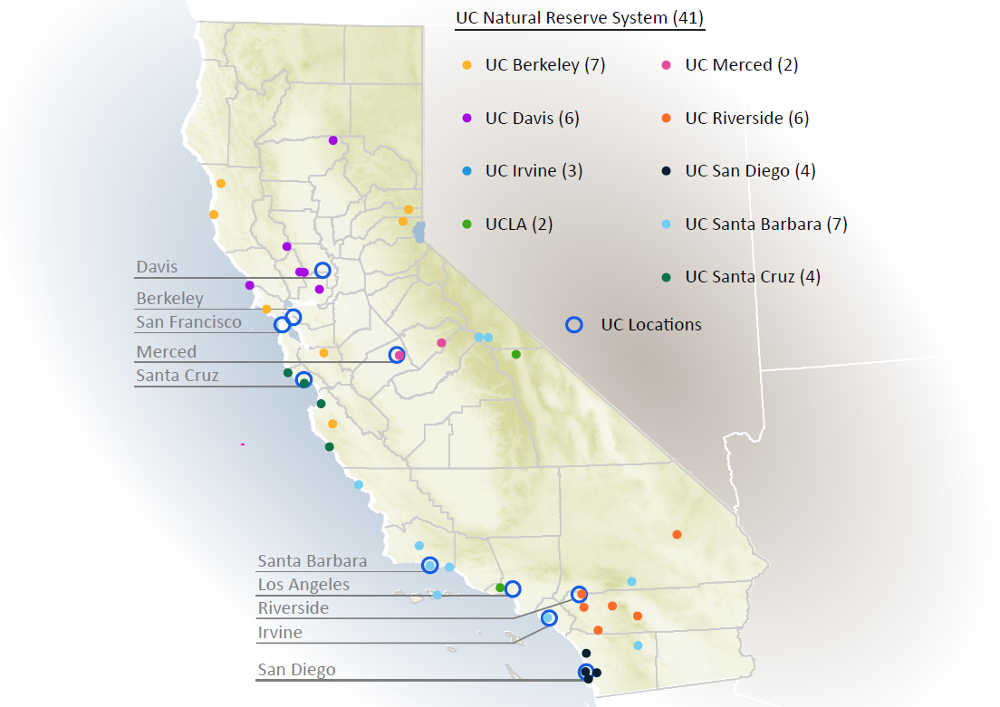
Source: UC Natural Reserve System
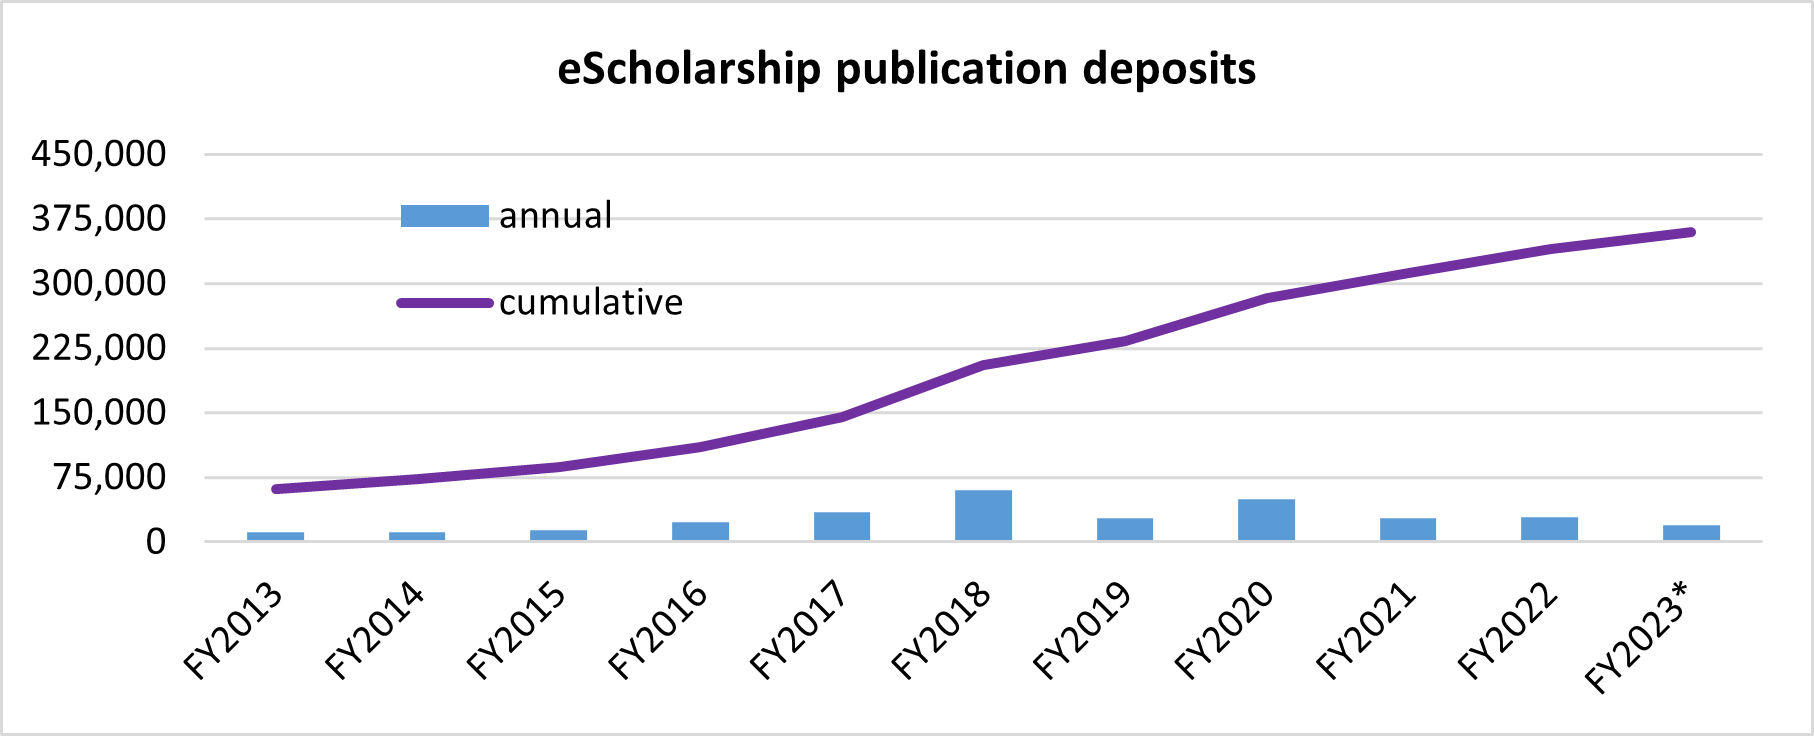
UC’s Open Access policies continue to add to a growing body of freely available research publications in eScholarship. UC’s open-access repository and publishing platform is expanding the global reach of UC’s research findings.
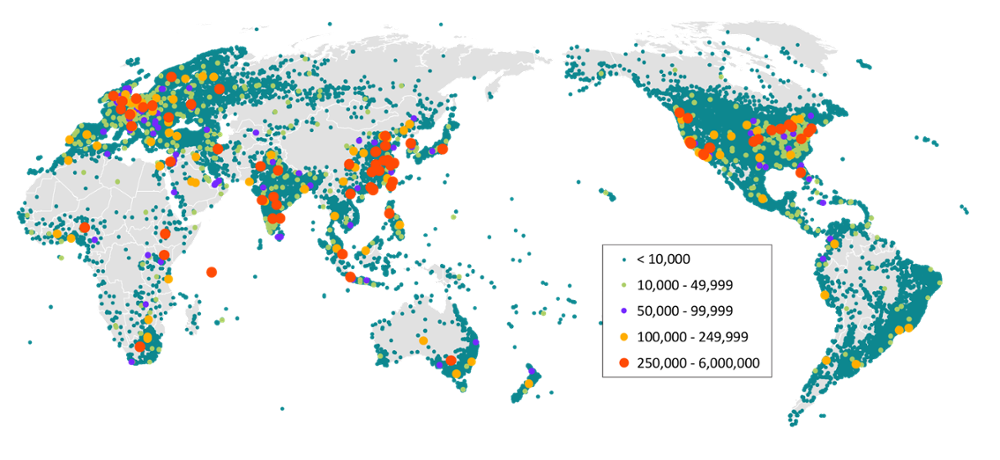
9.2.1 eScholarship views and downloads of UC scholarly materials, Universitywide, Through February 2023
Source: California Digital Library
This map shows the geographic distribution and concentration of views for scholarly materials in eScholarship, UC’s open access (OA) publishing platform and institutional repository managed by the California Digital Library. eScholarship contains over 350,000 individual items, including research articles, working papers, and electronic theses and dissertations, as well as approximately 90 open access journals that are published on the platform. Since 2002, UC-sponsored research and journals in eScholarship have been viewed and/or downloaded over 126 million times by readers around the world.
Source: California Digital Library
*partial year data
UC’s technology commercialization program takes inventions from the laboratory to the marketplace, benefiting the public by building alliances with industry to create innovative products for the world and to generate new businesses and jobs for California.
9.2.2 LIcenses, research/invention disclosures, and patent protection
UC inventions at a glance dashboard
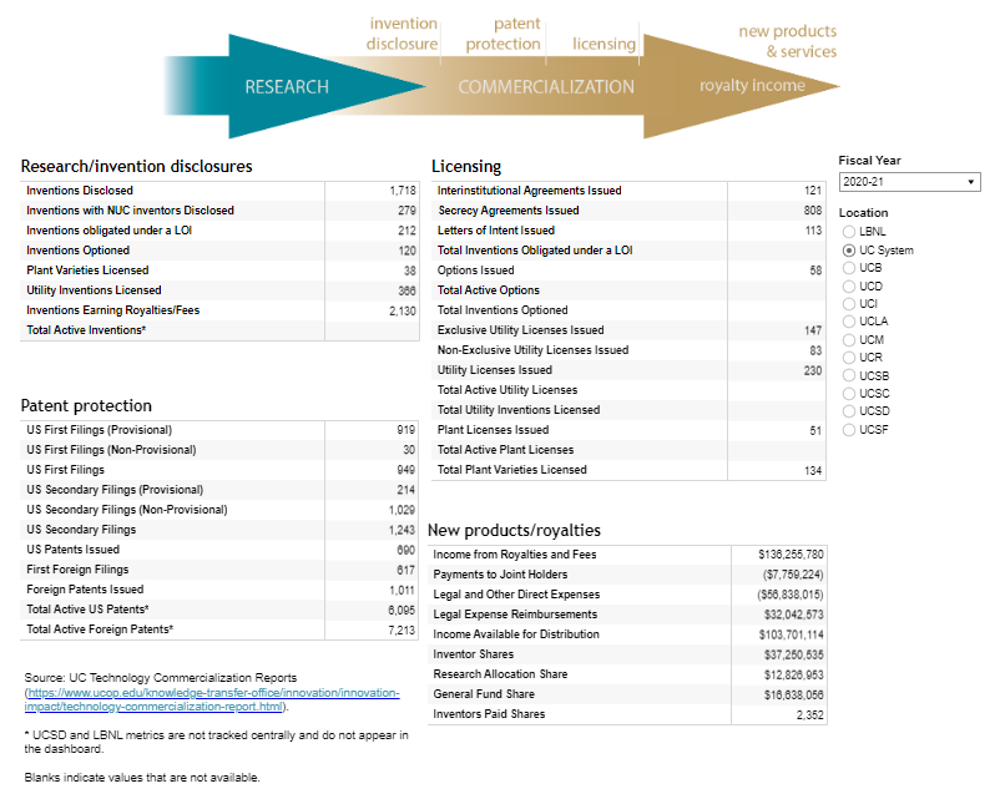
UC research often leads directly to new patentable inventions and other innovations; bringing them to the marketplace is part of the UC public service mission. UC inventions take two paths to the marketplace: they may be licensed to an existing company or they may become the cornerstone of a new startup company.
Invention commercialization promotes technological advances, generates economic benefits, and helps support UC’s research enterprise. UC’s patents are commercialized under utility licenses and plant licenses.
Utility licenses cover inventions protected by utility patents, such as processes, machines, manufactured items, or compositions of matter, and are often issued exclusively to a single licensee. Plant licenses cover plant cultivars and are often licensed non-exclusively to nurseries and distribution centers.