Overview
The three-pronged mission of the University of California includes teaching, research, and public service, none of which can be accomplished without the support of staff who organize and facilitate all that is required to do the work of the University.
University staff members make valuable contributions in supporting the university's overall mission of education, research, public service and patient care.
UC has the following personnel programs:
- Senior Management Group (SMG) or Executives are the senior executive leadership of the University. These include employees such as the President, Chancellors, Vice Presidents, Vice Chancellors and Campus Counsels (lawyers).
- Managers are a subgroup within Management and Senior Professionals (MSP) personnel program. They perform managerial and supervisorial duties within academic and administrative departments.
- Senior Professionals (sometimes called Technical/Professional staff) are part of the MSP personnel program. Jobs in this category require a high level of professional experience and carry a significant level of responsibility. Examples include senior administrative analysts and information technology professionals, fundraisers, coaches, and student health physicians.
- Professional and Support Staff (PSS) staff or “Support Staff” perform functions including maintenance, food services, laboratory sciences, student advising and counseling, recreational programs, clerical support, and analysis in areas such as human resources, financial, budget, and accounting. Typical positions include clerical employees, programmer analysts, IT desktop support, administrative analysts, janitors, food service workers, lab technicians, police officers, etc.
The University values a healthy, equitable, and inclusive UC workplace, and has a strategic roadmap to ensure that UC is an employer of choice. For policy-covered staff, the 2024-25 budget plan includes a salary increase budget of $74.5 million, reflecting a salary program of 4.2 percent over current levels. The University believes that this is an essential investment for cultivating and retaining its existing workforce, addressing the impact of rising inflation on the purchasing power of UC salaries, and maintaining equity over time relative to salary increases for the University’s represented employees. For represented employees, UC will implement the contractual increases provided for in previously negotiated contracts, with successor negotiations for several units starting in 2024. Labor contracts may include several types of compensation tools, including across- the-board increases, step increases, and merit increases. Recently negotiated agreements continue to place considerable cost pressures on campus core funds budgets. As a result, the University projects wage growth for core funded represented employees of approximately $90.3 million next year, reflecting average salary increases of approximately 8.4 percent over estimated 2023-24 levels.
Beginning in 2012-13, and every two years thereafter, the Council of University of California Staff Assemblies (CUCSA) and the Office of the President have sponsored a sampling survey of non-represented staff members across the UC System. The survey process is managed by an impartial external vendor. Each leadership team in the system is encouraged to review the data for their location with members of their local Staff Assembly, communicate results with their community, and lay out a plan to affect positive change. Survey results are available on the Biannual CUCSA staff engagement survey webpage.
As of October 2023, staff FTE was 80,781 on the campuses and 45,741 at the medical centers.
6.1.1 Staff Full-time Equivalent (FTE)

UC employees, full-time equivalent (FTE) dashboard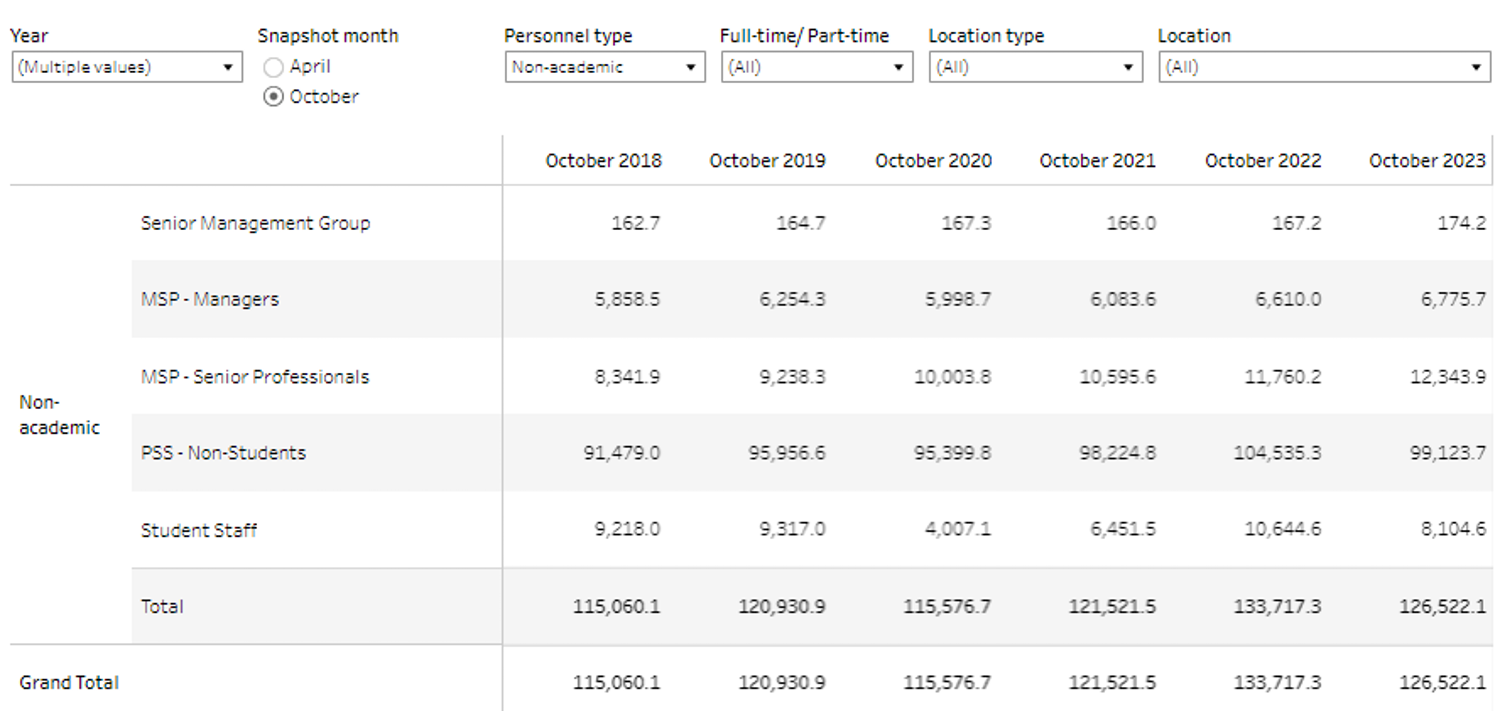
Source: UC Information Center
General campus, non-student staff has seen the greatest growth amongst senior professionals, due to both the introduction of Career Tracks and the professionalization of UC’s workforce towards high-skilled analysis and technical capabilities. Career Tracks is a function-specific, market-aligned job classification system that applies consistent interpretations of which positions are Management and Senior Professional (MSP) and which are Professional and Support Staff (PSS). Within PSS, there has been a significant shift away from clerical roles into student services positions and administrative analysis to manage growing campuses and student bodies.
UC operates six health systems with five academic medical centers as well as schools of medicine, dentistry, nursing, and other health sciences education and research programs. The growth of University of California Health FTE is also driven by service expansions, such as increases in inpatient days as well as outpatient/emergency visits.
6.1 STAFF WORKFORCE
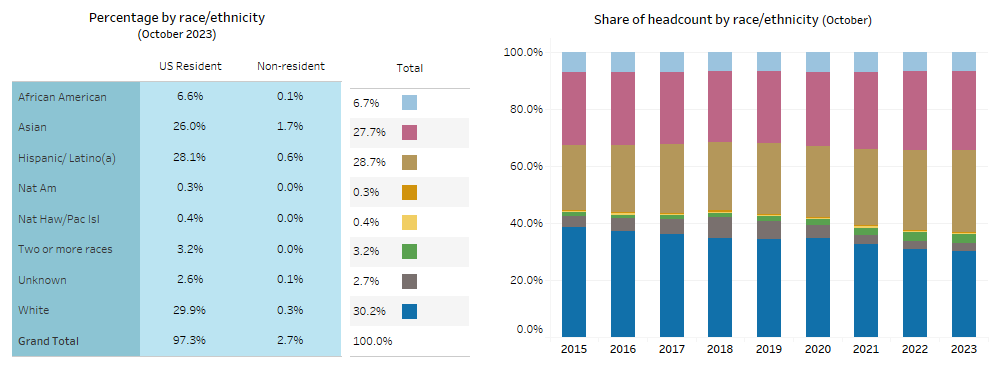
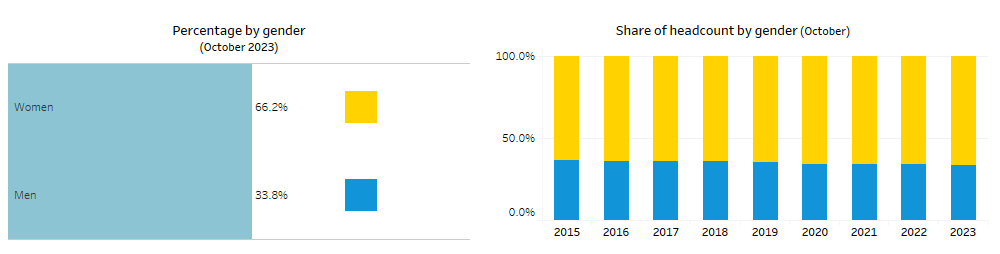
The proportion of underrepresented staff represented 35% of the workforce in October 2023, up from 29% a decade ago. During the same time, the proportion of women increased from 63% to 66%, with a notable increase (38% to 45%) in the senior management roles.
6.1.2a Racial/ethnic diversity of staff by personnel program
UC workforce diversity dashboard
6.1.2b Gender diversity of staff by personnel program
UC workforce diversity dashboard
In 2015-16 through 2019-20, merit-based salary increases averaging 3% for policy-covered staff were implemented. For these employees, were no salary increases in 2020-21, increases of 3% in 2021-22 and 4.5% in 2022-23.
6.2.1 Increases in funding for staff salaries compared to market

University of California Budget for Current Operations 2024-25 report
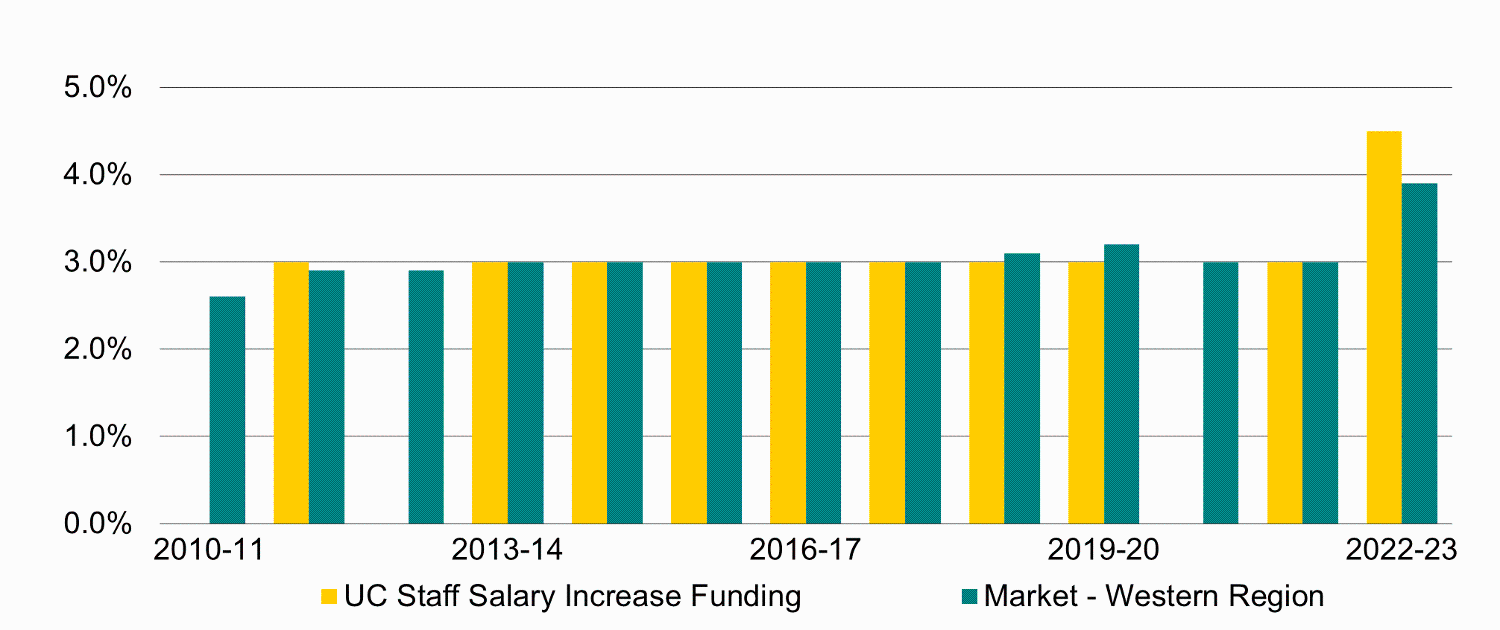
Source: UC Budget for Current Operations 2024-25; sourced from World at Work Annual Salary Budget Survey, which represents data from over 1,000 employers from all sectors in the western United States.
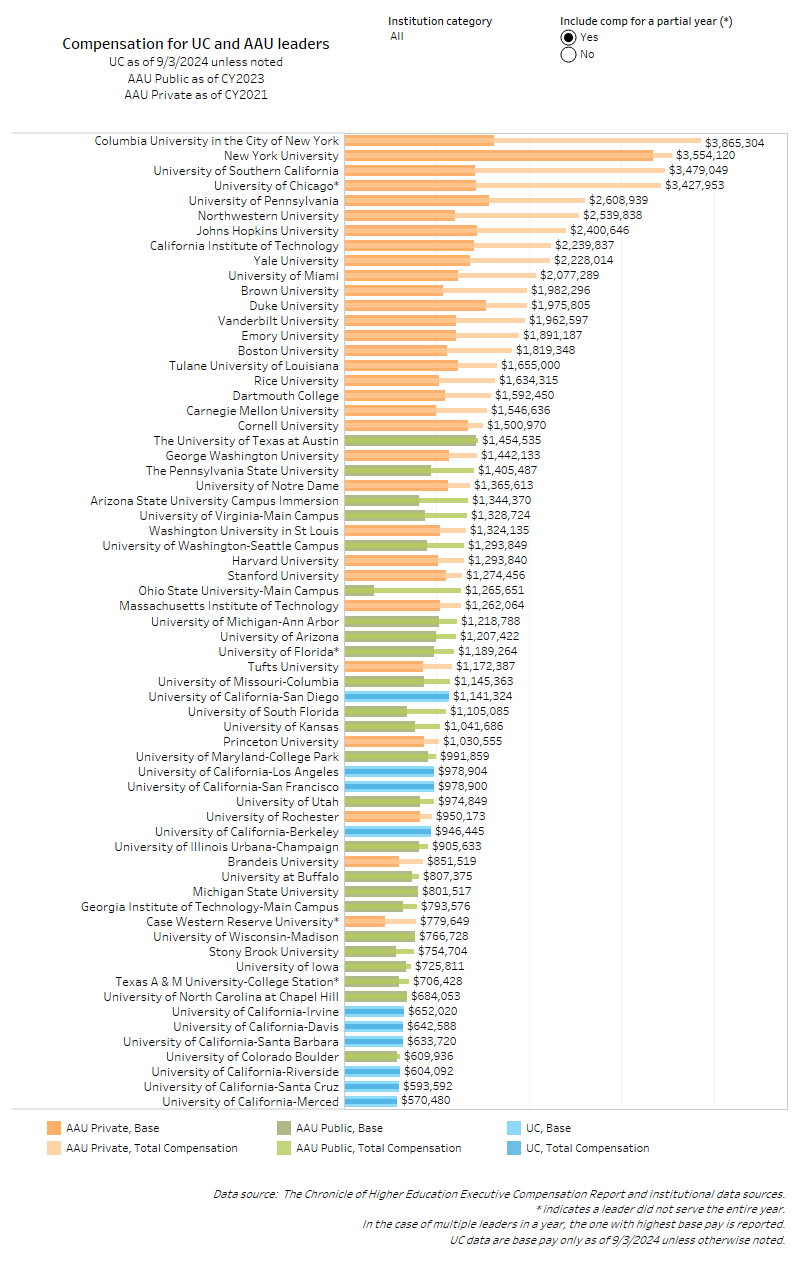
UC chancellors are among the lowest-paid when compared to their Association of American Universities (AAU) peers, based on the most recent comparative data.
6.2.2 Base salaries and additional pay for UC and AAU institution leaders
Comparative salaries of chancellors and system leaders dashboard
The separation rate among career staff was 9.3 percent in FY 2023, down from eleven percent in the previous fiscal year.
6.3.1a Separation rate for career staff
Staff workforce profile dashboard
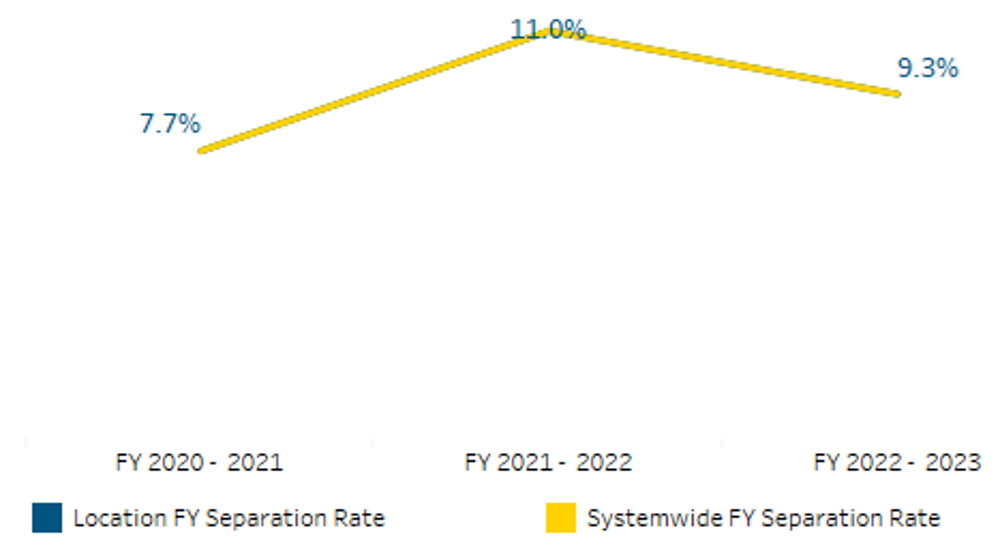
Source: UCPath and CPS
6.3.1b Separation reasons for career staff, FY 2023
Staff workforce profile dashboard
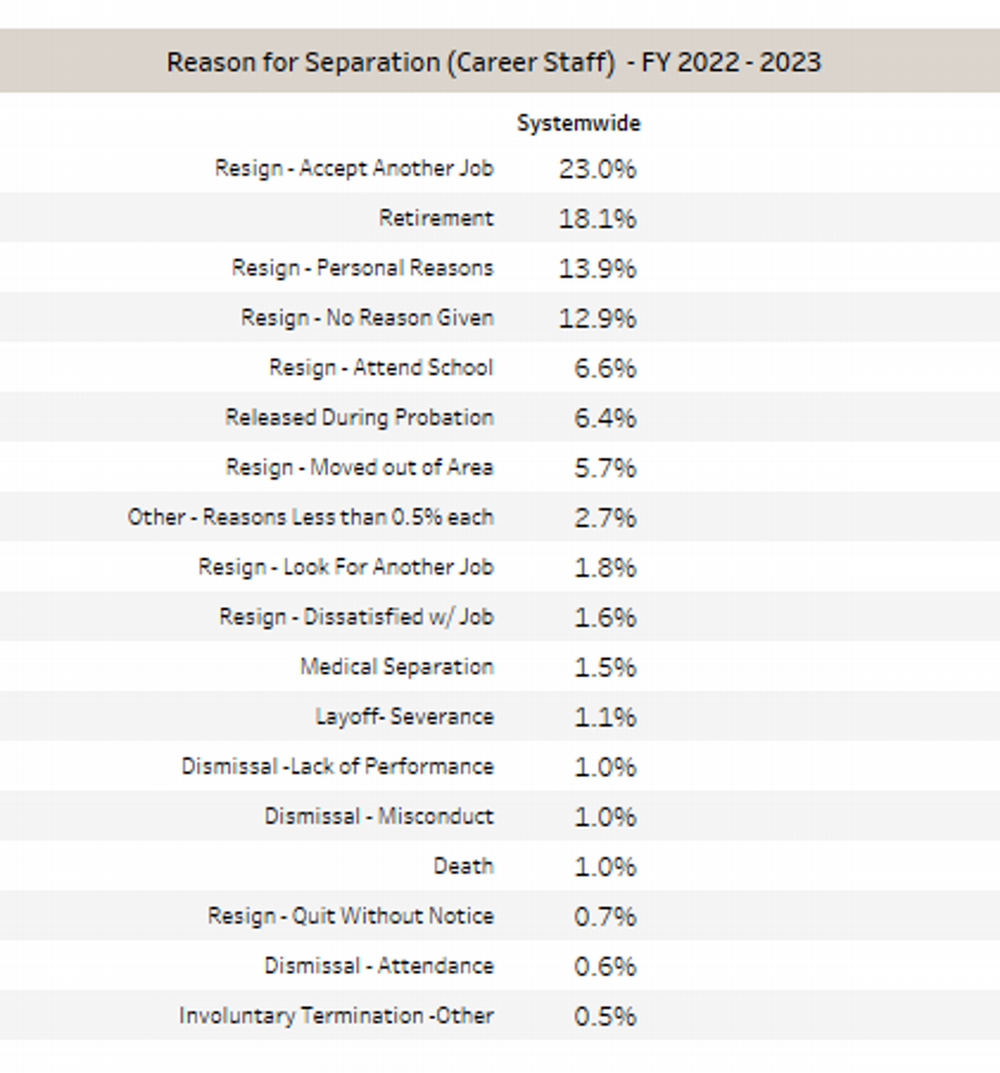
Source: UCPath
Campuses experience a wide range of separation rates among their career staff, which may reflect different mixes of employees, work environments, and local job markets. High turnover is often expensive in terms of lost productivity, lost institutional knowledge, and replacement costs.