EXECUTIVE SUMMARY
The University of California is crucial to our state. It enhances the lives of Californians and drives economic growth through education, research, health care, and agricultural expertise. The University is committed to doing even more and has adopted the UC 2030 goals and a slate of presidential priorities to help more UC students and Californians thrive. The UC Accountability Report is one way the University tracks its progress toward those ambitious goals, while also providing transparency about key UC operations and trends.
This year’s Executive Summary reviews progress on the UC 2030 goals, which focus on increasing student success and degree attainment. The summary also highlights other ways that UC research, health care and employment help California flourish.
The appendix to this report provides a screenshot of the UC 2030 dashboard, which provides detailed metrics for the UC system and its individual campuses related to the UC 2030 goals. It also provides a full list of the indicators that track critical measures across UC operations.
Commitment to educational opportunity
With its UC 2030 goals, the University of California aspires to increase its ranks of graduates by 1.2 million by the end of the decade. This goal amounts to 200,000 more undergraduate and graduate degrees above the one million previously projected for 2030. UC also seeks to ensure that nine of ten UC undergraduates who enter the university leave with a degree, and that all undergraduates are able to earn their diplomas in a timely way, with more than three-quarters of freshmen completing their studies in four years and seven of ten transfer completing their studies in two years. Furthermore, UC strives to increase opportunities for UC undergraduates to go on to graduate school, with a particular focus on increasing the number of doctoral degrees awarded and the diversity of doctoral graduates.
Key to achieving all of these goals is the elimination of disparities in degree attainment for low-income and first-generation students and for students from groups long underrepresented in higher education — specifically Black, Latino(a), and Native American students.
Producing 200,000 more undergraduate and graduate degress by 2030
The University developed the UC 2030 Capacity Plan and UC 2030 goals to help California meet the projected needs for more college graduates, and to ensure that future UC graduates better reflect the full diversity of California.
With the UC 2030 Capacity Plan, the University proposes to add over 23,000 state-supported students (roughly 17,000 California resident undergraduates and 6,000 graduate students) by the end of this decade. That growth is comparable to the addition of another UC campus, without the physical building and investment needed to construct a new campus. The university’s approach instead leverages traditional and non-traditional means to expand capacity across the existing ten UC campuses.
Current projections show that the University is on track to add over 23,000 state-supported students by 2030, particularly California resident undergraduate students.
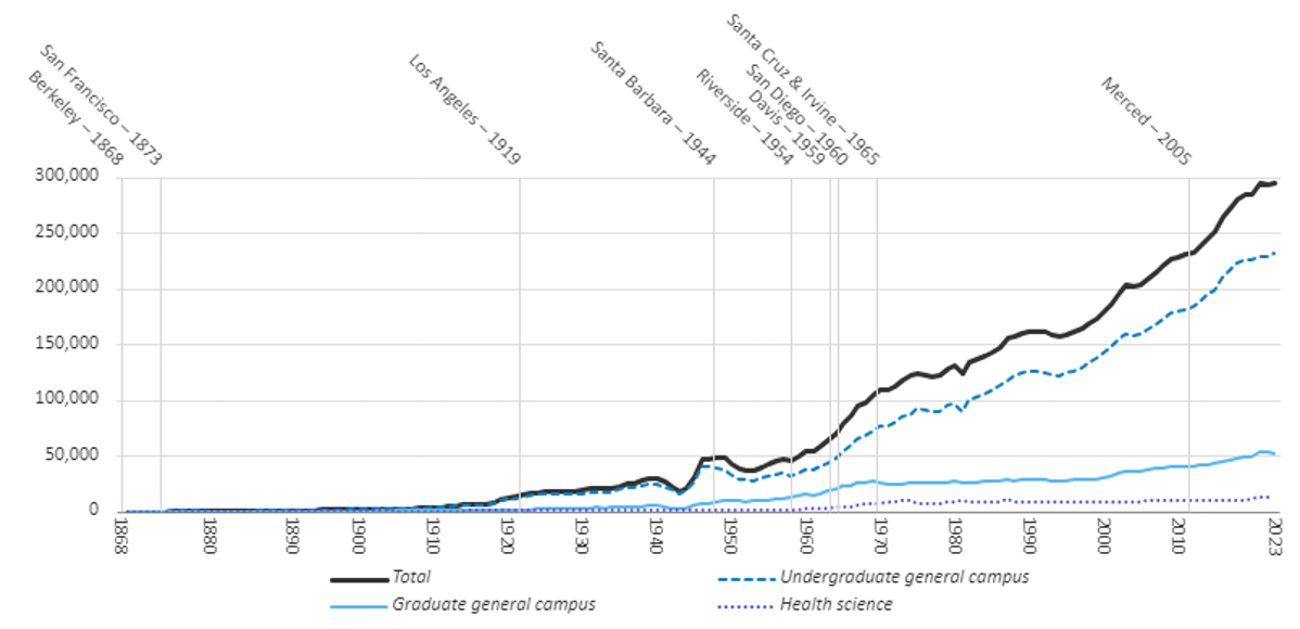
Undergraduate and graduate enrollment, with campus opening date
More details on historical enrollment are found at the UC historical enrollment, 1869 to present dashboard
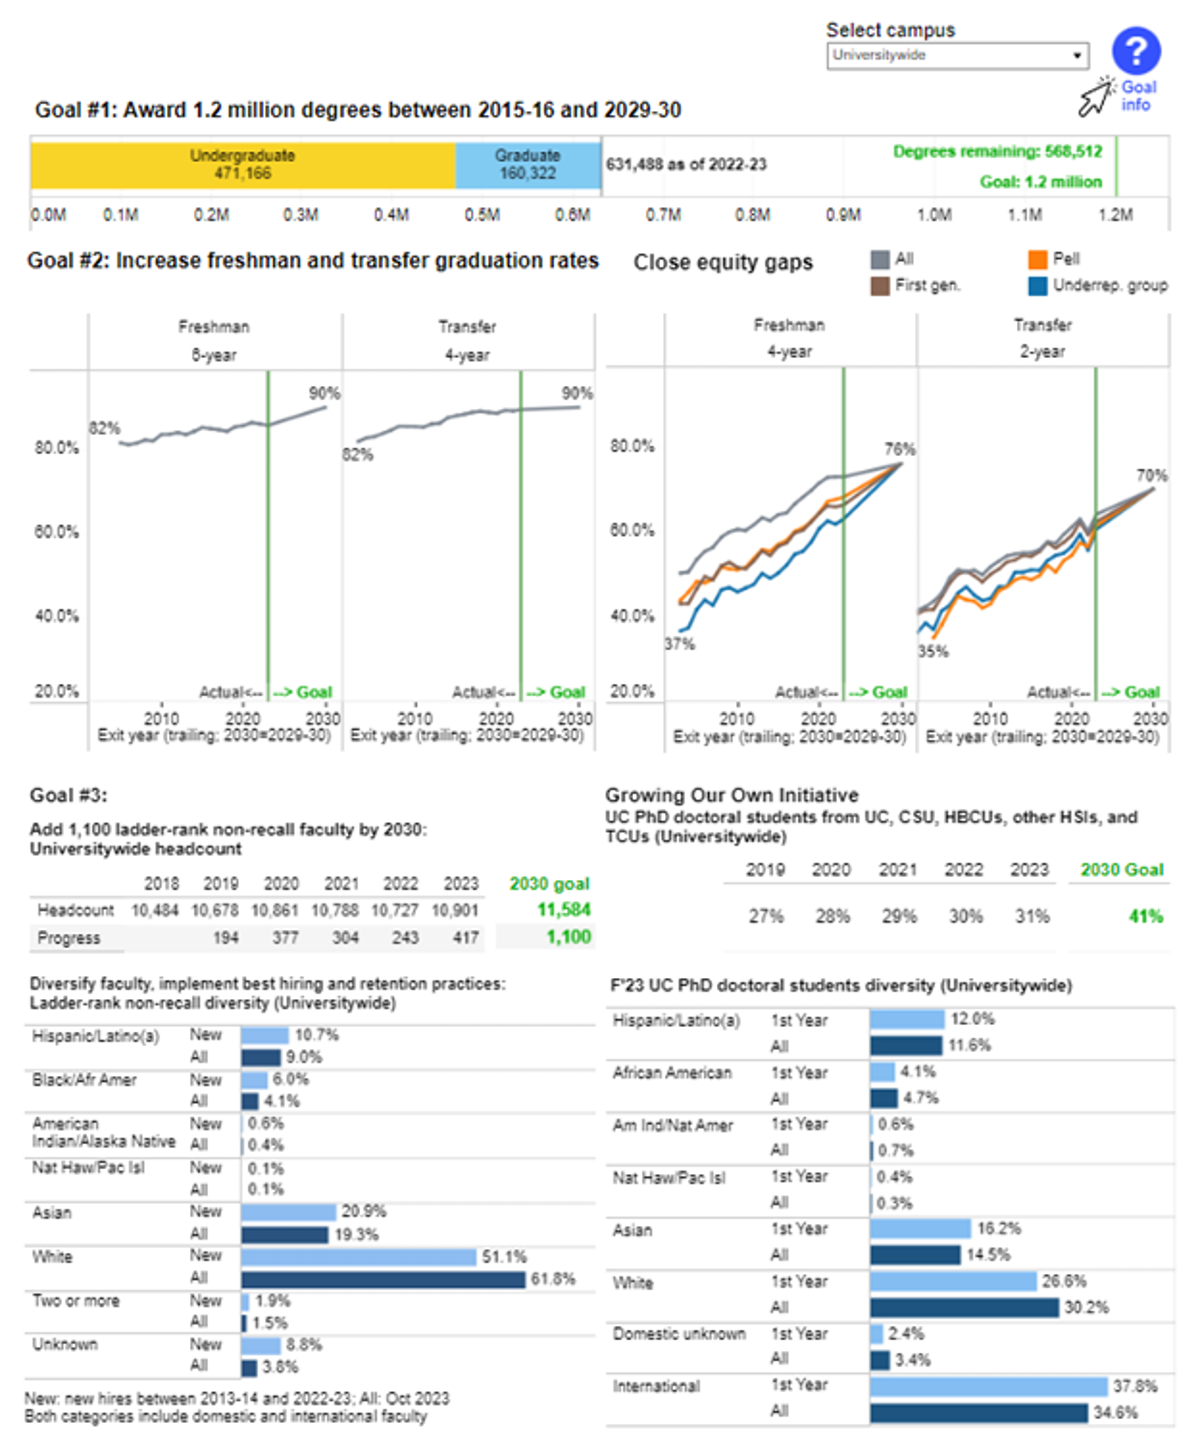
However, increased enrollment is not enough. UC is committed to ensuring that every student who starts at the University leaves with a degree. In support of that goal, the University of California set a goal to add 200,000 degrees over the one million currently projected – or 1.2 million undergraduate and graduate degrees by 2030.
UC continues to make progress to ensure nine of ten undergraduate leave with a degree. The freshman six-year graduation rate is 86 percent (3.1.1); that measure rises to 88 percent when students who finished their degree at non-UC institutions are included (3.1.2). The transfer four-year graduation rate is effectively at 90 percent (3.1.3); it is 89.5 percent at year four and 90.4 percent at year five and beyond. By these measures, UC already ensures that nine of ten transfer entrants leave with a degree.
Since 2015-16, UC has added almost 631,500 undergraduate and graduate degrees – or almost 53 percent of the 1.2 million total set as a goal in the Capacity Plan. Based on current projected growth in undergraduate and graduate enrollment, together with trends in undergraduate graduation rates, UC is on track to meet the goal of 1.2 million undergraduate and graduate degrees awarded by 2030.
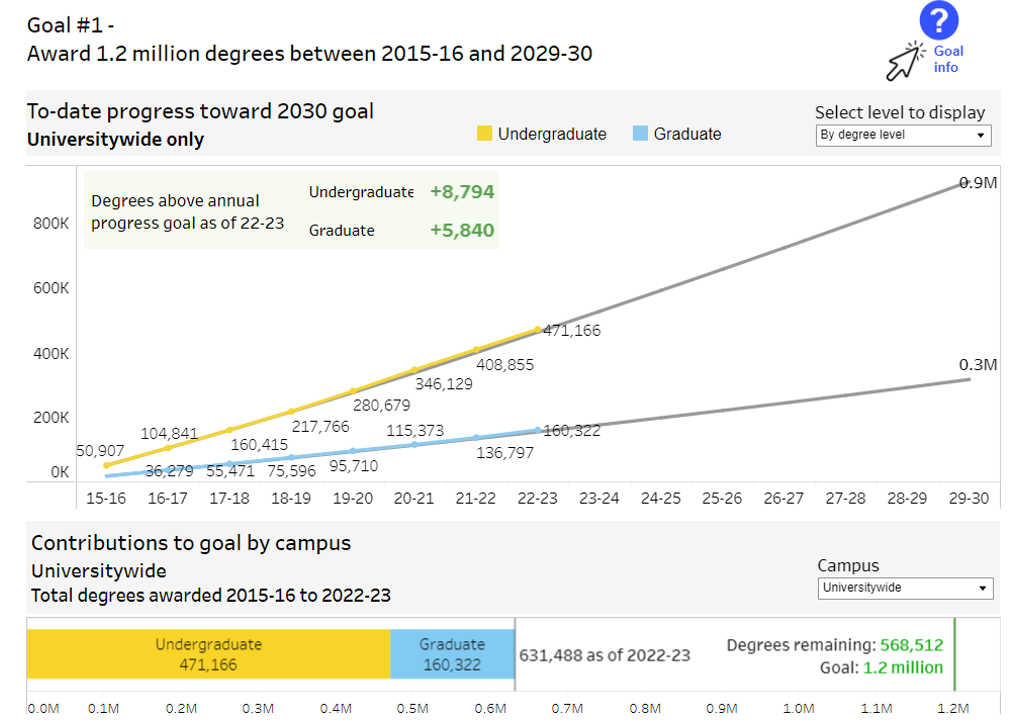
Undergraduate and graduate degrees awarded, progress to UC 2030 goals
Advancing equity throughout educational pathways
California is one of the few states in the nation where minority groups make up most of the population. At California high schools, the majority of students come from low-income backgrounds, are the first in their families to pursue a college degree or are members of racial groups historically marginalized in higher education, including Black, Latino(a), and Native American students. Currently, the University does not reflect that diversity and at each step along the path to an undergraduate degree the University becomes less reflective of the state’s high school-aged population. UC’s undergraduate population is more diverse than its graduate student body or the faculty.
UC 2030 goals are aligned to improve opportunities and outcomes for undergraduate and graduate students throughout the educational pathway and to diversify the professoriate and other in-demand parts of the California workforce that require graduate degrees, such as the health care professions.
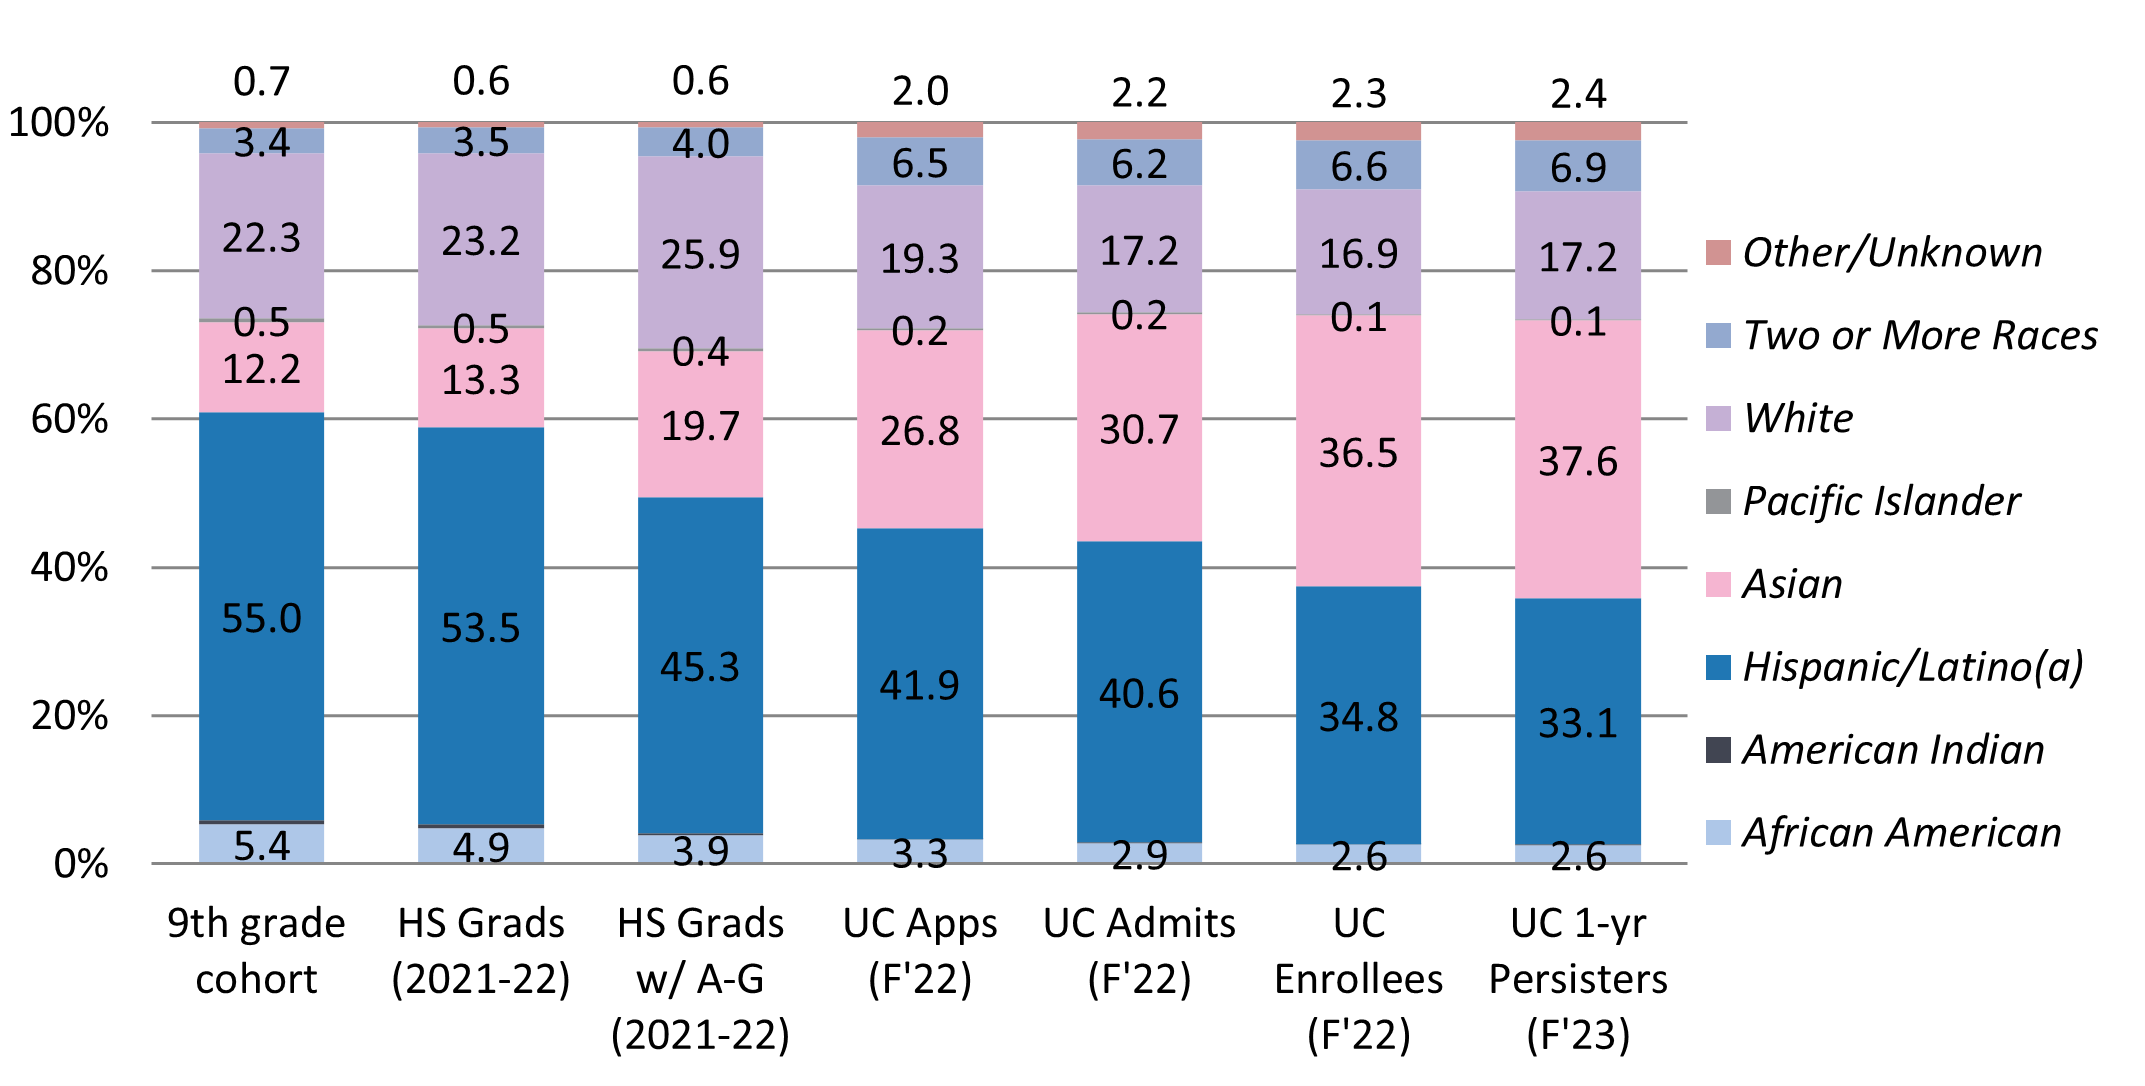
Fall 2021 racial/ethnic distribution of UC undergraduate pipeline (7.1.1)
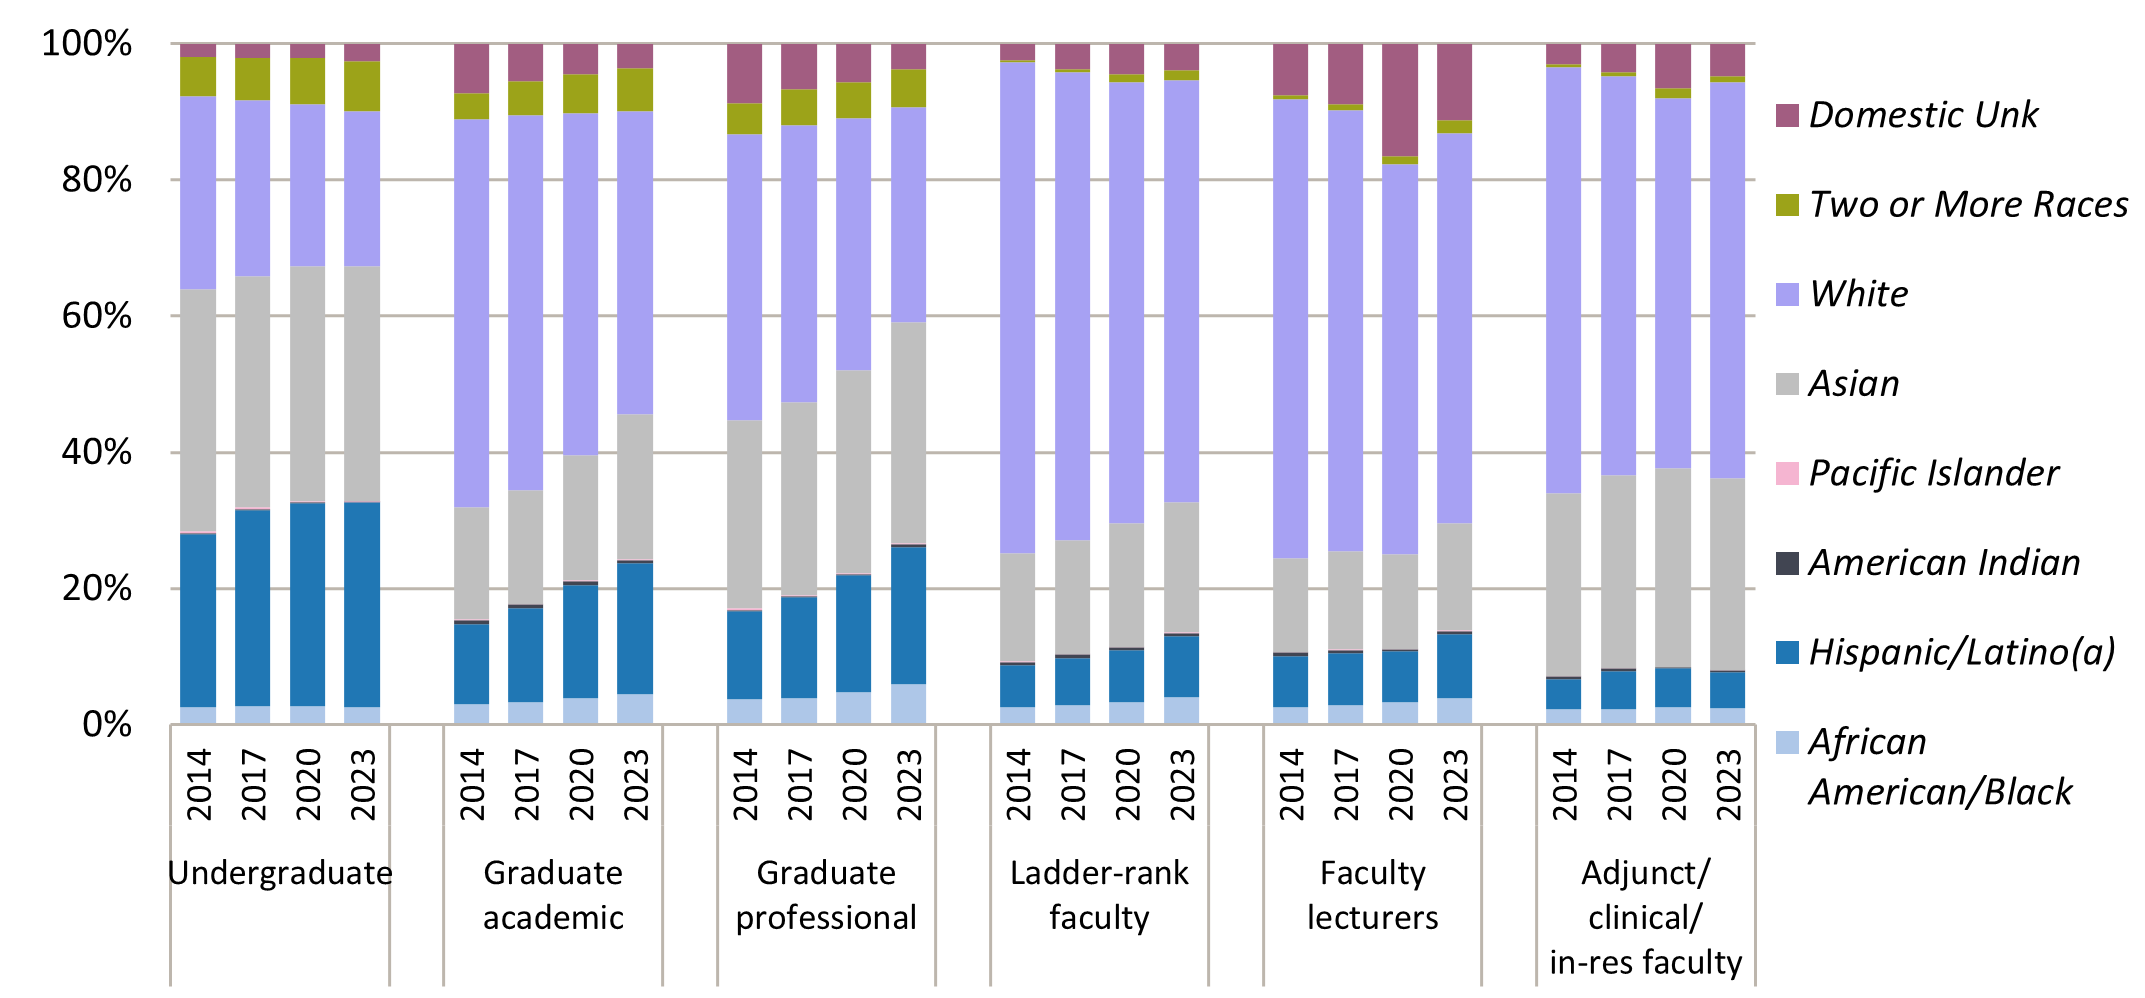
Fall 2014 to 2023 racial/ethnic distribution of students and faculty (7.3.1)
Embedded in these goals is recognition that educational equity is critical to our pursuit of excellence. We cannot pursue one without the other. At the University of California equity is excellence.
Improving timely graduation and increasing educational equity
The UC 2030 goals set specific targets for increasing timely graduation. This includes increasing the overall systemwide four-year graduation rate to 76 percent and the two-year transfer graduation rate to 70 percent. With its UC 2030 equity goals, the university aspires to do this by eliminating disparities and achieving parity between the overall timely graduation rates and rates for first-generation students, low-income students (Pell-eligible), and students from underrepresented minority groups (Black, Latino(a), and Native American).
The University has remained focused on these goals even through the onset and aftermath of a global pandemic that upended education at all levels of the state. In 2022, in a reaffirmation of its commitment to these goals, UC entered a multi-year funding Compact with the Governor that set intermediate goals to reach 50 percent of these goals by the end of the 2025-26 academic year. Progress on these goals is tracked publicly on the UC Information Center 2030 Dashboard.
By the close of the 2022-23 academic year, the four-year freshman graduation rate remained unchanged at 72.9 percent. However, with 1.5 percentage points to go, the 2026 intermediate Compact goal of 74.4 percent is within reach and four of nine UC campuses saw increases above the 2021 baseline set in the Compact. Rates increased by .5 percentage points for first-generation students, by .6 percentage points for Pell grant recipients, and by more than one percentage point (1.3) for students from underrepresented groups, specifically Black, Latino(a), and Native American students. These gains come on the heels of a drop in graduation rates for first-generation and underrepresented groups in 2022. Thus, the rebound is an important sign of recovery for the system post-pandemic.
While the 2023 gains have not brought rates into alignment with the projected increases that would be needed to reach parity in 2030, continued progress at this rate or a slightly elevated one would allow UC to reach its goal. To quantify this work, the dashboard includes an estimate of the number of additional students needed to graduate to achieve four-year graduation rate goals, specifically 700 freshmen to achieve Compact goals and 1,450 freshmen to achieve UC 2030 goals.
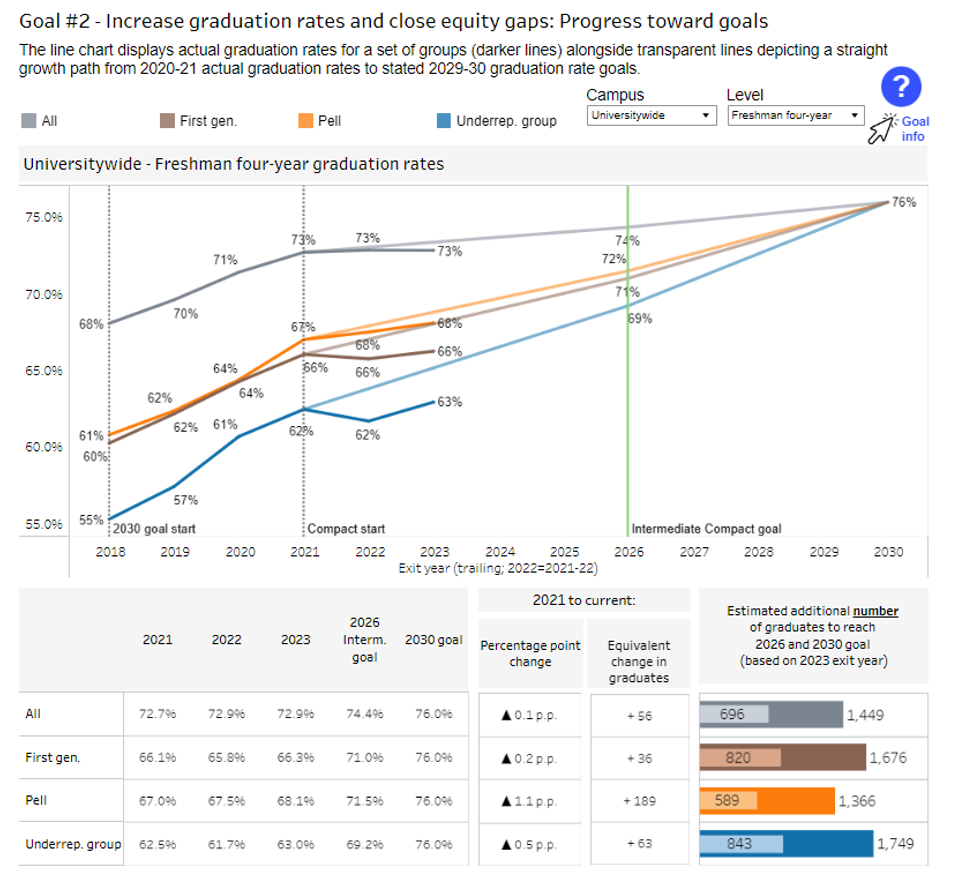
Four-year graduation rates 2018-2023 and Compact and UC 2030 goals (3.1.4)
At the end of 2022-23, the two-year transfer graduation rate increased by four percentage points to reach 64 percent, just 2.5 percentage points from the 2026 intermediate Compact goal. This increase marked a critical recovery from a steep drop of three percentage points seen the previous year. Campus-level gains were sizable and widespread with two UC campuses already surpassing 2030 goals.
In addition, gains were shared across all groups, with increases from 2022 to 2023 of 3.1 percentage points for first-generation students, 5 percentage points for Pell-eligible students, and 5 percentage points for underrepresented students.
UC estimates of the number of additional students needed to graduate to achieve two-year graduation rate goals are 530 transfer students to achieve Compact goals and 1,290 transfer to achieve UC 2030 goals.
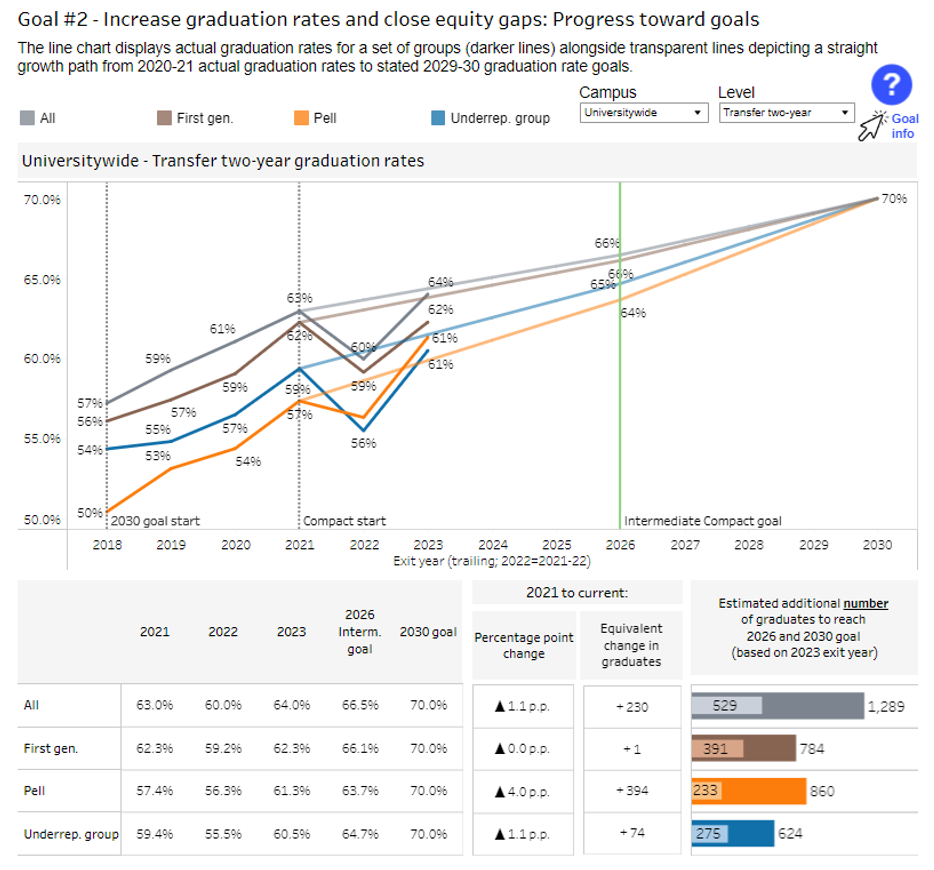
Two-year graduation rates 2018-2023 and Compact and UC 2030 goals (3.1.6)
The funding stability afforded by the Compact with the Governor has been critical to UC’s progress and will continue to be essential to scaling up UC’s efforts to achieve these important goals. As part of UC’s Compact reporting, UC Office of the President collected information on strategies used throughout the system to achieve these graduation rate goals. These findings have been published in a recently released report called UC 2030: Equity is Excellence.
The report identifies ten strategies, grouped into four themes, that describe the work that is ongoing at UC campuses: excellence in teaching and learning, on-time graduation, student experience, and leadership.
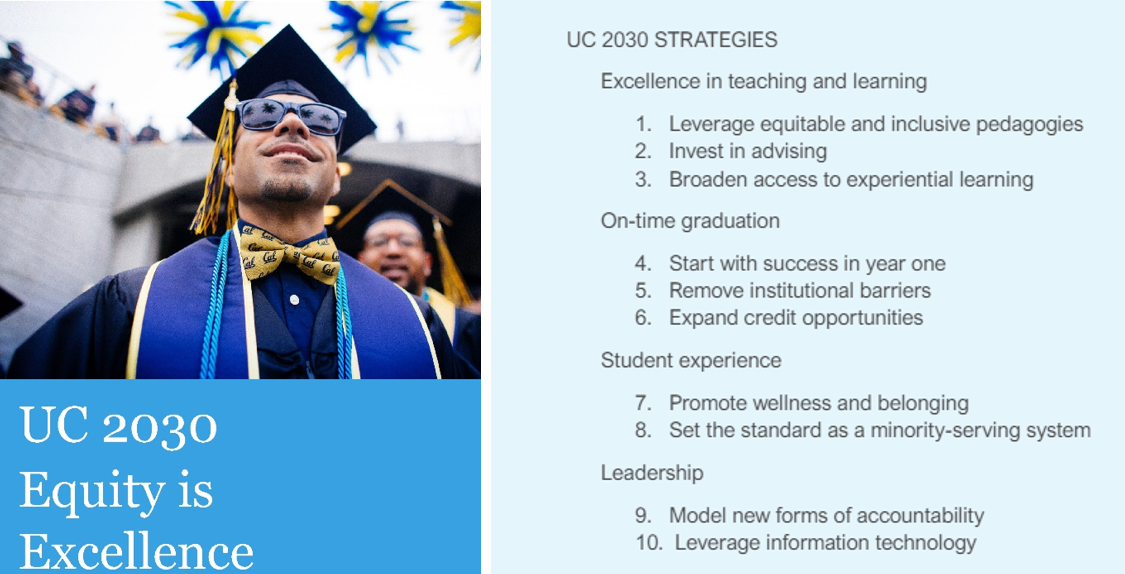
UC 2030 Equity is excellence report
These strategies are rooted in evidence and align with approaches recognized by the Association for Undergraduate Education at Research Universities as critical to meeting the “equity imperative” in higher education. They demonstrate ways the University of California is striving to become a student-serving research university, with lessons for UC campuses, the UC system, and the nation. Select examples of this work include:
- Teaching and learning: UC Davis, UC Irvine, and UC Santa Barbara’s have been leaders in the Sloan Foundation-Funded SESIMIC Collaborative (Sloan Equity and Inclusion in STEM Introductory Courses) whose focus is on bringing the best in evidence-based teaching to bear on design of introductory STEM courses.
- On-time graduation: UC Riverside’s leadership in the University Innovation Alliance included research that living-learning communities (i.e., small cohorts of first-year students sharing common interests) helped transition students to the university experience and led to improved first-year retention rates.
- Student experience: UC San Diego, as part of its Collective Impact initiative, tripled the size of Summer Bridge, its five-week transition program which provides students with the opportunity to earn college credit online and in-person, develop skills for academic success, connect to university resources, and receive support throughout their first academic year.
- Leadership: At UC Santa Cruz, the Associate Campus Provost for Academic Success fills a newly created role that works with academic units to help them identify opportunities to improve student learning, retention, and progress through the major. The Associate Provost and departments both have access to a Department Equity Profile dashboard that provides a wealth of information about student progress at critical points in the curriculum.
Growing future faculty and researchers
Increasing faculty diversity is an important component for advancing student success. Students benefit by learning and engaging with faculty from a range of backgrounds and experiences. Faculty who understand and validate student experiences — especially students from groups that have historically been marginalized in higher education — can foster a sense of belonging, which supports students retention and graduation. UC’s first-generation initiative encouraged first-gen faculty and staff to share their stories with incoming students. The project enhanced connections and mentoring for students, helping them transition and succeed at UC.
UC benefits from having a more diverse faculty by bringing together teams with a broad set of ideas and experiences that can expand hypotheses, sharpen strategies, and enhance solutions to society’s problems. Diverse research teams where all members are welcomed and supported can foster greater creativity, higher productivity, and improved problem-solving ability, including understanding how potential research applications may impact the state as a whole, including its marginalized and underserved communities.
Two UC 2030 goals seek to promote the diversity of UC current and future faculty researchers. First, UC seeks to diversify its graduate student population by recruiting at least 40 percent of UC Ph.D. students come from UC undergraduate programs, and from other Hispanic Serving Institutions, Historically Black Colleges and Universities, and Tribal Colleges and Universities. UC has made steady progress, increasing by about a percentage point each year to almost 32 percent today.
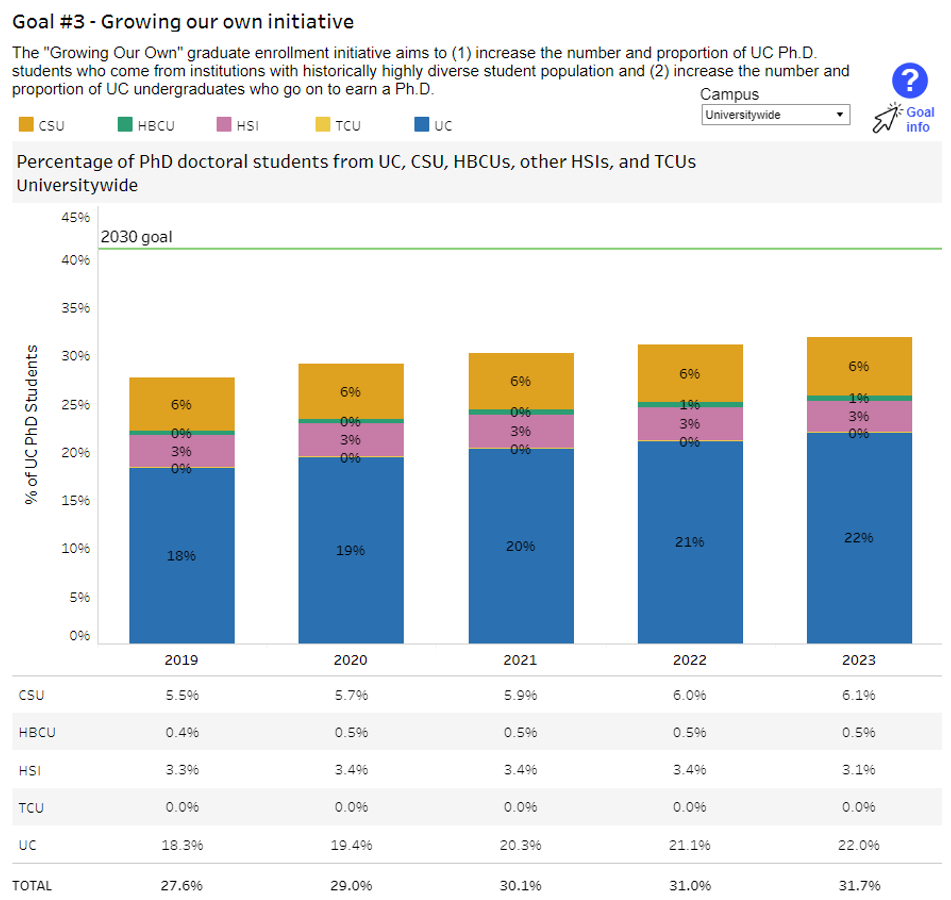
Proportion of Ph.D. doctoral students from UC, CSU, other HSIs, HBCUs, and TCUs (4.2.2)
This progress has been supported through the UC-HSI Doctoral Diversity Initiative and expanded efforts to provide five-year funding packages to attract admitted students to enroll. With intentional focus, UC hopes to continue to make progress in attracting Ph.D. students from these institutions.
Successful completion of the Growing Our Own Initiative is important to the University of California because it will result in a home-grown pool of faculty candidates that more closely represent the diversity of California. The initiative can also have a positive impact on other higher education institutions and wider efforts to diversify the professoriate: UC produces 60 percent of California’s doctoral degree recipients, and almost ten percent of the nation’s Ph.Ds.
As seen below, UC bachelor degree holders are more diverse than the current UC doctoral population. This indicator also shows that new hires for UC faculty are more diverse than existing tenure-tenure track faculty, illustrating the importance of continuing efforts to grow the faculty.
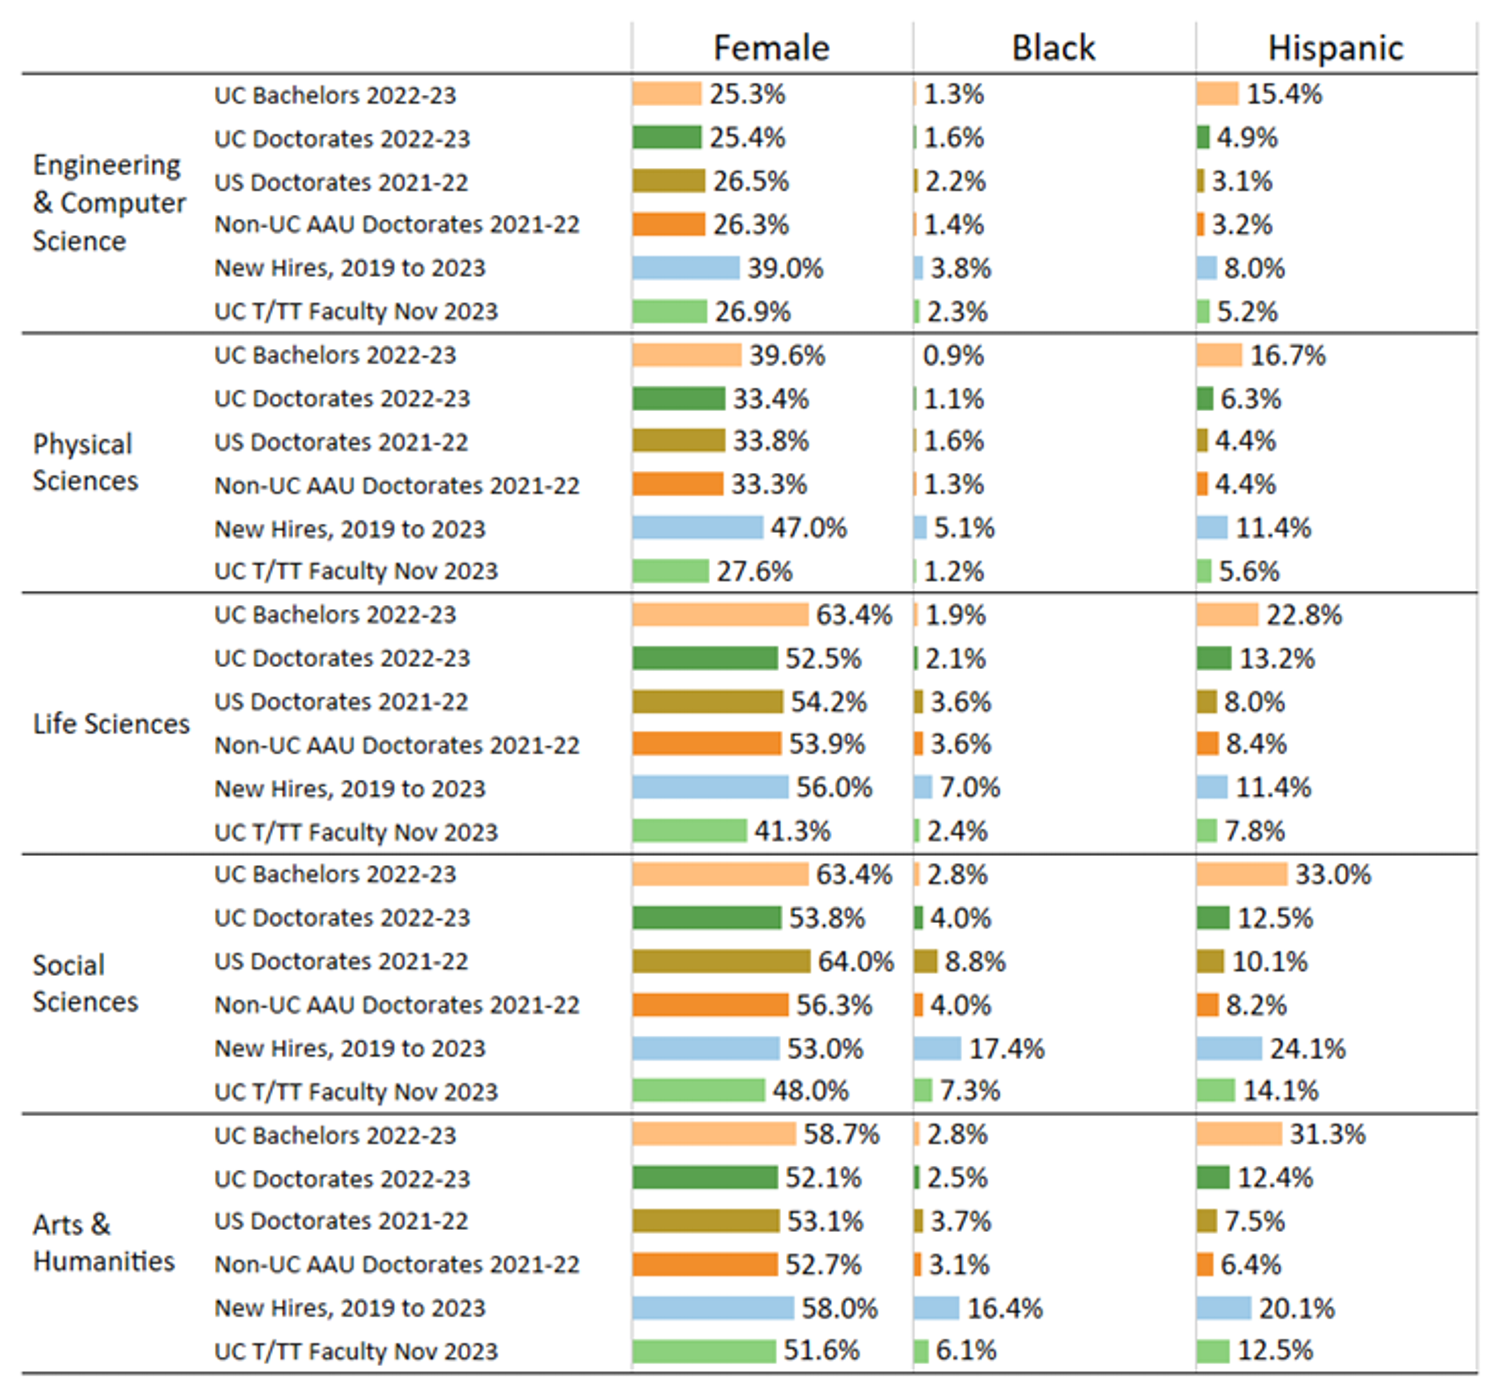
UC pathways to the professoriate (5.3.5)
Second, UC 2030 goals set an initial target of hiring more than 1,100 ladder-rank faculty, with a goal to further diversify the faculty because new hires are more diverse than existing faculty. Pandemic impacts and related budget constraints have stalled faculty hiring and resulted in a slight increase in separations (5.3.4). As a result, the University extended the original four-year hiring goal through 2030. With a recent increase in hiring, the University has made some progress by adding 417 of the 1,100 goal by 2030.
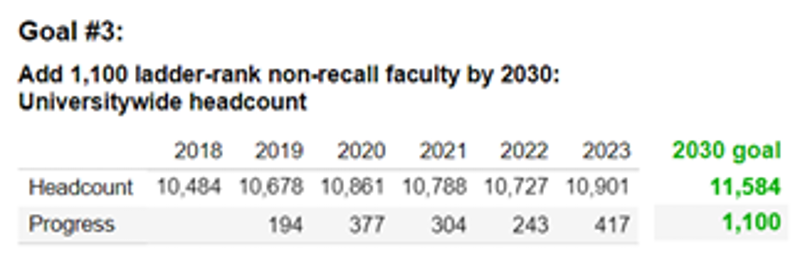
UC ladder-rank faculty headcount, October 2018 to 2023 and 2030 goals (5.3.4)
While people often associate UC with its role in educating and graduating tens of thousands of students each year, the University improves the lives of millions of Californians who never attend a UC campus. Through its world-renowned research enterprise, its top-rated health care, and its role as one of the state’s largest employers, UC’s impact goes far beyond education.
UC research not only seeks to find solutions to the problems we face in society, but its research operations are vital to California’s economy, spurring job growth, the launch of new companies and industries, and creating economic prosperity. In 2022, the UC research enterprise was an $8 billion operation, with UC attracting more than $4 billion in federal research funds to California in support of UC research activities. These funds are used to support research operations, including hiring of student and staff researchers.
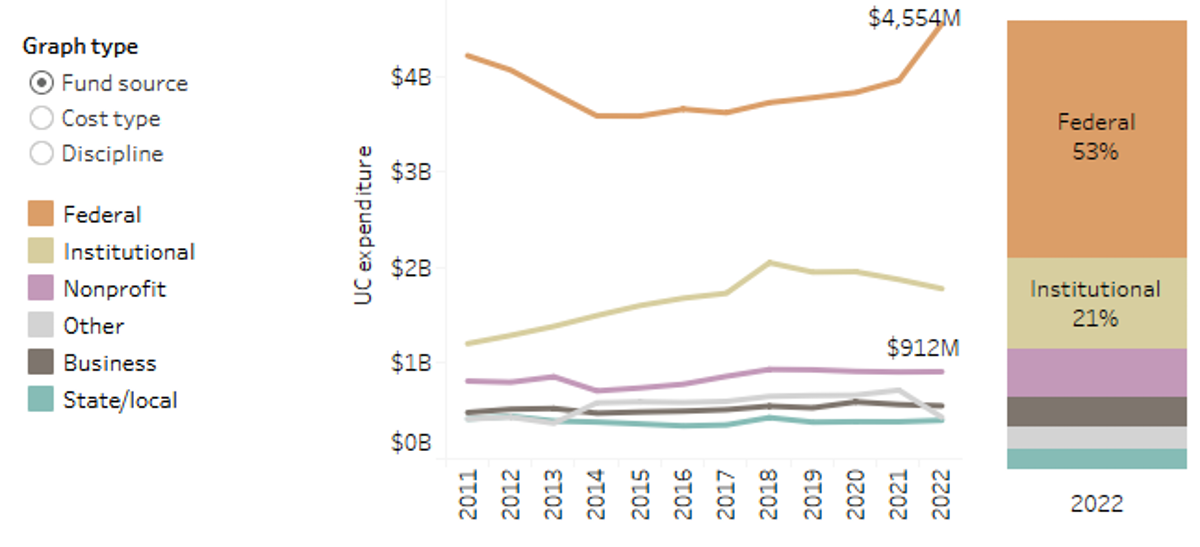
Total research expenditures by fund source, 2011 to 2022 (9.1.1)
UC research often leads directly to new patentable inventions and other innovations. Bringing them to the marketplace is part of UC’s public service mission. UC inventions take two paths to the marketplace: they may be licensed to an existing company or they may become the cornerstone of a new startup company. The commercialization process promotes technological advances and generates economic benefits to the state of California, through employment and vital tax contributions to state and local governments.
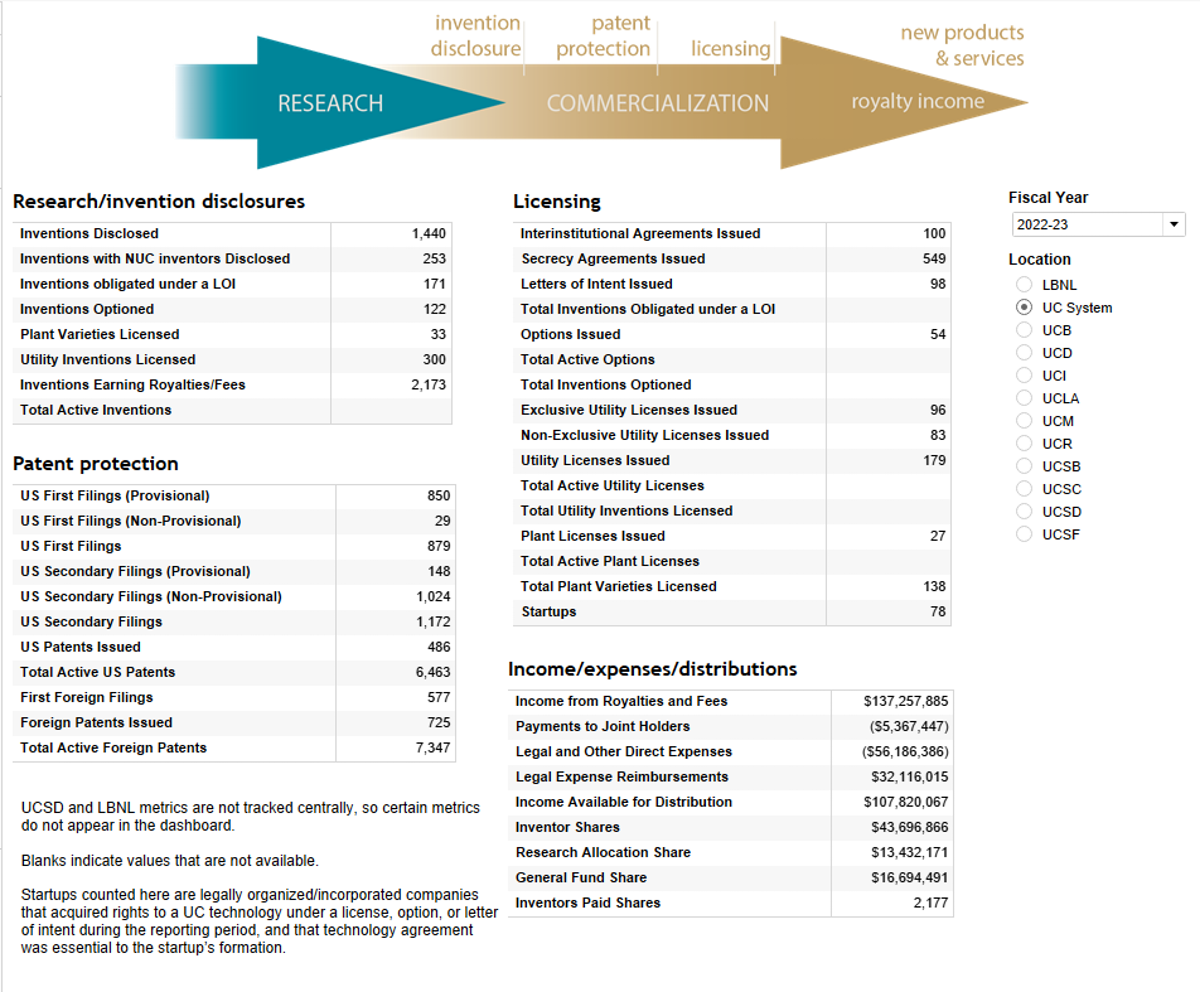
Licenses, research/innovation disclosures, and patent protection (9.2.2)
University of California Health provides access to health care for people in our cities, rural areas, and underserved communities. Nearly three quarters of the patients in UC hospitals on any given day have Medicare or Medi-Cal coverage (11.3.2). In fiscal year 2023, UC academic health centers provided $1.3 billion in care to Medi-Cal enrollees for which it was not reimbursed, a 42 percent increase over the 2019 fiscal year. UC’s academic health centers provided an additional $2.4 billion in uncompensated care for people with Medicare coverage in fiscal year 2023, a 38 percent increase since fiscal year 2019.
The University also contributes to California as its third largest employer. As seen in the map below, over 266,000 UC employees and over 65,000 retirees live across the state, illustrating that UC’s economic impact goes well beyond its ten campus locations. Members of its workforce purchase goods and contribute to local economies where they reside. Their contributions also include state and local taxes.
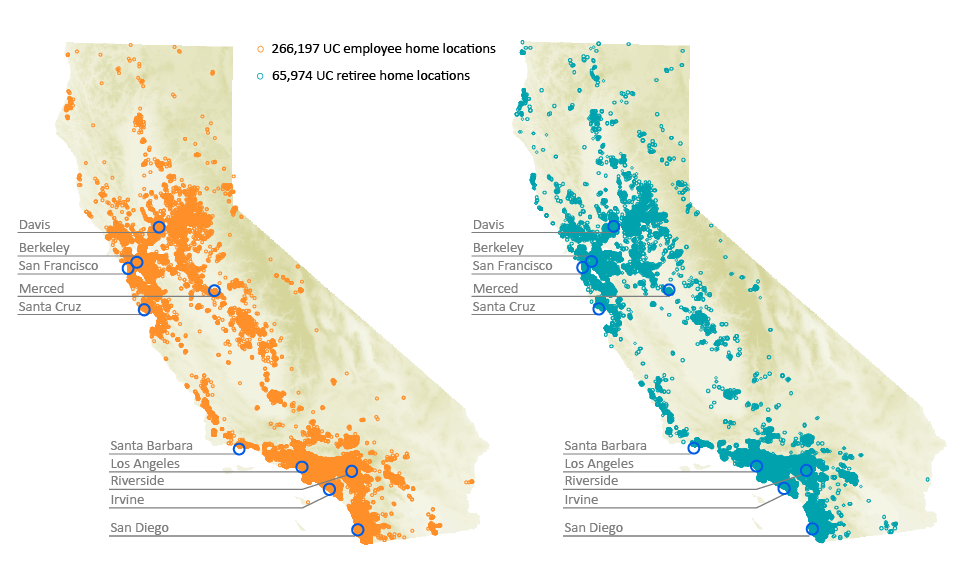
California resident faculty, academics, and staff employees and retirees, 2023 (10.3.4)
In support of its transparency efforts, the University of California produces the UC Accountability Report, along with the UC Information Center, with detail on University operations, including progress on strategic goals, areas of strength, and opportunities for improvement.
Appendix 1 of this report provides a screenshot of the UC 2030 dashboard, which tracks progress for the UC system and campuses on UC 2030 goals. Attachment 2 provides a full list of indicators included within the Accountability Report spanning all UC operations, which provide additional context and can be downloaded to support other use or analyses.
APPENDIX 1 | UC 2030 DASHBOARD
The UC 2030 dashboard highlights key goals and detail on progress to achieve UC 2030 goals.
Links to the Table of Contents where indicator titles are linked to the indicators.
[1] 2022 Highly Cited Researchers, Clarivate
[2] California Future Health Workforce Commission final report
[3] University of California 2030 Capacity Plan