The broad scope of UC research
The California Master Plan for Higher Education designates the University of California as the primary State-supported academic agency for research. UC research contributes to the state and to the nation through discoveries that improve health, technology, welfare, and the quality of life. Research represents the creation of new knowledge, which can be communicated, curated, and cultivated to benefit society.
This chapter presents a largely quantitative description of UC’s research. These measures, however, do not capture the wide range of curiosity-driven research at UC. Quantitative measures emphasize fields that receive sizable funding and produce large numbers of publications, such as medicine, physical and material sciences, and engineering. These measures underrepresent research achievements in the arts, humanities, social sciences, and theoretical sciences, where work leaves less of a financial footprint, and where results are often disseminated in books or performances rather than in journal articles.
Quantitative measures cannot fully capture the multi-faceted ways by which UC research contributes indirectly and over time to the state, the nation, and the world. UC research advances knowledge in ways that directly improve health, technology, and the quality of life. It enables UC graduate and undergraduate students to participate in research and to receive instruction from the world’s foremost researchers, thus enhancing their learning experiences. It makes cutting-edge discoveries readily available to the healthcare, agricultural extension, and other vital public services that UC provides, greatly enhancing their value to the people of California. It creates thoughtful work in the arts and humanities that furthers understanding of our rich diversity and of our place in the world.
UC Natural Reserve System — science promoting environmental stewardship
The UC Natural Reserve System (NRS) is the largest field laboratory system in the world. Its 42 protected natural areas represent most of California’s major habitat types, including coastal tide pools, inland deserts, lush wetlands, and redwood forests, across nearly fifty thousand acres. Reserves support environmental research, provide immersive educational experiences to students, and connect the public with nature. Programs train the next generation of diverse scientists and leaders and provide real-time climate and biodiversity monitoring that helps realize state environmental goals. The NRS works to ensure nature remains strong in the face of climate change, saving biodiversity, lives, and livelihoods within California and around the world.
UC National Laboratories
The Regents of the UC have a long and rich history in the management and operation of three U.S. Department of Energy (DOE) national laboratories as a service to the nation that spans more than 80 years: Lawrence Berkeley National Laboratory (Berkeley Lab or LBNL) since 1931, Los Alamos National Laboratory (LANL) since 1943, and Lawrence Livermore National Laboratory (LLNL) since 1952. LBNL’s mission is to create advanced new tools for scientific discovery and to work on problems of great scale, enabling transformational solutions for energy, health, and environment. LLNL has a mission of strengthening the United States’ security through development and application of world-class science and technology to: enhance the nation’s defense; reduce the global threat from terrorism and weapons of mass destruction; and respond with vision, quality, integrity and technical excellence to scientific issues of national importance. LANL's mission is to develop and apply science and technology to ensure the safety, security, and reliability of the U.S. nuclear deterrent; reduce global threats; and solve other emerging national security and energy challenges.
Federal funds currently support more than half of the research conducted at UC. Sixty-five percent of federal research expenditures is funded by the Department of Health and Human Services (HHS).
9.1.1 Total research expenditures by fund source, Universitywide, 2011 to 2023

Research expenditure comparisons dashboard
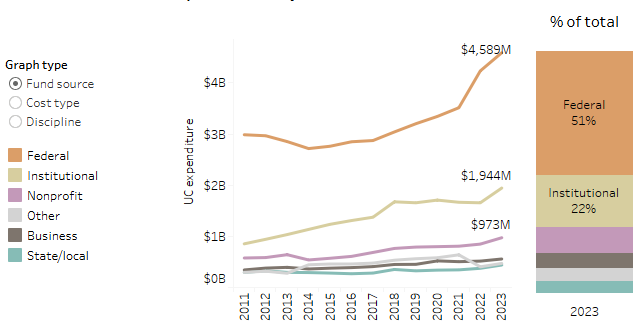
Note: Other agencies that fund federal research include the National Science Foundation (NSF), Department of Defense (DOD), Department of Energy (DOE), National Aeronautics and Space Administration (NASA), and United States Department of Agriculture (USDA).
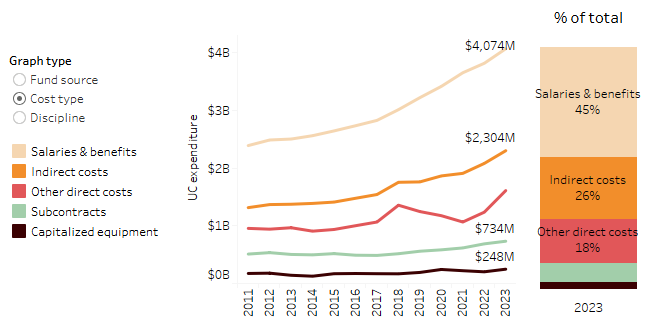
Salaries and benefits represent close to half of all research expenditures.
9.1.2 Total research expenditures by cost type, Universitywide, 2011 to 2023
Research expenditure comparisons dashboard
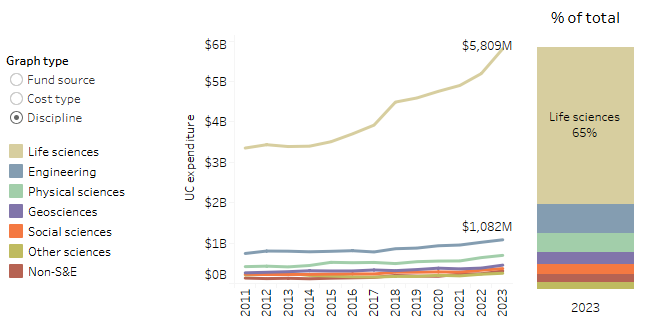
Life sciences represent sixty-five percent of research expenditures. Health and Human Services (HHS), which includes National Institutes of Health (NIH), funds almost forty-five percent of UC life science research expenditures.
9.1.3 Total research expenditures by discipline, Universitywide, 2011 to 2023
Research expenditure comparisons dashboard
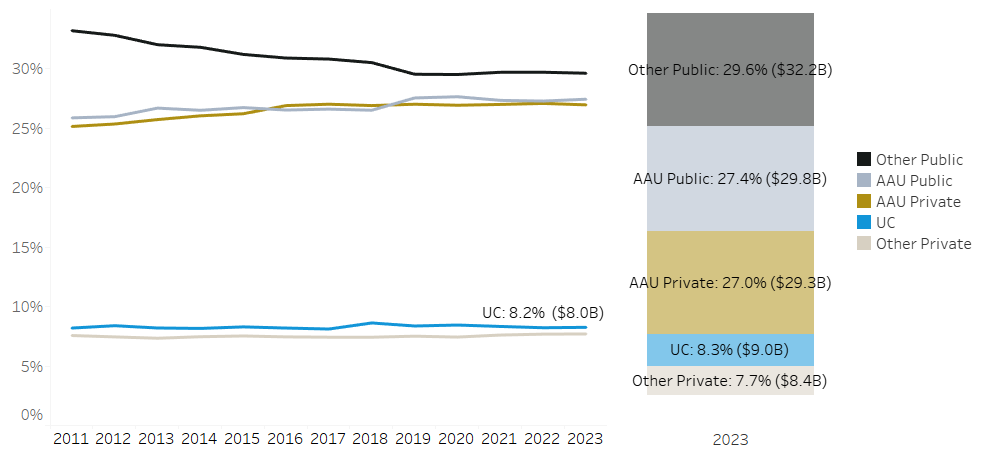
UC currently accounts for eight percent of direct research expenditures among institutions that participate in the Higher Education Research Expenditure survey.
9.1.4 Share of national research, US four-year universities, 2011 to 2023
Research expenditure comparisons dashboard
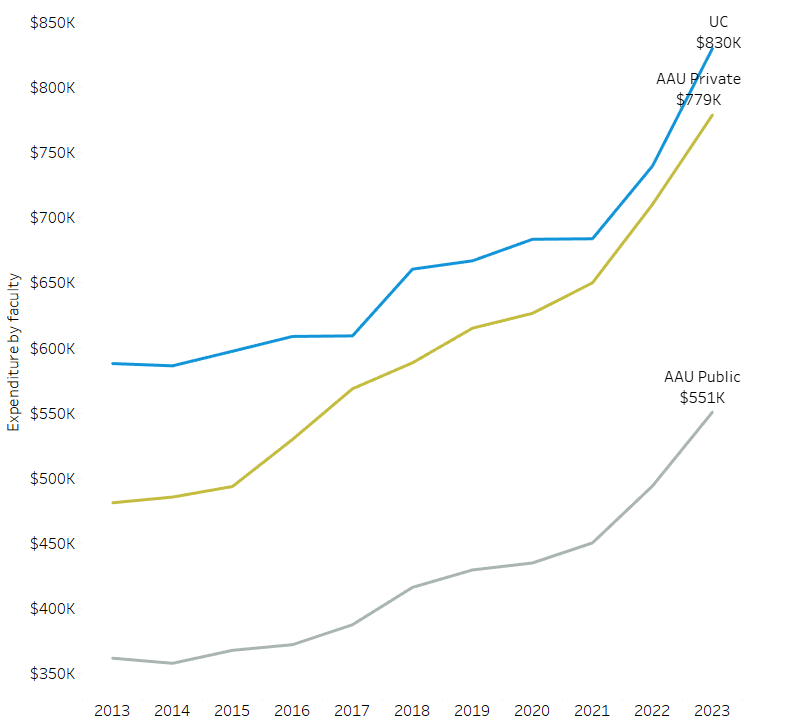
Average research expenditures per tenured/tenure track faculty are higher at UC than its AAU public peers.
9.1.5 Average direct research expenditures per tenured/tenure track faculty, UC and AAU comparison universities, 2013 to 2023
Research expenditure comparisons dashboard
9.1 RESEARCH EXPENDITURES
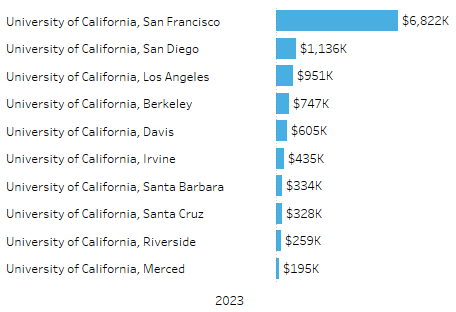
Average research expenditures per tenured/tenure track faculty are particularly high at UC San Francisco, the only UC campus dedicated exclusively to the health sciences.
9.1.6 Average direct research expenditures per tenured/tenure track faculty, UC campuses, 2023
Research expenditure comparisons dashboard
Source: UC Information Center
9.1 RESEARCH EXPENDITURES
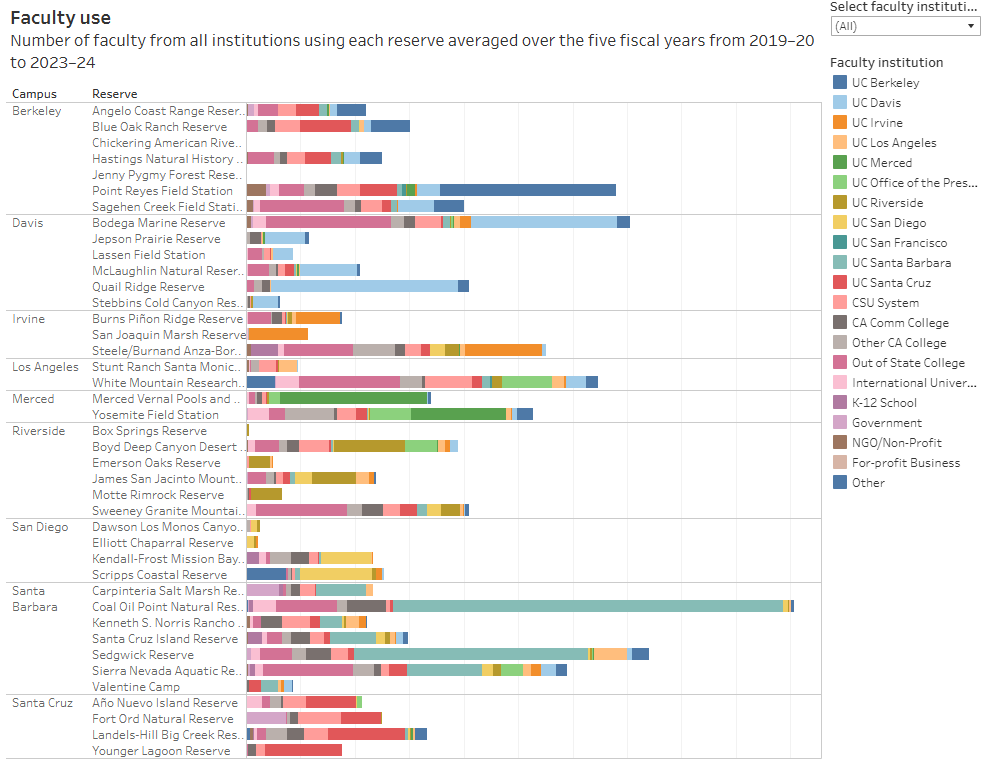
UC Natural Reserve System has hosted an average of 3,886 researchers and 1,174 faculty to conduct research in nearly 50,000 acres of protected California habitat over the last five fiscal years.
9.1.7a UC Natural Reserve System use data
UC’s Natural Reserve System use data dashboard provides additional detail by campus
Source: UC Information Center
The UC Natural Reserve System use data dashboard provides additional detail by campus.
9.1.7b UC Natural Reserve System locations and campus affiliation

Source: UC Natural Reserve System
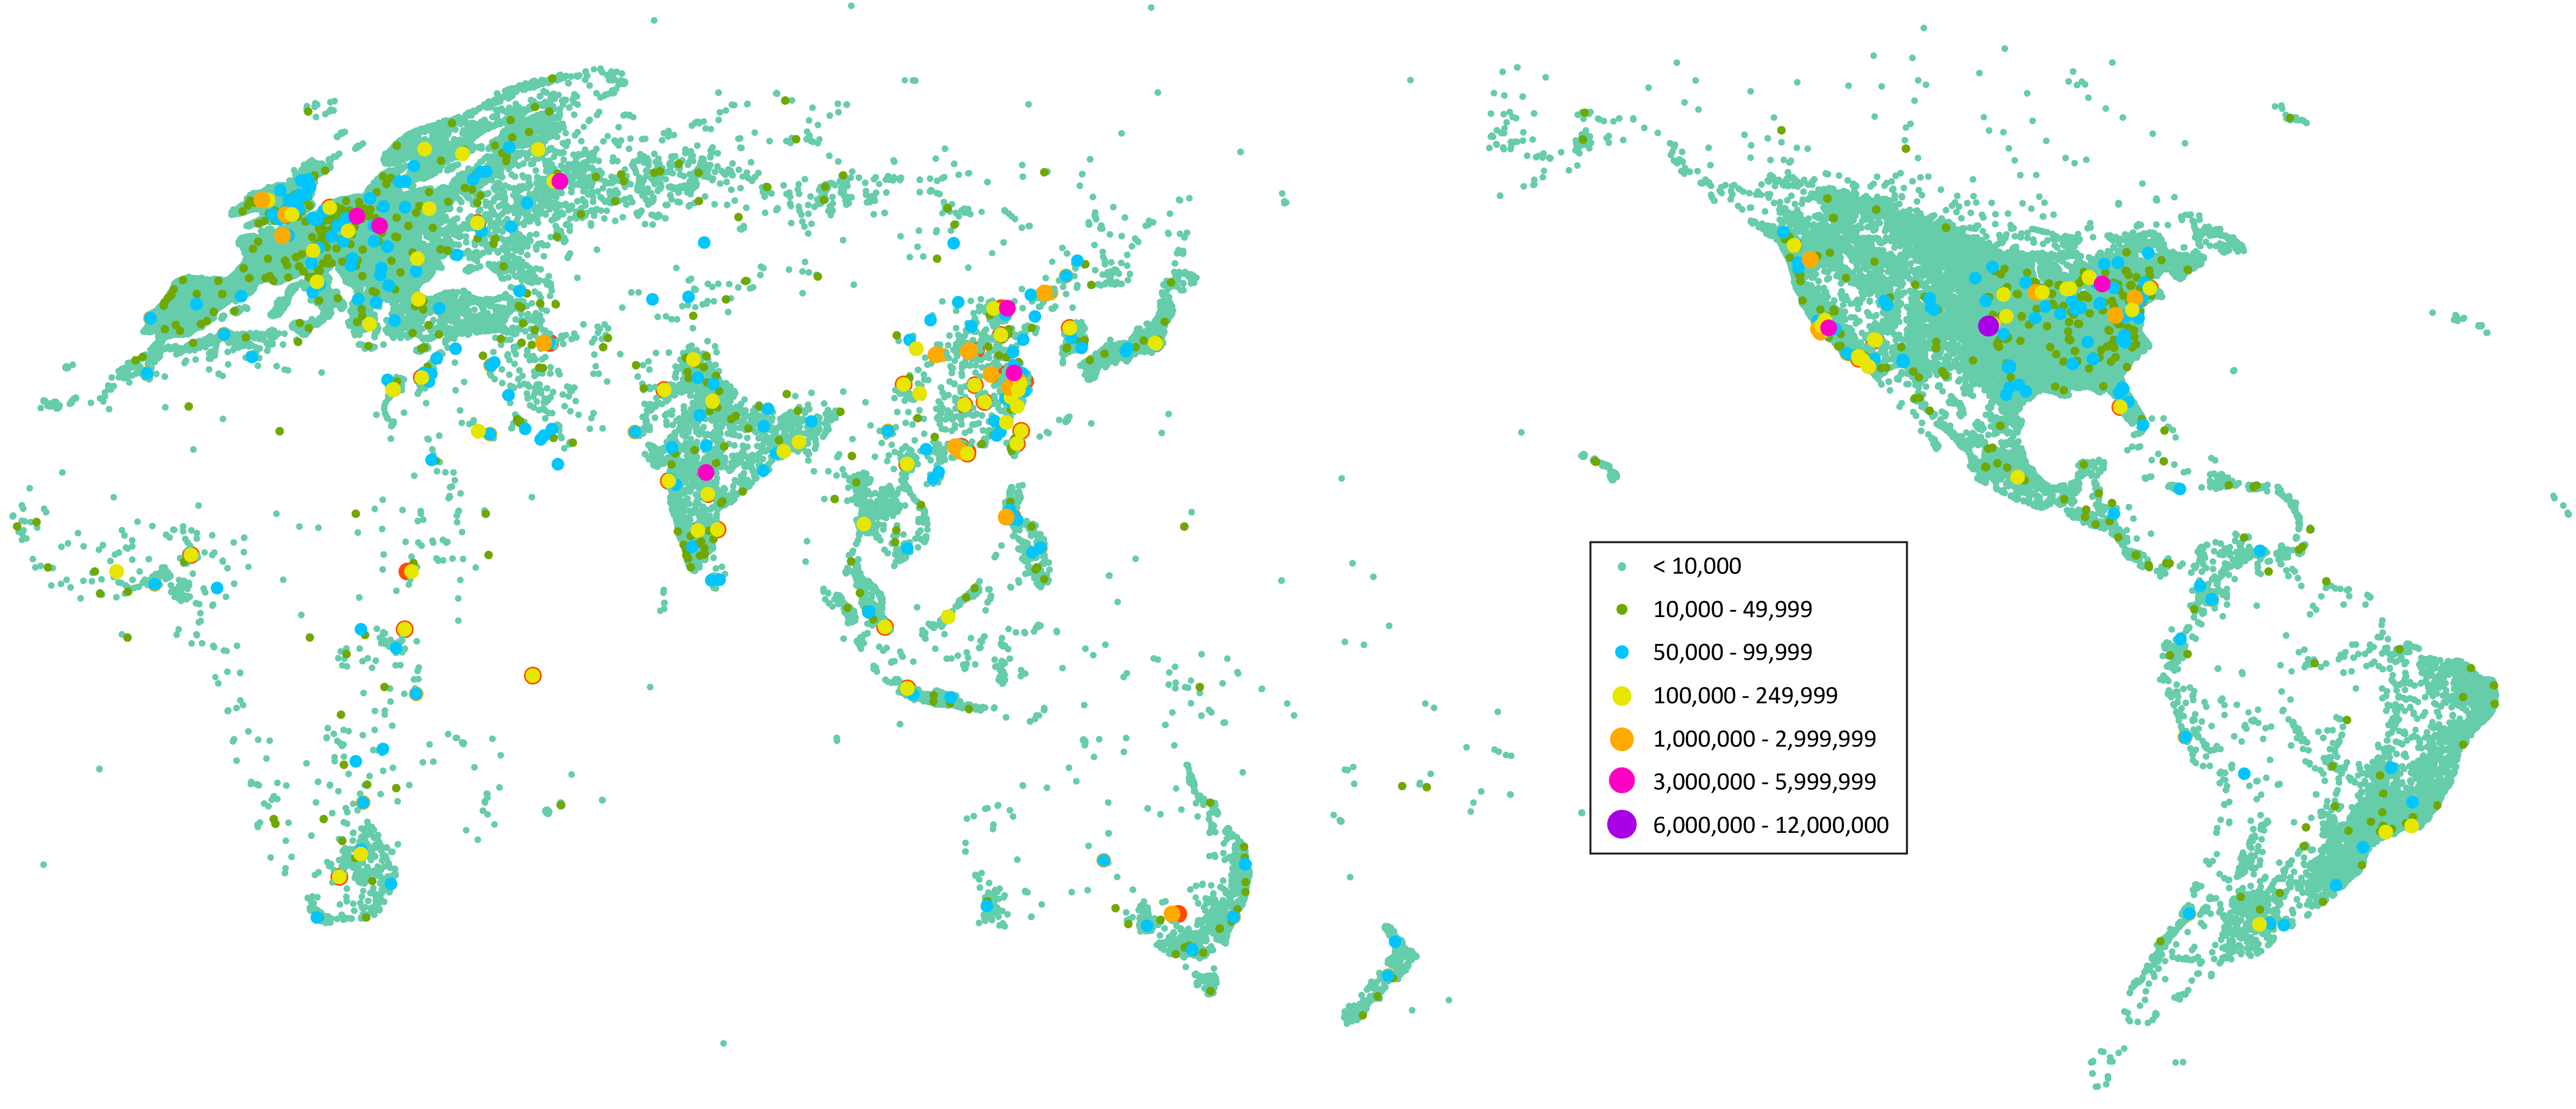
UC’s eScholarship Repository provides public access to more than 500,000 UC research publications, viewed by readers in 98 percent of the world’s countries.
9.2.1eScholarship downloads and deposits of UC scholarly materials, Universitywide, through May 2025
Source: California Digital Library
UC’s Open Access (OA) policies and eScholarships OA journals program contribute substantially to this growing body of freely available scholarship. This map shows the geographic distribution and concentration of views for scholarly materials in eScholarship, UC’s open access (OA) publishing platform and institutional repository managed by the California Digital Library. eScholarship contains over 525,000 individual items, including research articles, working papers, and electronic theses and dissertations, as well as over 90 open access journals that are published on the platform. Since 2002, UC-sponsored research and journals in eScholarship have been viewed and/or downloaded over 180 million times by readers in more than 175,000 locations in more than 175,000 locations in 98 percent of the world’s countries across all seven of the world’s continents.
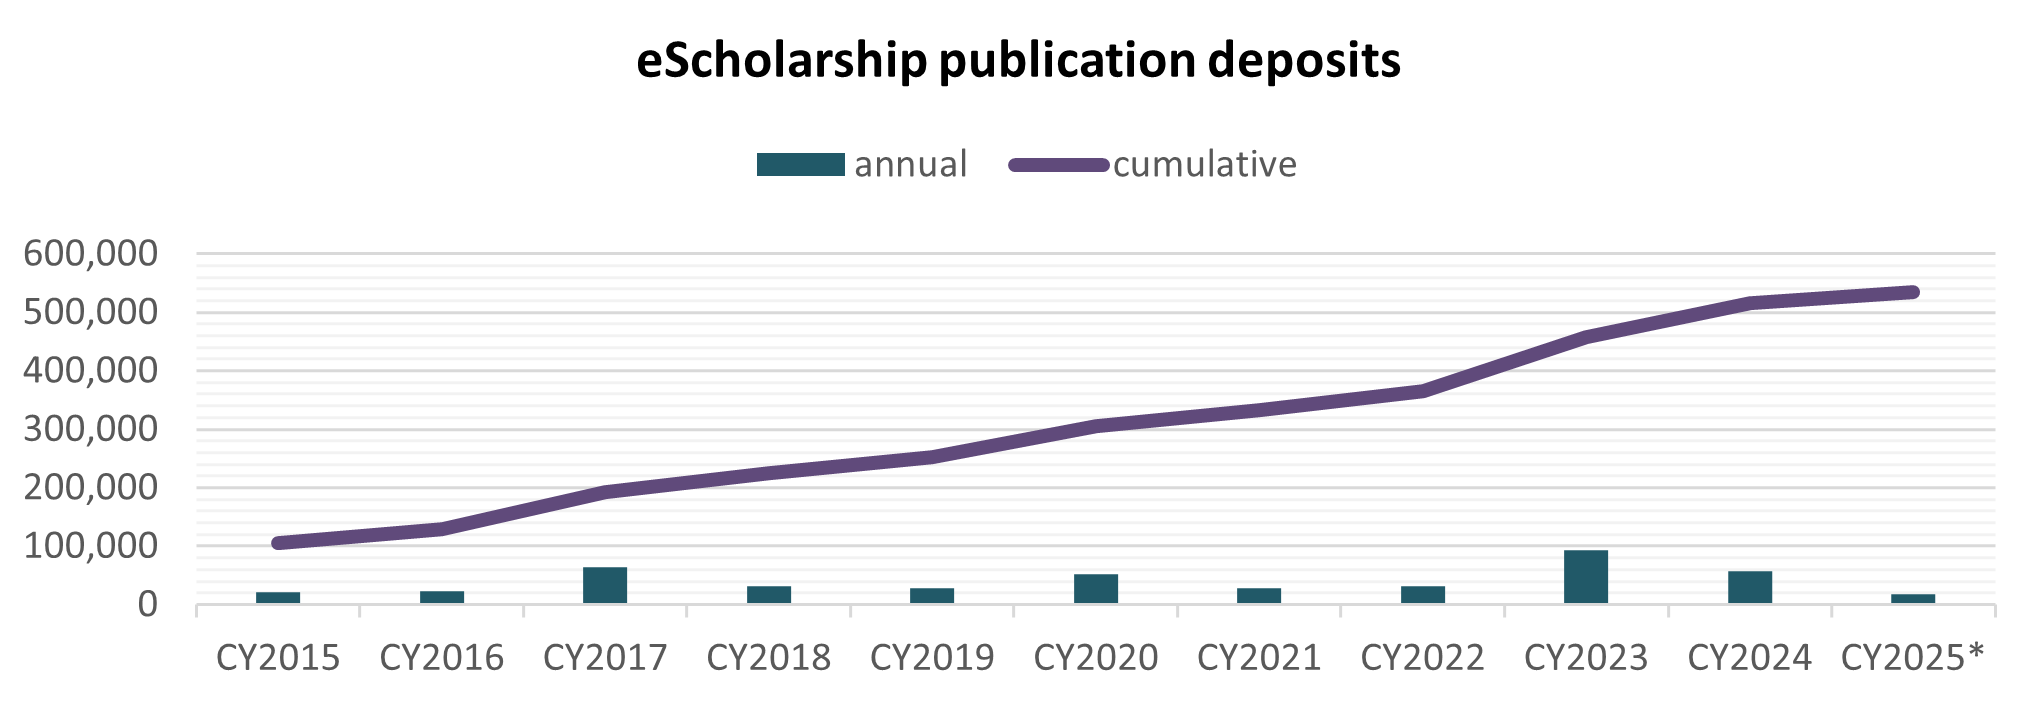
*partial year data
** the data presented here should be considered
approximate and subject to revision. Learn more."
UC’s technology commercialization program takes inventions from the laboratory to the marketplace, benefiting the public by building alliances with industry to create innovative products for the world and to generate new businesses and jobs for California.
9.2.2 Licenses, research/invention disclosures, and patent protection
UC inventions at a glance dashboard
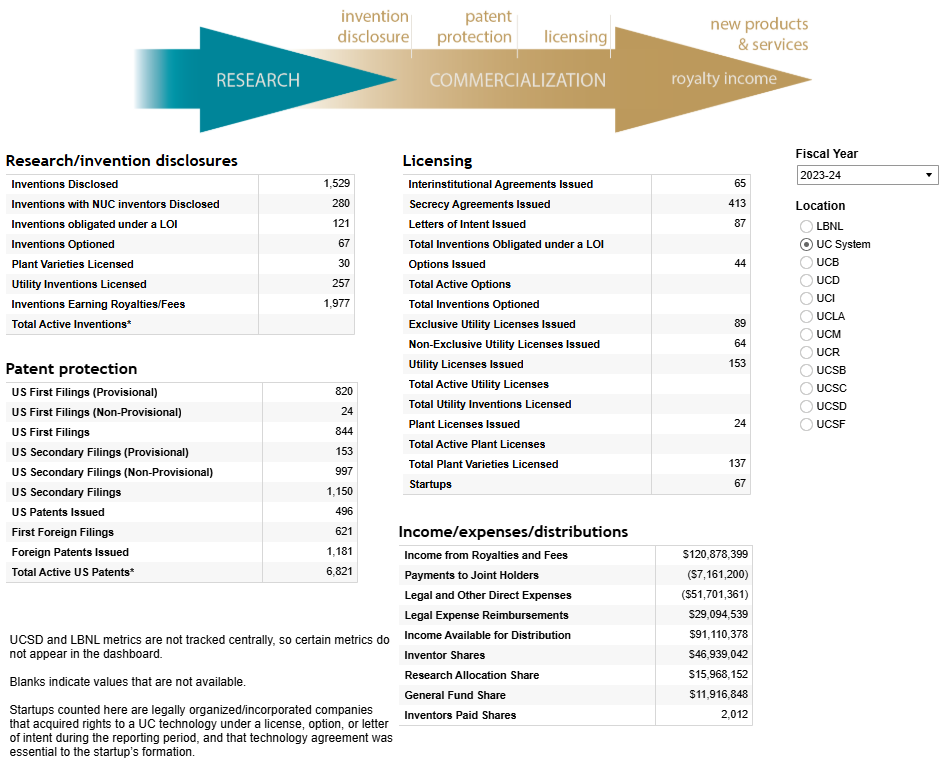
On average, UC research generates four new inventions every day; bringing them to the marketplace is part of the UC public service mission. UC inventions take two paths to the marketplace: they may be licensed to an existing company or they may become the cornerstone of a new startup company.
Invention commercialization promotes technological advances, generates economic benefits, and helps support UC’s research enterprise. UC’s patents are commercialized under utility licenses and plant licenses.
Utility licenses cover inventions protected by utility patents, such as processes, machines, manufactured items, or compositions of matter, and are often issued exclusively to a single licensee. Plant licenses cover plant cultivars and are often licensed non-exclusively to nurseries and distribution centers.