EXECUTIVE SUMMARY
The University of California (UC) is crucial to the state and the nation. UC’s mission is to improve lives through education, research, health care, and service to the people of California and beyond. For almost 160 years, the University has stayed true to that mission, becoming an essential partner with State leaders to strengthen and grow California’s economy.
Last year, contributions from the University helped California become the world’s fourth largest economy. UC is the second largest employer in the state, with almost 280,000 employees and 67,000 retirees across California – one of the many ways that UC’s economic impact goes well beyond the borders of its ten campuses and six academic health centers. The University’s fiscal impact includes $82 billion in overall economic activity. Half a million jobs in California – or one in every 45 – are supported by University activities. UC and its people generate nearly $12 billion annually in federal, state, and local tax revenues (12.5.3).
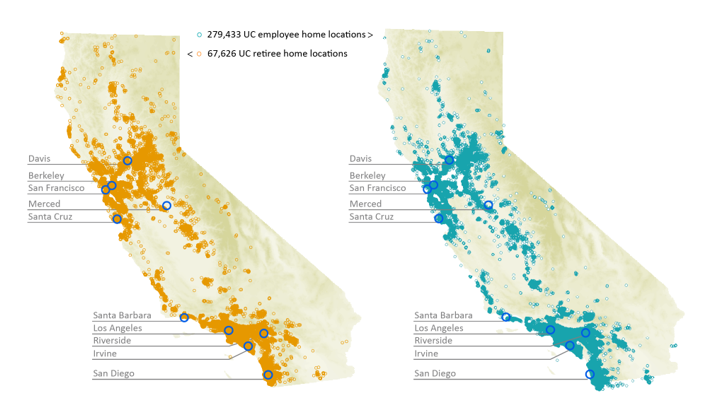
California resident faculty, academics, and staff employees and retirees, 2024 (10.3.4)
The University also impacts the state by expanding educational opportunity and workforce development. For example, one of the University’s top priorities is helping more Californians achieve the benefits of a high-quality, affordable UC education. The UC 2030 goals focus on closing academic achievement gaps and producing a 20 percent increase in UC degree-holders by 2030. The UC Accountability Report is one way the University tracks its progress toward those ambitious goals, while also providing transparency about key UC operations and trends.
This year’s Executive Summary highlights UC’s efforts to promote economic mobility, support California’s workforce needs, and advance California’s economy and the well-being of its people through research and health care. UC’s longstanding partnerships with the state and federal government are critical to the University’s efforts and impact.
The appendix to this report provides a screenshot and link to the UC 2030 dashboard, which includes detailed metrics for the UC system and its individual campuses related to the UC 2030 goals. It also provides a full list of Accountability Report indicators that track critical measures across UC operations.
UC education promotes economic mobility and supports California’s workforce
UC prides itself on its success in fostering economic mobility and supporting the state’s workforce needs by providing students with access to a world-class education regardless of their income and background. Through its commitment to affordability, need-based financial aid, and student academic preparation and education partnership programs, UC enables students from all backgrounds to obtain degrees that significantly enhance their lifetime earning potential. The University also aligns its academic programs with evolving demands of the state’s economy, producing graduates in high-need fields.
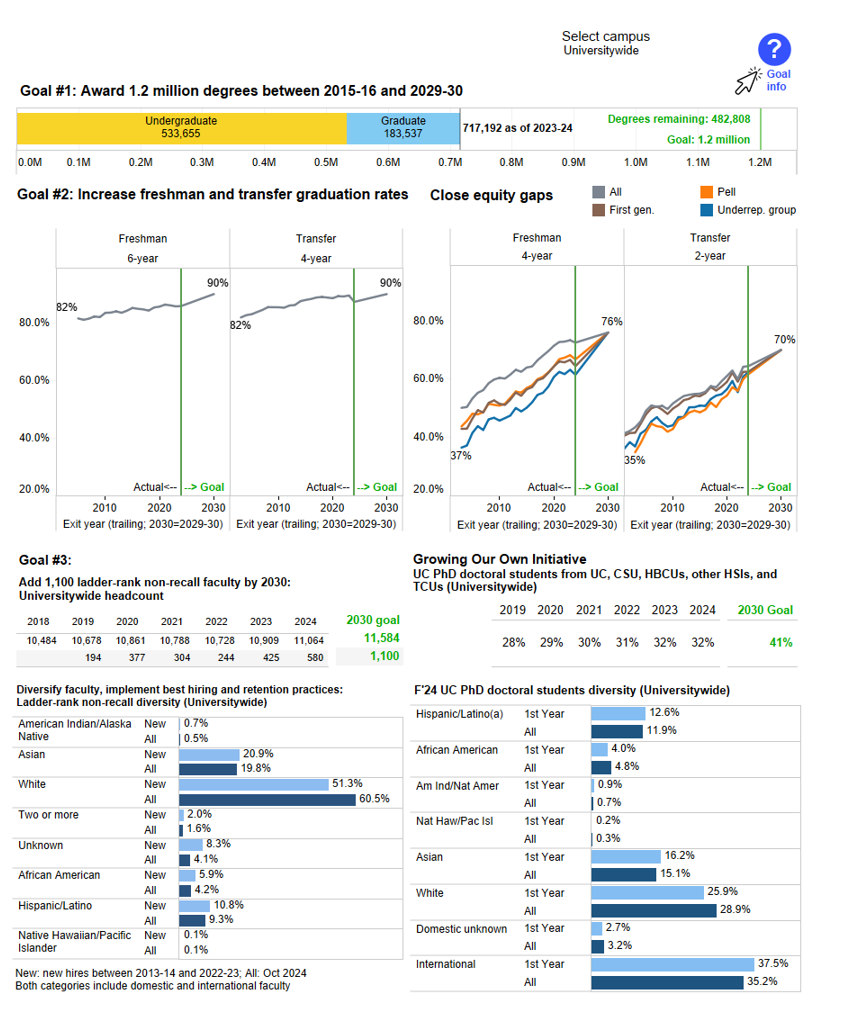
To achieve the UC 2030 goal of producing 200,000 more degrees on top of the 1 million projected by 2030, the University is working to ensure that nine out of every ten undergraduates leave with a UC degree and that students are able to earn their degrees in a timely fashion, with particular emphasis on improving four-year freshman graduation rates and two-year transfer graduation rates for Pell, first generation and underrepresented students who make up the majority of California public high school students.
For fall 2024, UC enrolled the largest-ever incoming class of California resident undergraduates for the second year in a row. This increase reflects significant progress towards the University’s UC 2030 capacity plan to grow the undergraduate California resident population by roughly 17,000 full-time equivalent (FTE) students – from 200,000 FTE students in 2020–21 to 217,000 in 2029–30.
To ensure that the University remains accessible to all academically eligible California students, regardless of their financial resources, affordability remains among UC’s highest priorities. Thirty-three percent of UC undergraduates are Pell Grant recipients, a higher percentage than the non-UC American Association of University (AAU) public or AAU private peer average at 21 and 17 percent respectively.
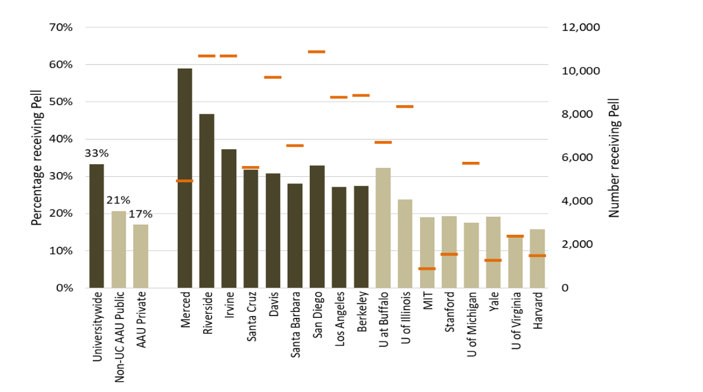
Undergraduate Pell Grant recipients, UC and comparison institutions, 2022–23 (2.2.1)
In fall 2022, the University established the Tuition Stability Plan that helps families better manage costs by holding tuition rates flat over the course of a student’s education, up to six years. The plan also provides new resources for financial aid. In addition, and consistent with the shared goals in the Multi-Year Compact between the Governor and the University, UC has focused efforts to expand debt-free pathways for undergraduate students and reduce non-tuition expenses such as textbooks, housing, food, and transportation.
Over the past seven years, both the proportion of students graduating with debt and the average amount of debt they have at graduation have declined steadily across all income groups. Today, 69 percent of UC undergraduates graduate with no student debt. For those who do borrow, the average student loan debt at graduation in 2023–24 was about $18,200 (2.3.1). Student loan levels at UC campuses are among the lowest within the Association of American University (AAU) public institutions.
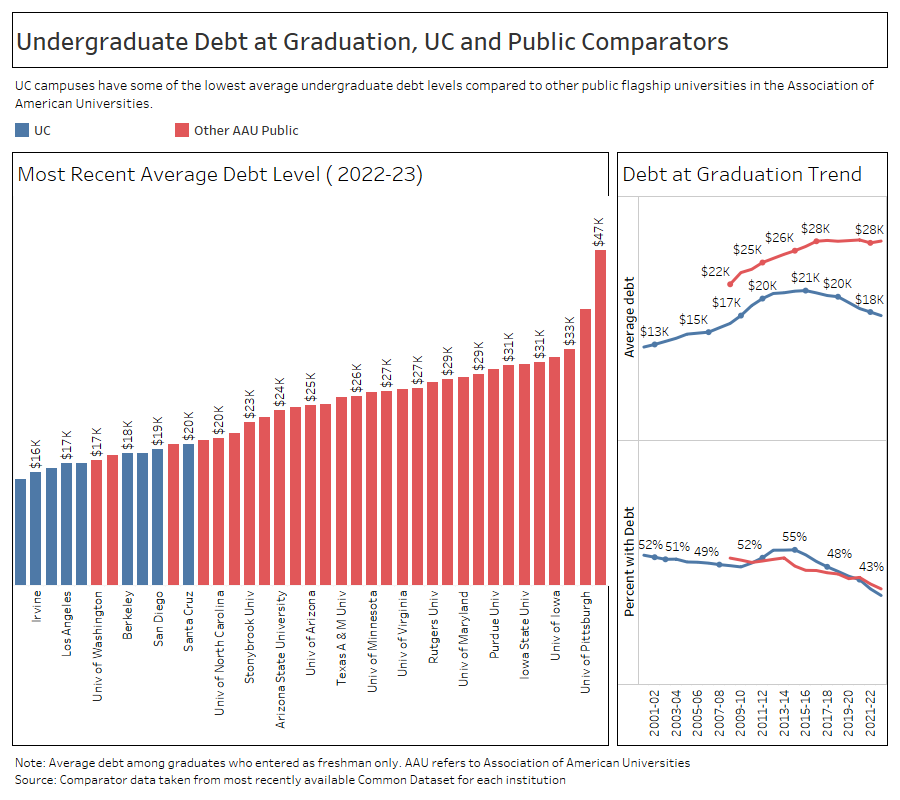
Undergraduate debt at graduation, UC and public comparators, UC and public comparison institutions, 2022–23 (2.3.2)
Undergraduate affordability dashboard
Furthermore, by five years after graduation, over 90 percent of students have manageable debt-to-earnings ratios of less than 10 percent – the portion of annual earnings required to repay a student’s debt at graduation, based upon a standard ten-year repayment plan (2.3.3).
A UC diploma is a vehicle to economic mobility, with degrees that deliver an array of benefits both for students and their families. Overall and across most disciplines, undergraduate degree recipients double their earnings between two and ten years after graduation. Furthermore, the majority of UC Pell grant recipients earn more than their families within four years of graduation – reinforcing UC’s role as an economic mobility machine (3.3.2).
UC graduates go on to work in a wide range of industries in California. Over time, bachelor’s degree recipients move to high-skill industries such as education, health care, public administration, engineering, and tech jobs. Many UC graduates also work in the state’s education, health care and social assistance workforce. Ten years after graduation, about 14 percent worked in higher education and K-12 institutions and around 15 percent worked in health care or social assistance. Nearly 40 percent of UC undergraduate degree recipients go on to earn a graduate degree, the majority of which are master-level degrees (3.3.4).
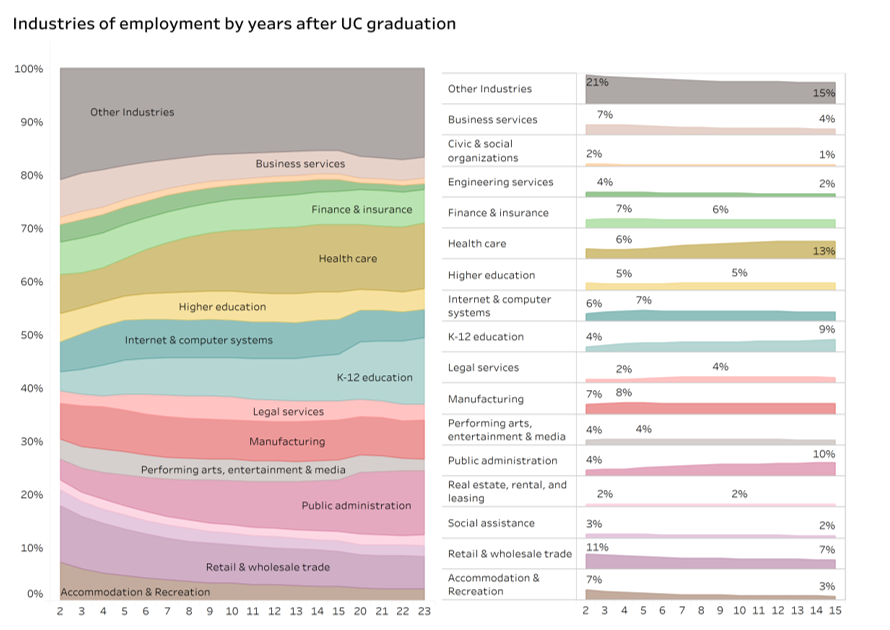
Industry of employment of UC bachelor’s graduates by discipline and years after graduation, Universitywide, for 2001–02 to 2020–21 graduating cohorts (includes 2001-02 and 2000-01 graduating cohorts, combined). (3.3.3)
With the most recent cohort, 86 percent of freshman and 87 percent of transfer students leave with a UC degree (3.1.1 and 3.1.7). Timely graduation cuts the cost of a UC degree, making it far more likely that a student will go on to earn a graduate degree, which significantly increases their lifelong earnings. UC 2030 goals include a 76 percent four-year graduation rate for freshman and 70 percent two-year graduation rate for transfers, with a critical component to achieving these goals being improvements in rates for Pell, first generation and underrepresented students. Existing gaps in rates between subgroups can be explained more by differences in academic preparation, than student characteristics (3.1.8 and 3.1.9).
Recent retention rates are high, at 93 and 94 percent for freshman and transfer students, rebounding after a drop in retention rates seen during the COVID-19 pandemic. However, some subgroups are as much as three percentage points lower for freshman students and less than one percentage point lower for transfer students (3.2.1a and 3.2.1b).
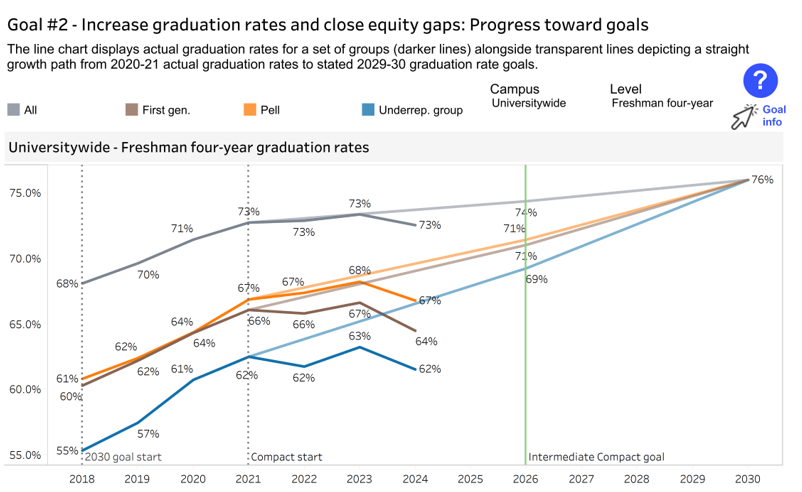
Freshman four-year graduation rates by first-generation, Pell, and URG status (3.1.4)
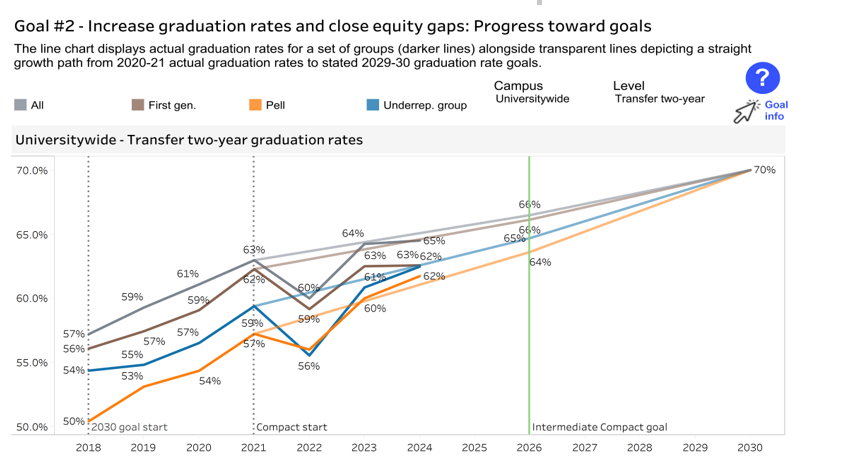
Transfer two-year graduation rates by first-generation, Pell, and URG status (3.1.6)
UC research supports existing and new industries and improves lives
While UC is best known for its role in educating almost 300,000 students each year, the University is among the nation’s largest and most impactful research enterprises and is dedicated to tackling urgent problems that face the state and world, creating knowledge that improves lives, and innovating to keep America at the forefront of scientific and technological advancements. The University’s world-renowned research enterprise is also vital to California’s economy, spurring job growth, the launch of new companies and industries, creating economic prosperity, and advancing scientific breakthroughs that benefit the entire world. Strong federal funding from the nation’s science agencies is critical to UC’s role in driving U.S. innovation.
For example, last year University researchers launched a novel gene therapy that has the potential to cure sickle cell disease – an inherited blood disorder that affects approximately 100,000 Americans and millions more worldwide. The therapy, currently under trial, involves CRISPR-SCD001, a patient-specific blood stem cell therapy product developed by researchers at UC San Francisco, UCLA, and UC Berkeley with a current clinical trial supported by the California Institute for Regenerative Medicine, National Institutes of Health (NIH) Cure Sickle Cell Initiative, and NIH’s National Heart, Lung, and Blood Institute.
In 2023, UC’s research expenditure was almost $9 billion, with federal funds the single most important source, accounting for more than half of the total research awards (9.1.1). Among U.S. universities, UC accounts for eight percent of direct federal research expenditures (9.1.4) and UC is the largest recipient of National Institutes of Health and National Science Foundation funding.
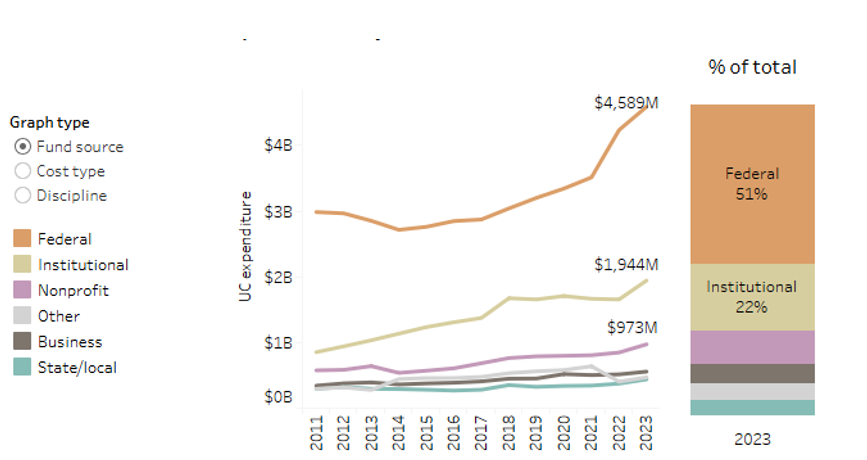
Total research expenditures by fund source, Universitywide, 2011 to 2023 (9.1.1)
Many of California’s leading industries grew from UC research, including biotechnology, computing, semiconductors, telecommunications and agriculture. UC had 1,529 inventions disclosed in fiscal year 2024 – an average of four new inventions every day (9.2.2). Bringing these advances to the marketplace is part of UC’s public service mission. UC inventions take two paths to the marketplace: they may be licensed to an existing company, or they may become the cornerstone of a new startup company. UC’s patents are commercialized under utility licenses (e.g., processes, machines) and plant licenses (e.g., plant cultivars). Every year since 2013, UC has topped the National Academy of Investors’ list of universities worldwide with the most U.S. utility patents.
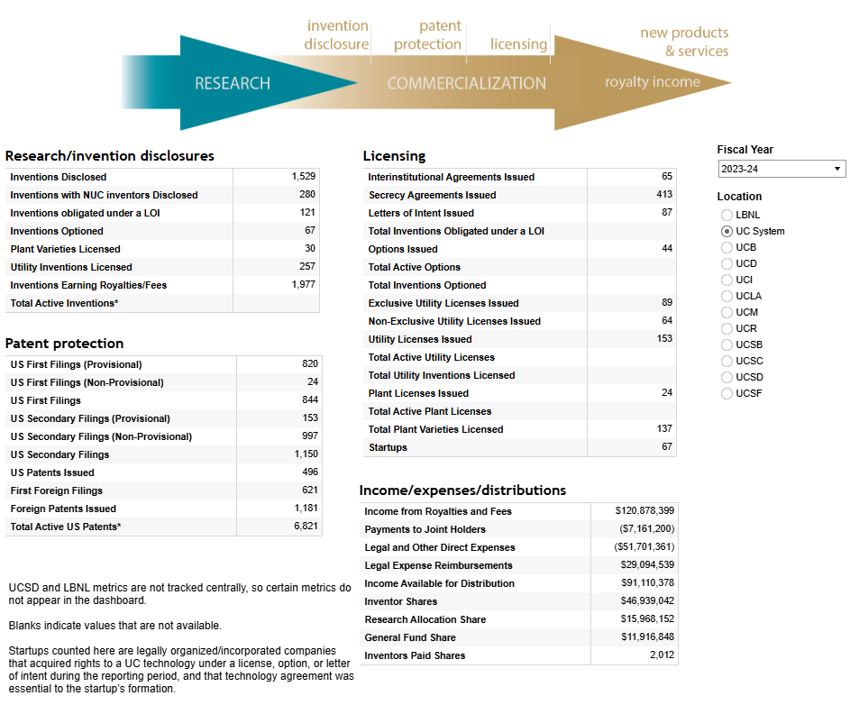
Licenses, research/invention disclosures, and patent protection (9.2.2)
One example of the many inventions developed by UC researchers in recent years is a sturdy metal box that floats just below the ocean surface, housing generators that turn the wave’s motion into usable electricity, just like a breeze turning a windmill. Prior to this invention, there was almost nothing being done to harness the constant churn of waves along California’s 850-mile coastline to generate renewable energy. With the help of UC CITRIS Foundry and Berkeley Lab’s Cyclotron Road, this research turned into a startup called CalWave. Today the company is building wave energy converters and offering their solution for a commercial pilot to the Mowachaht/Muchalaht First Nation in British Columbia, Canada.
UC faculty are the driving force behind UC’s research enterprise, leading efforts to understand and address today’s challenges and introduce new knowledge and research practices into the lab and classroom. As such, one of the University’s goals is investing in the next generation of UC faculty. To fulfill this, UC is working towards growing its faculty by 1,100 between 2018 and 2030. UC added 580 new faculty by October 2024 and is on track to meet this goal. (5.3.4).
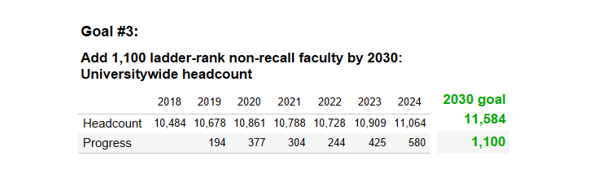
UC ladder-rank faculty headcount, excluding recall faculty*, Universitywide, October 2018 to 2024 (5.3.4)
UC Health – revolutionizing care for families
UC has been helping meet California’s need for health care providers since 1873, when the Toland Medical College became the University’s first professional school. Today, the University is home to one of the nation’s largest academic health care system, comprising 21 health professional schools, six academic health centers, five comprehensive cancer centers, a systemwide Global Health Initiative, and thousands of clinics. Roughly 11 million people received outpatient care from UC in 2024, and UC-trained doctors and other providers are found across California, delivering care to families in our cities, rural areas and underserved communities.
UC’s health professional education and training programs are a vital source of the state’s health care providers, producing future dentists, nurses, optometrists, pharmacists, physicians, public health professionals and veterinarians. Specifically, UC trains more than 16,000 health care professionals annually (11.1.1). In the field of medicine, UC trains about 36 percent of all doctors in the state, with over 70 percent remaining in California to practice medicine, contributing to California having the highest physician retention rate in the nation.
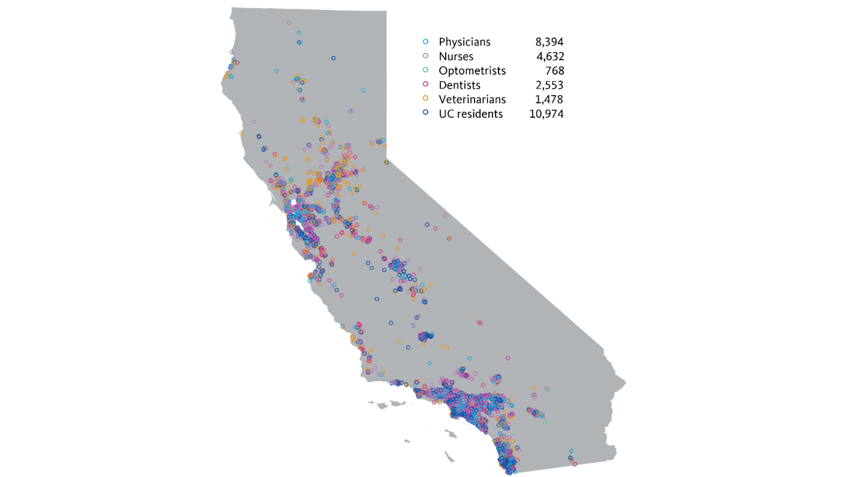
Location of 28,799 physicians, nurses, optometrists, dentists, veterinarians, and UC medical residents trained by UC since 1999 and currently licensed in California, 2023 (11.1.2)
UC is also one of California’s largest Medicaid providers. Nearly three quarters of the patients in UC hospitals on any given day have coverage through Medicare or Medi-Cal (11.3.2). In fiscal year 2023, UC academic health centers provided $1.3 billion in unreimbursed care to Medi-Cal enrollees. UC’s academic health centers provided an additional $2.4 billion in uncompensated care for people with Medicare coverage in fiscal year 2023, a 38 percent increase since 2019.
UC Programs in Medical Education (PRIME) exist at all UC medical schools, providing an innovative training curriculum focused on addressing California’s physician shortage and meeting the needs of historically underserved communities. Approximately 84 percent of UC PRIME students across the 10 programs are from groups underrepresented in medicine, and many are first-generation college students.
The National Institutes of Health (NIH), the main federal agency for medical research, provides about $8 billion in cancer science funding annually in the U.S, with UC as the nation’s leader in NIH-funded research. Robust government funding for cancer research has helped drive down cancer deaths by 33 percent since 1991. This investment has delivered enormous returns: millions of lives saved, not to mention $69 billion in annual economic activity and seven million jobs. Researchers at every UC campus and its five comprehensive cancer centers contribute to these returns.
The annual UC Accountability Report provides a comprehensive assessment of the University’s progress in meeting its mission of teaching, research, health care and public service. The report also serves as a critical tool for understanding the challenges facing the University and for guiding strategic planning, budgeting, and performance management. While this year’s report highlights the progress that the University has made in meeting its key goals, actions by the federal government to significantly reduce federal funding for research and student aid will impact UC’s future progress.
Uncertainty about current federal grants that have been cancelled or delayed, along with the specter of approved cuts to federal student aid, deep proposed cuts to federal science agencies that fund UC research, and new restrictions on Medicaid would detrimentally affect the University’s ability to serve Californians and support the state’s economy. Furthermore, these actions will threaten advances in AI, Quantum computing, and cybersecurity efforts that will affect national security and competitiveness.
As the University navigates these challenges in the coming year, UC will track the impact to UC students, faculty, and staff, along with UC’s efforts to serve the people of California and partner with State and federal policymakers to strengthen and grow California and the nation’s economy while continuing to be a worldclass leader in education, research and healthcare.
In support of its transparency efforts, the University of California produces the UC Accountability Report, along with the UC Information Center, with detail on University operations, including progress on strategic goals, areas of strength, and opportunities for improvement.
Appendix 1 of this report provides a screenshot of the UC 2030 dashboard, which tracks progress for the UC system and campuses on UC 2030 goals. Attachment 2 provides a full list of indicators included within the Accountability Report spanning all UC operations, which provide additional context and can be downloaded to support other use or analyses.
APPENDIX 1 | UC 2030 DASHBOARD
The UC 2030 dashboard highlights key goals and detail on progress to achieve UC 2030 goals.
Links to the Table of Contents where indicator titles are linked to the indicators.