Chapter 2:
UNDERGRADUATE STUDENTS: AFFORDABILITY
Goals
The goal of the University’s undergraduate financial aid program is to ensure that the University remains accessible to all academically eligible California students, regardless of their financial resources. Affordability is among UC’s highest priorities, and the University has maintained a strong record of enabling families from all income levels to finance a high-quality education. The University achieves this through a financial aid program that considers how much parents can afford; federal, state, and University grants; and a manageable student “self-help” contribution from work or borrowing. The University closely monitors the impact of its tuition policies and financial aid programs through the key indicators detailed in this report to ensure financial accessibility and affordability.
In fall 2022, the University established the tuition stability plan that ensured tuition for incoming undergraduates would remain flat until they graduate (i.e., up to six years). The plan not only helped students and parents budget for a UC education by keeping tuition stable and predictable, it also provided new resource for financial aid.
The Free Application for Federal Student Aid (FAFSA) saw dramatic change in 2024–25, resulting in delays in producing financial aid offers and in financial aid disbursements. Changes to the federal needs-analysis formula expanded eligibility for federal student aid and resulted in an estimated nine percent increase in the number of Federal Pell Grant recipients. The University continued its Path to Debt-free UC program to all new California residents who had the lowest assessed ability to pay, making it possible for students to meet their educational costs through part-time work if they prefer not to borrow. The state Middle Class Scholarship (MCS) Program saw a significant funding increase in 2023-24, further helping low- and middle-income students reduce their borrowing. This chapter provides key indicators of UC’s success in ensuring access to and the affordability of a UC education.
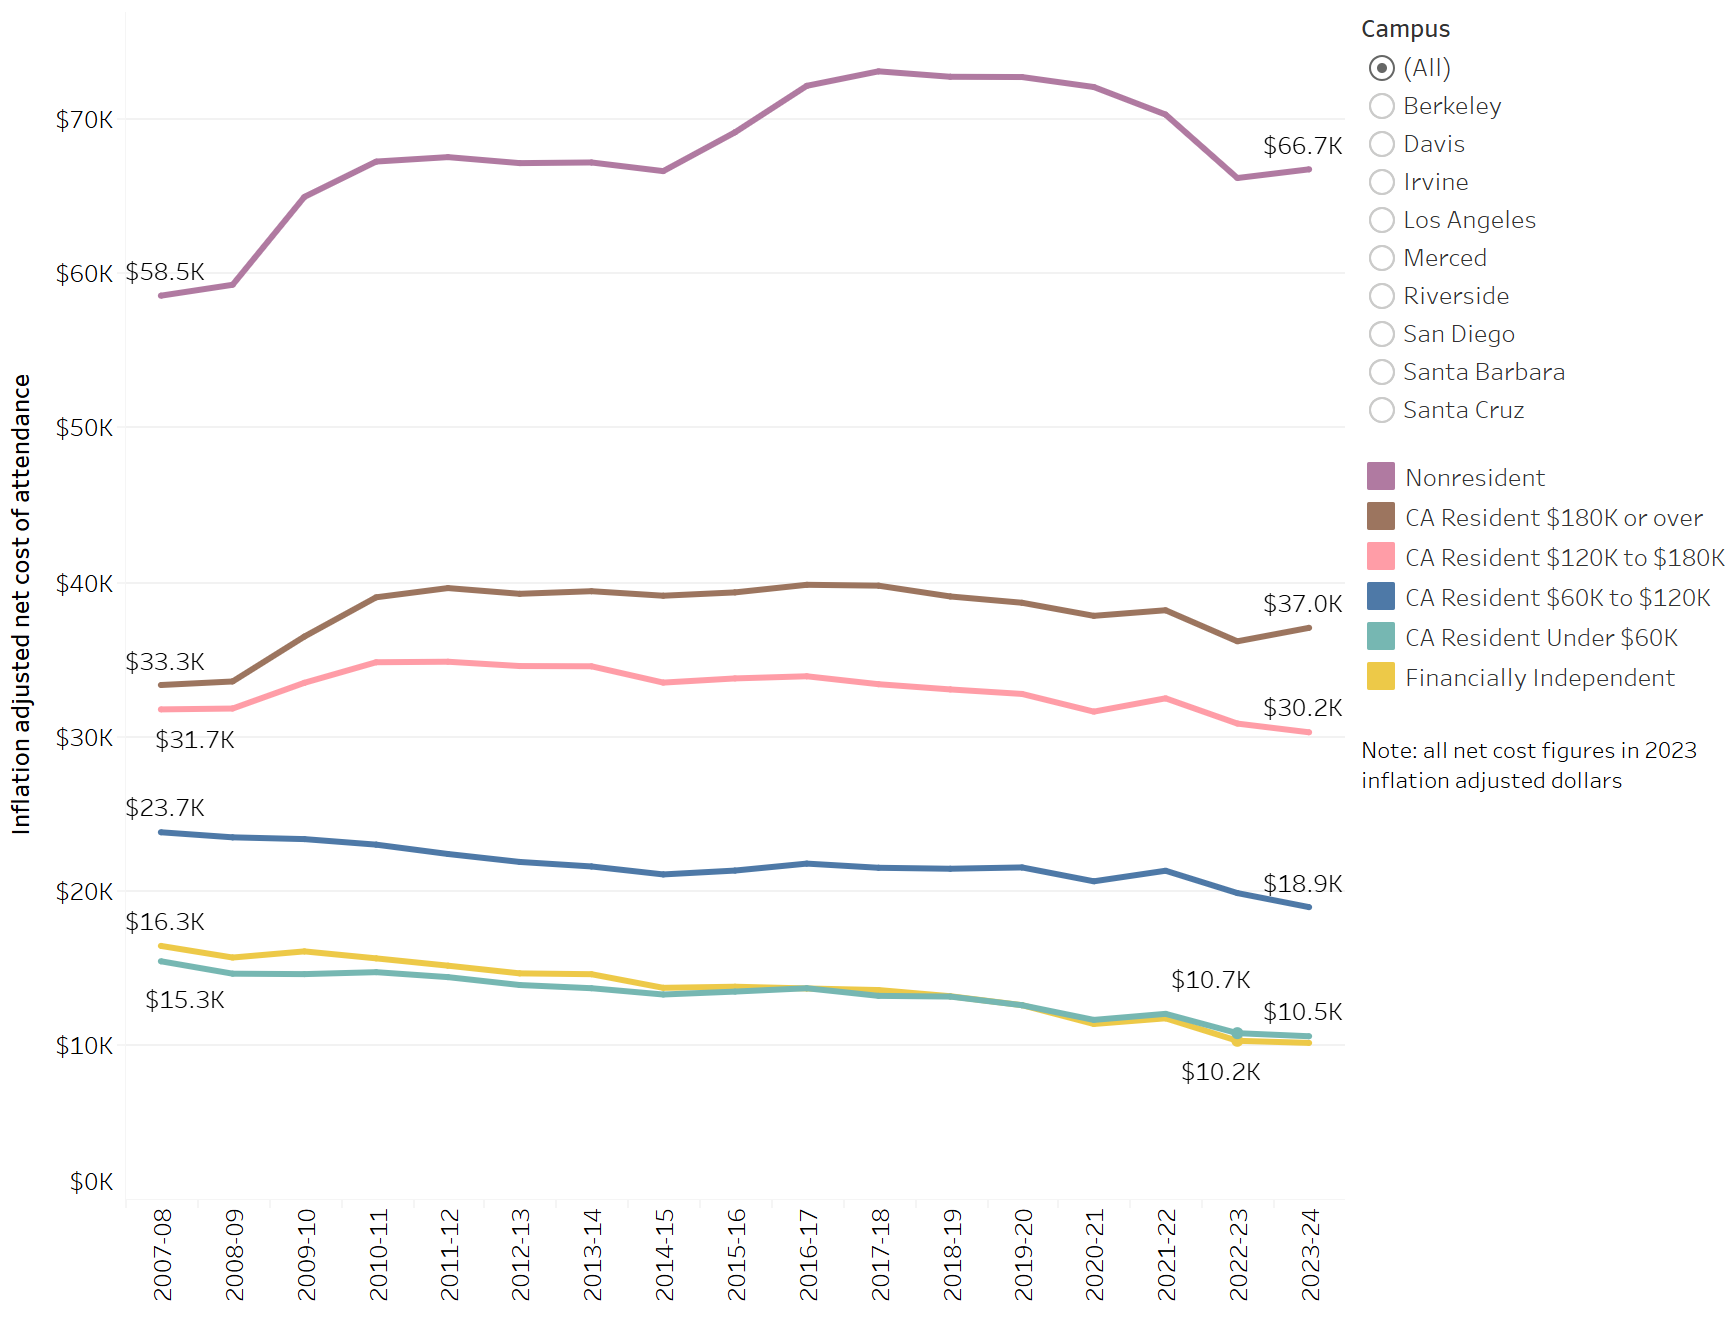
The net cost of attendance for California resident students has remained stable overall and declined for low-income students in inflation-adjusted dollars. Nonresident students face a higher net cost of attendance due to supplemental tuition charges.
2.1.1 Net cost of attendance by family income and California residency, Universitywide, 2023 inflation-adjusted dollars, 2007–08 to 2023–24

Undergraduate affordability dashboard
Source: UC Corporate Student System
Net cost of attendance represents the total cost of attendance at the University for undergraduates after considering scholarships and grants. California residents, especially those from the lowest-income backgrounds, have seen their net cost of attendance remain flat or decline since 2010–11. Nonresident students have also seen a stable net cost of attendance in recent years although their net cost is much higher due to supplemental tuition charges and their ineligibility to receive institutional need-based aid. Tuition charges for out-of-state students stand to rise even further with recent action by the UC Regents that approved nonresident tuition increases of nearly ten percent in Fall 2025. This will raise the sticker price to over $50,000 for entering nonresident students.
Income ranges are approximate. Independent students are excluded. Net cost is the full cost of attendance less any grants, scholarships, and fee exemptions. Income is based on amounts reported in either the Free Application for Federal Student Aid (FAFSA) or the UC Application for Undergraduate Admission, or, if missing, is imputed based on demographic profiles.
Thirty-three percent of UC undergraduates are Pell Grant recipients, a higher percentage than the non-UC Association of American Universities (AAU) public or AAU private peer average at 21 and 17 percent, respectively.
2.2.1 Undergraduate Pell Grant recipients, UC and comparison institutions, 2022–23
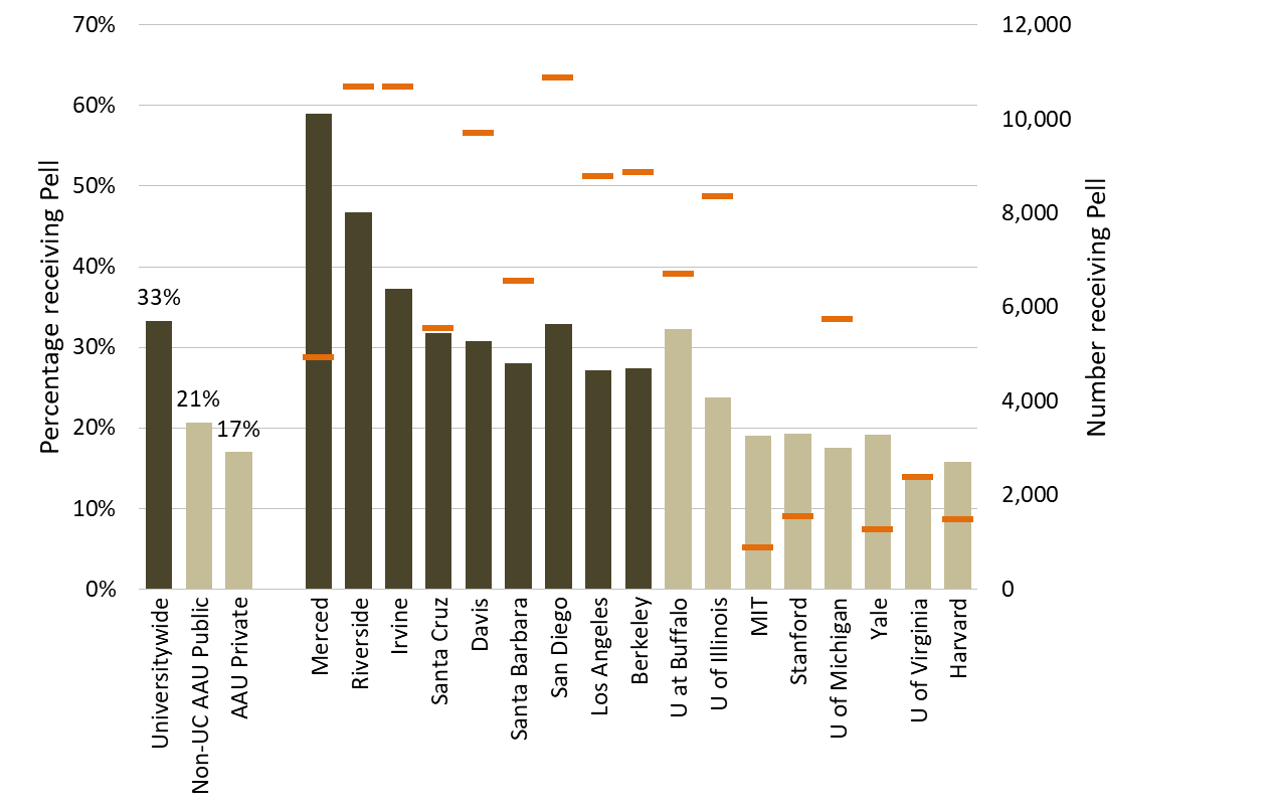
Source: IPEDS
UC campuses enroll a significantly higher percentage of undergraduate students with Pell Grants, a federal aid program for low-income students, than their public or private peer institutions. By fall 2024, 36 percent of UC undergraduates and 42 percent of California Residents received Pell Grants.
Percentage reported is that of students who received Pell Grants at any time during the 2022-23 year as a percentage of all undergraduates.
Note that Pell Grant eligibility criteria change annually because of the federal appropriations process and other formula changes. Thus, trend analysis of Pell recipients would not be a valid measure of changes in low-income students but rather would reflect the changes in eligibilitycriteria. A list of the institutions in the AAU comparison groups can be found in the data glossary.
About 28 percent of all UC students, and 31 percent of in-state students, come from low-income families.
2.2.2 Undergraduate income distribution, Universitywide, 2023 inflation-adjusted dollars
Undergraduate affordability dashboard California residents
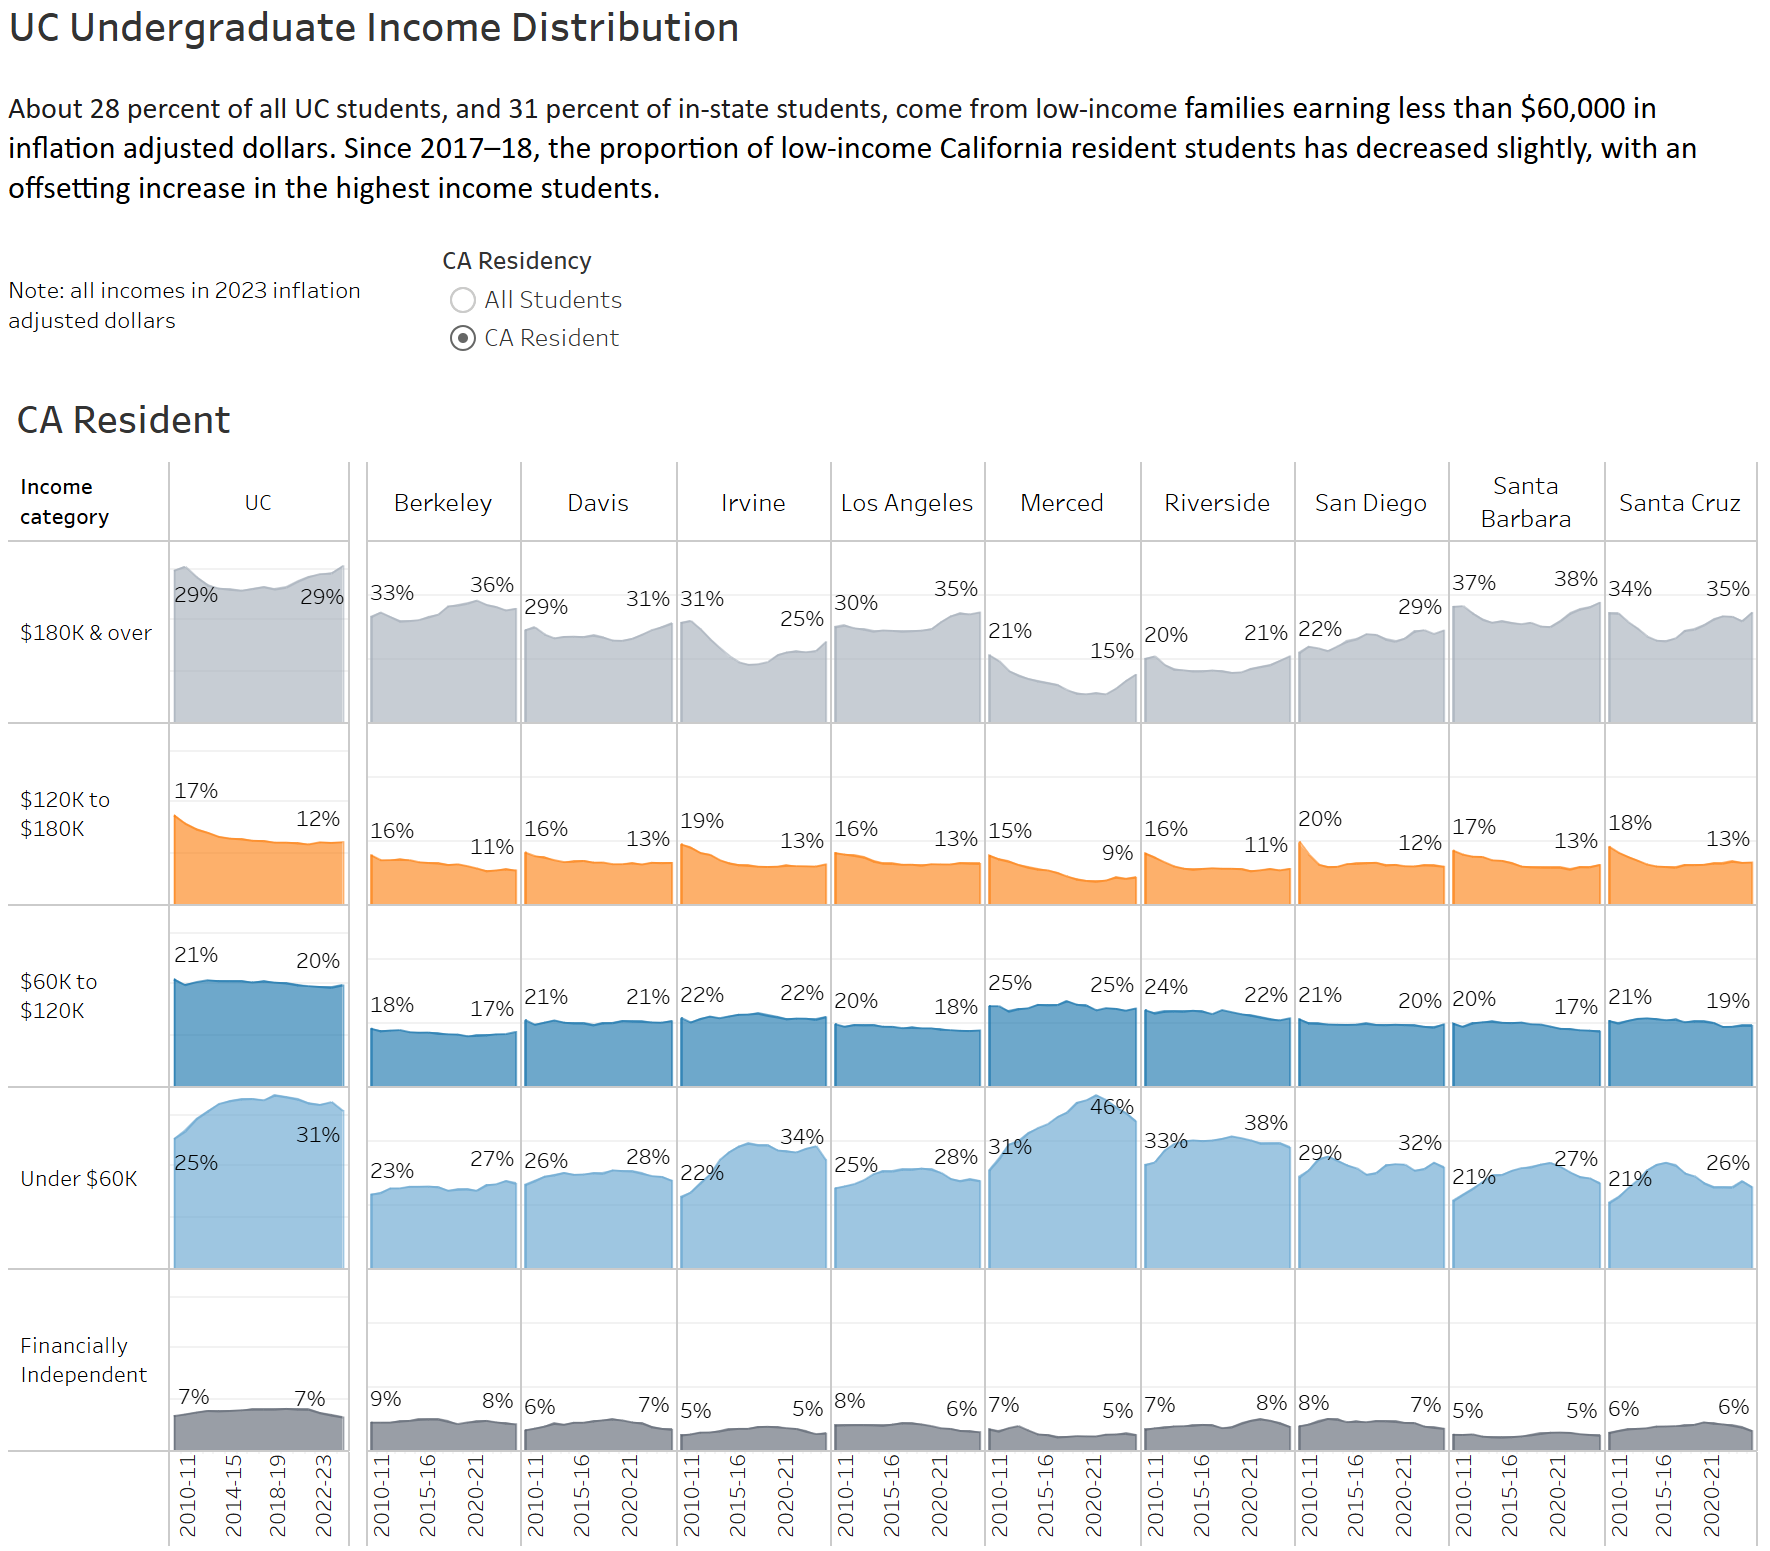
Undergraduate affordability dashboard All students
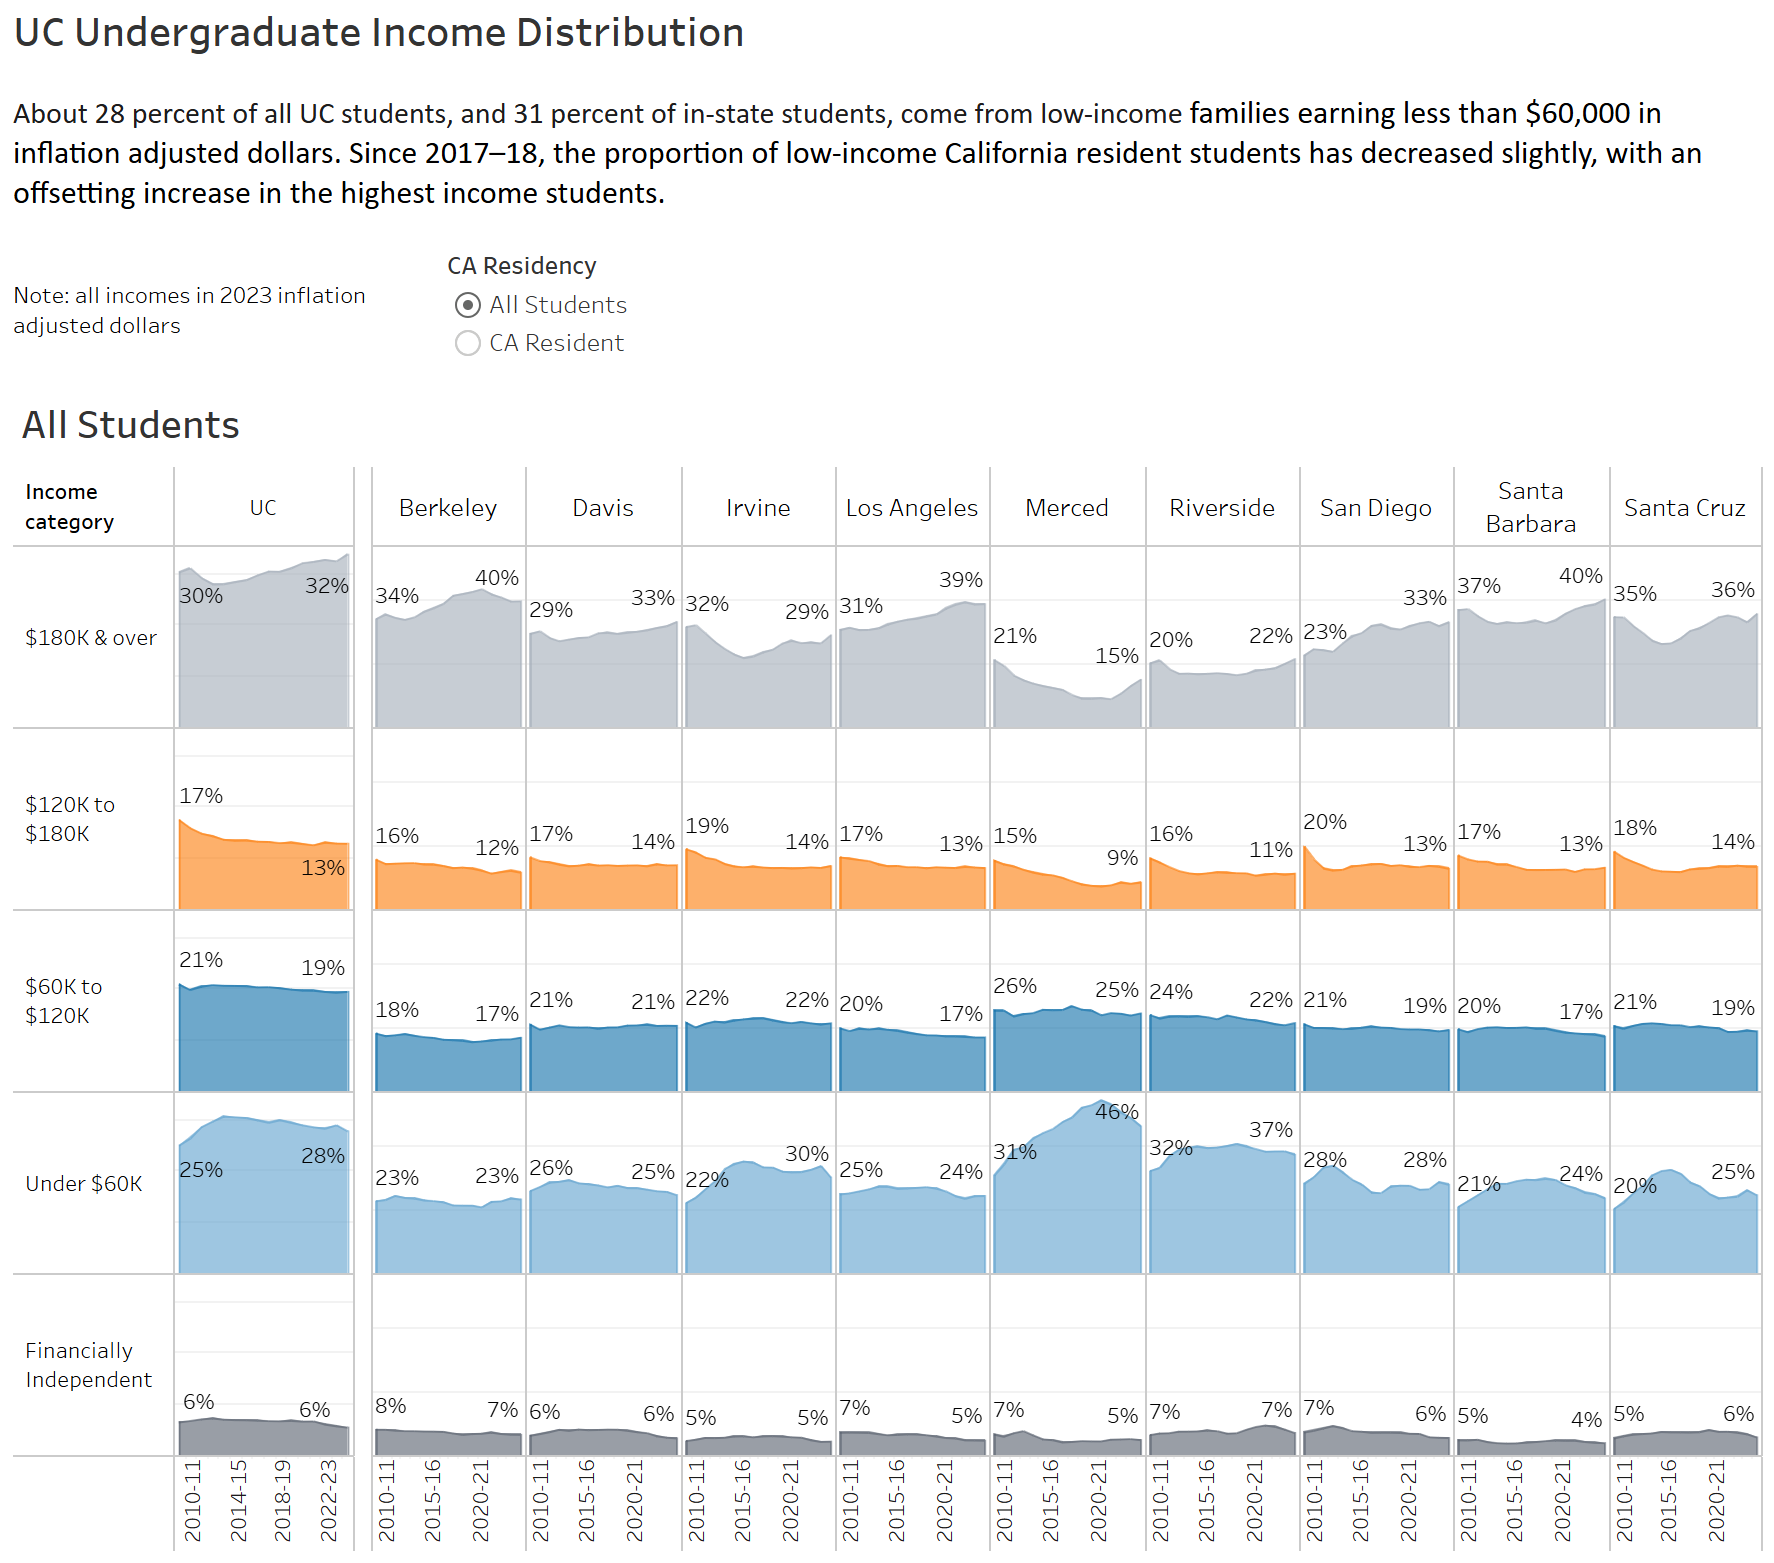
Source: UC Corporate Student System
In-state students are more likely to come from low-income families, with over 30 percent in families earning less than $60,000 in inflation adjusted dollars since 2010-11. Since 2017–18, the proportion of low-income California resident students has decreased slightly, with an offsetting increase in the highest income students.
Both the proportion of students graduating with debt and the average amount of debt they have at graduation have declined steadily across all income groups over the past seven years.
2.3.1 Student loan debt of graduating seniors, inflation-adjusted, Universitywide, 2006–07 to 2023–24 (average debt of those with debt shown above each year)
Undergraduate affordability dashboard
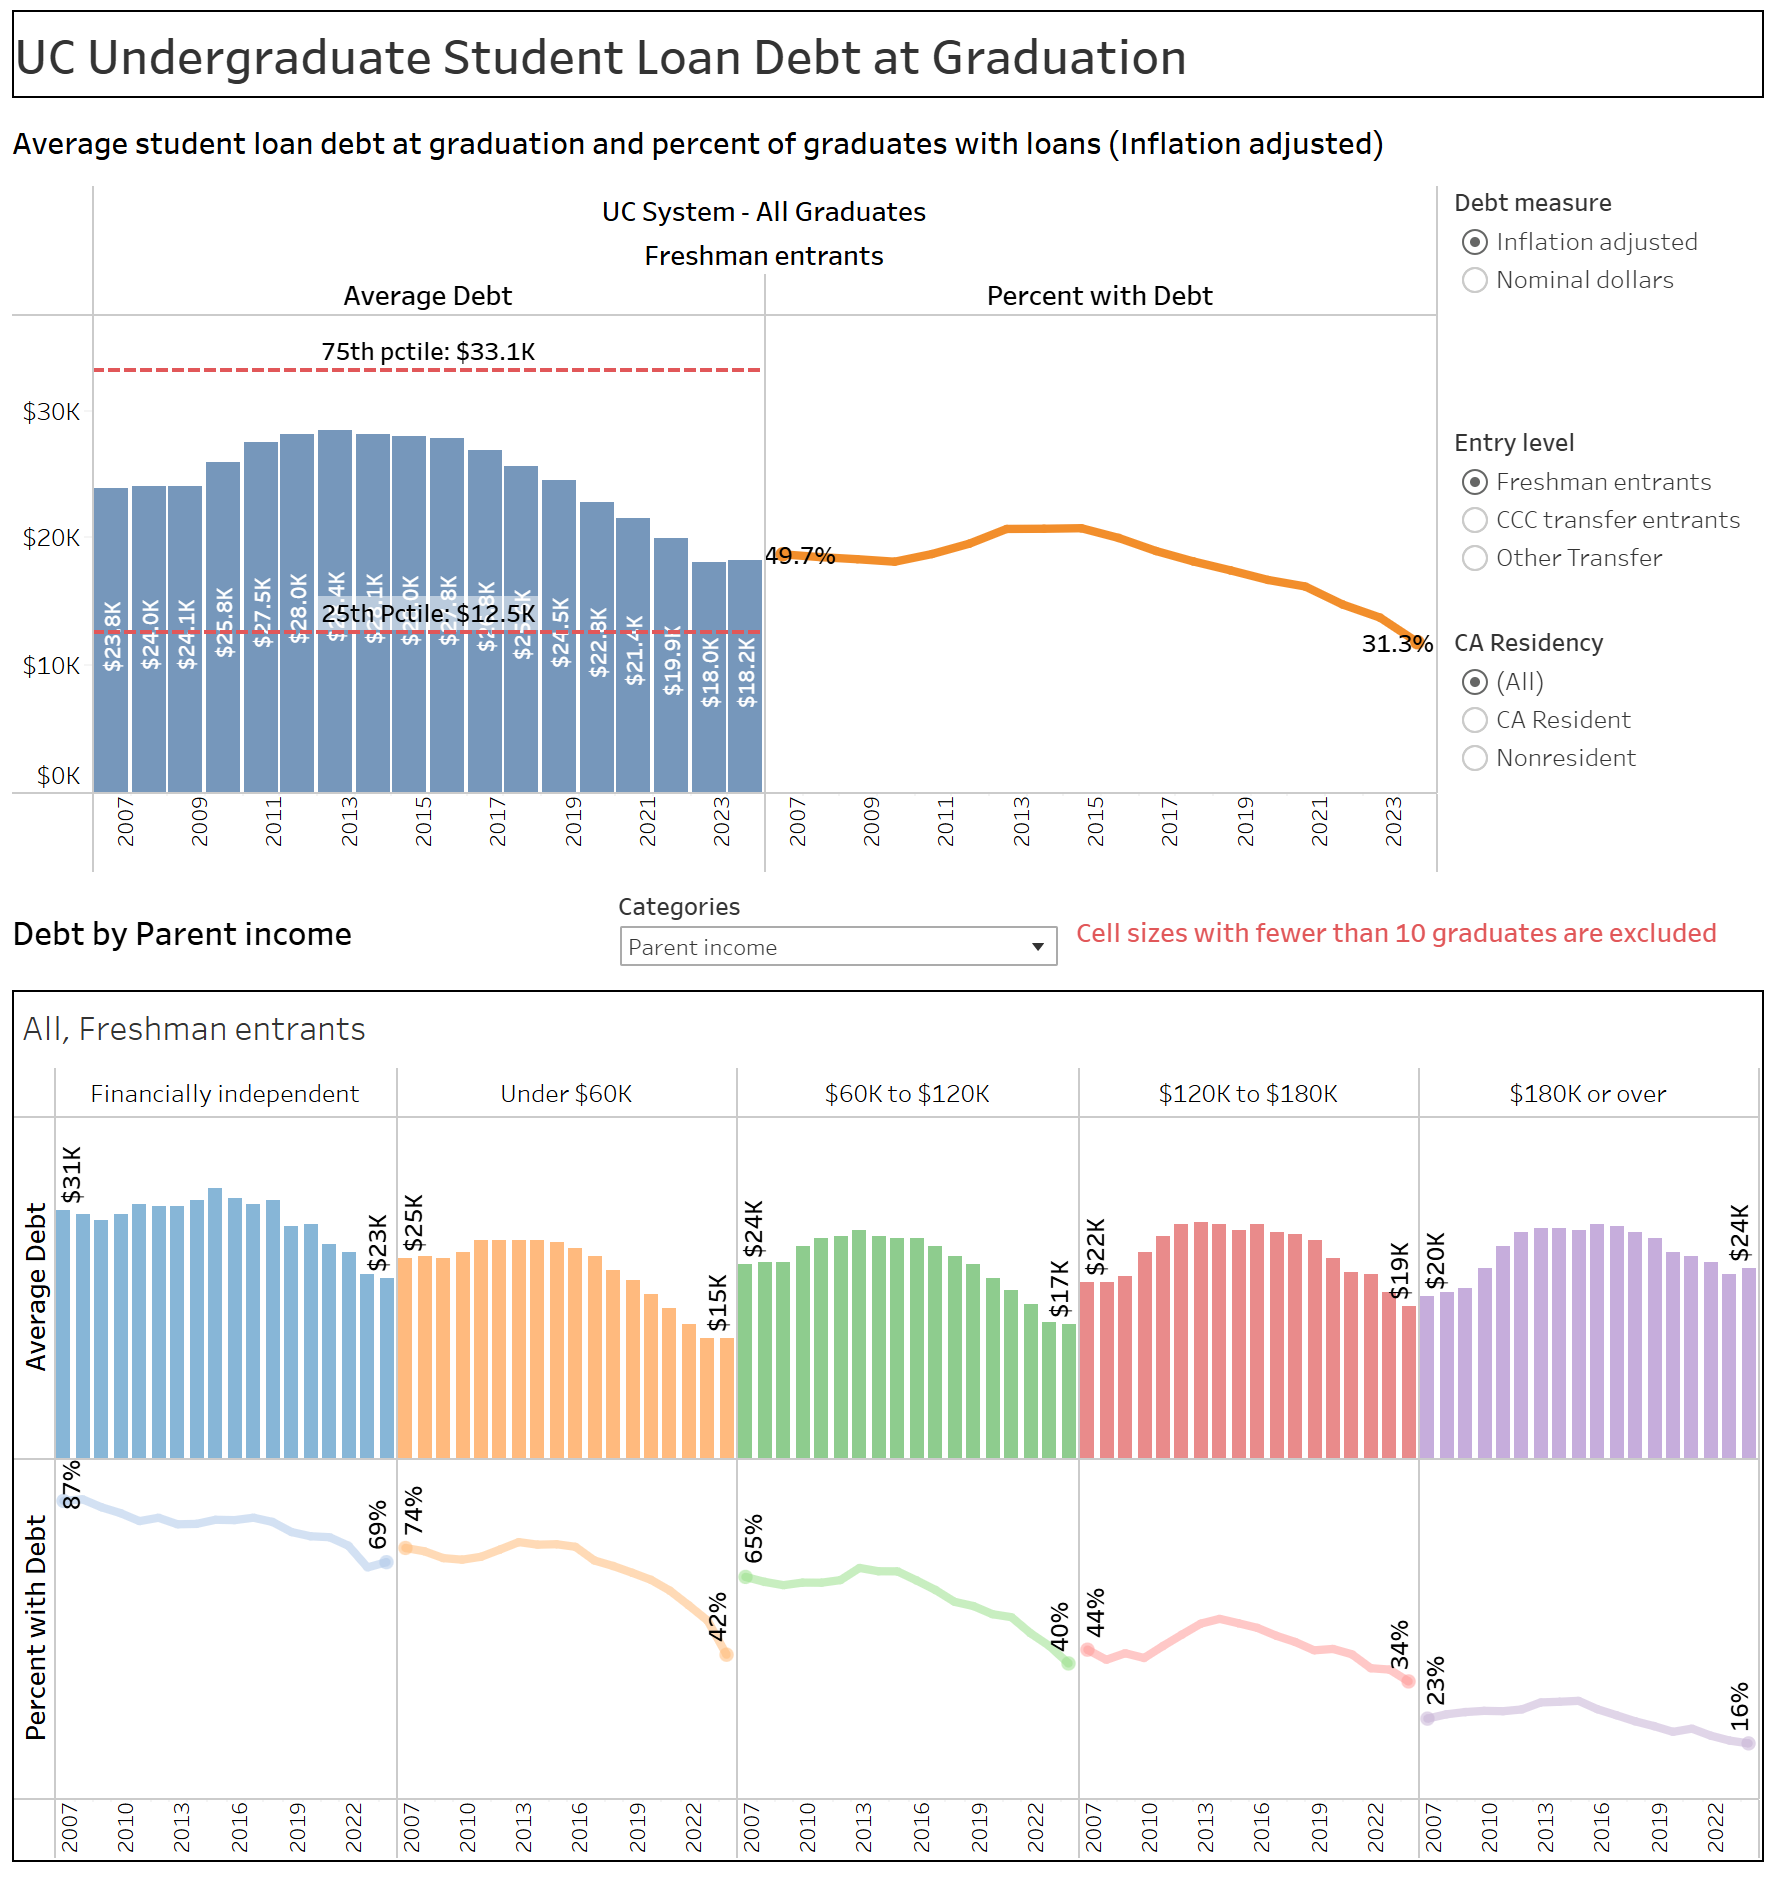
Source: UC Corporate Student System
Sixty-nine percent of UC undergraduates graduate with no student loan debt. For those who do borrow, the average student loan debt at graduation in 2023–24 was about $18,200. California resident students are more likely to graduate with student loan debt, about 36 percent compared to only 13 percent of out-of-state students. In-state graduates’ average debt, however, was significantly lower than that of the out-of-state students who borrowed ($17,200 vs. $30,100).
Student loan debt levels at UC campuses are among the lowest within the Association of American Universities (AAU) public institutions.
2.3.2 Undergraduate debt at graduation, UC and public comparators, UC and public comparison institutions, 2022–23
Undergraduate affordability dashboard
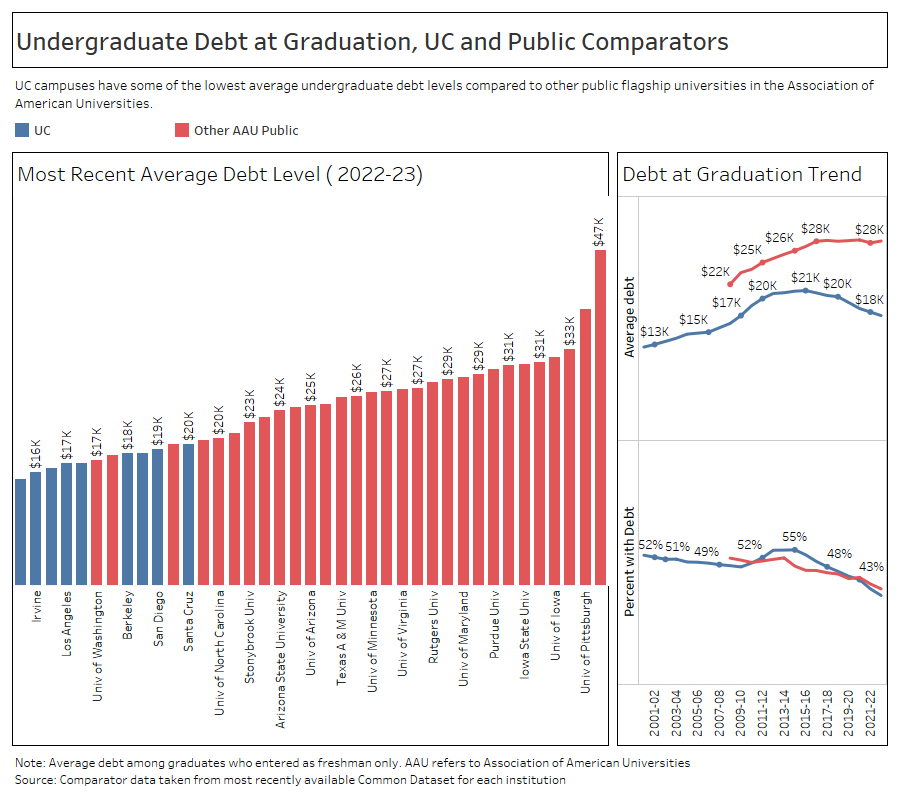
Source: UC Corporate Student System
UC campuses have some of the lowest average undergraduate debt levels compared to other public flagship universities in the AAU. The average debt among public AAU comparators was $28,000 in the most recent year compared to $18,000 at UC.
By five years after graduation, over 90 percent of students have manageable debt-to-earnings ratios of less than ten percent.
2.3.3 Percent of UC undergraduate alumni with manageable debt-to-earnings ratios (below ten percent) at two and five years after graduation by degree major, Universitywide and by campus, Undergraduate graduating cohorts 2000–2020 who are working in California
Undergraduate affordability dashboard
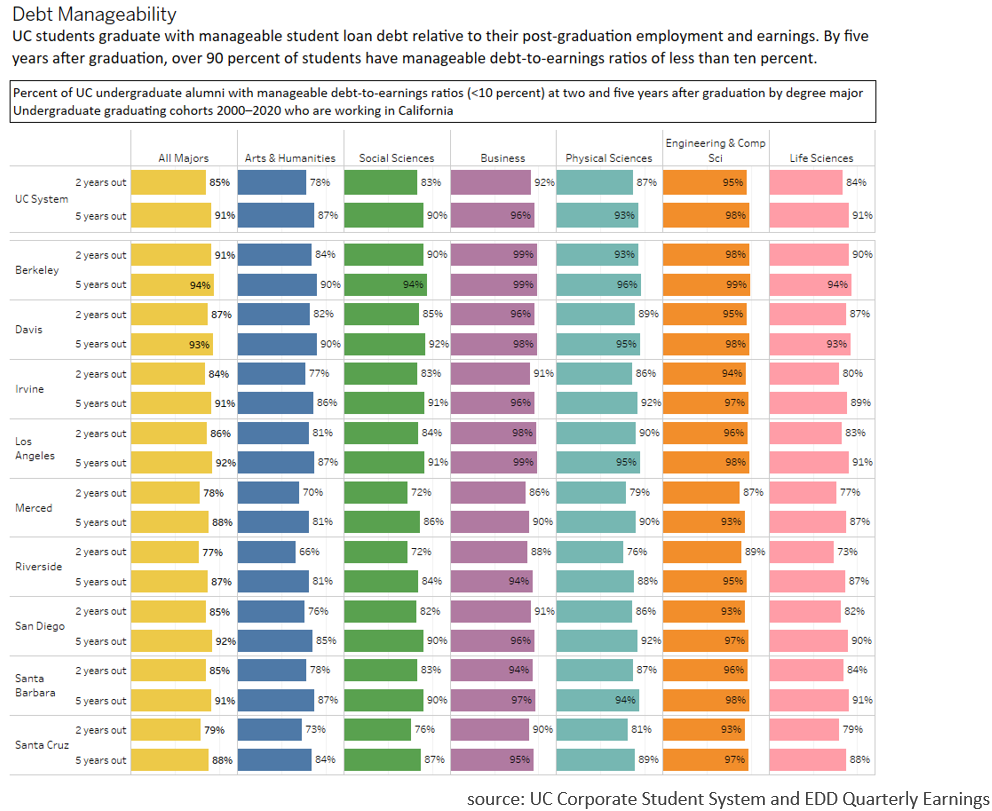
Source: UC Corporate Student System and EDD quarterly earnings
The primary benchmark used to evaluate debt manageability is the percentage of average earnings required to repay a student’s debt at graduation based upon a standard ten-year repayment plan. UC considers debt that requires between five percent and nine percent of a student’s postgraduate earnings to be manageable. About 85 percent of UC baccalaureate recipients systemwide have a debt-to-earnings ratio of below ten percent at two years after graduation and over 90 percent do at five years after graduation. Graduates in arts, humanities, and social science programs are somewhat more likely to have debt ratios more than ten percent at two and five years after graduation.
For more information
UC costs and financial aid, including financial aid estimators (website)
Trends in UC financial aid (website)
Student financial support data tables dashboard with downloadable figures on financial aid awarded by year, campus, and award type
Net cost of attendance dashboard of data tables with downloadable figures on total and net cost of attendance by campus and residency
UC alumni at work dashboard with typical student debt, earnings, percentages of graduates with debt, and debt payoff calculators
The complete UC Information Center Undergraduate affordability subject area
Download data tables for chapter 2 indicators (Excel format)