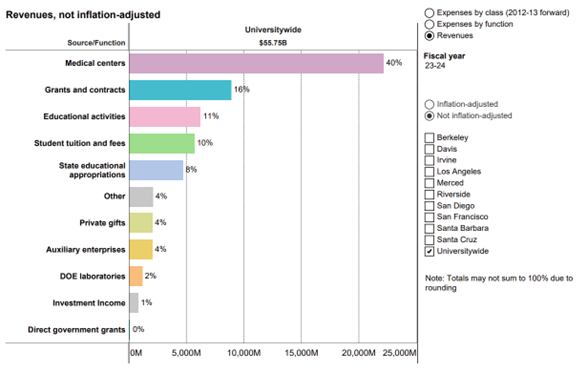
UC revenues primarily cover medical centers, followed by grants and contracts.
12.1.1 Revenues by source, Universitywide, Fiscal year 2023–24
![]()
Revenue and expense data dashboard
source: UC Information Center
Overview
UC requires significant resources and planning to support its instruction, research, and public service missions. This chapter provides insight into the financial health of the University, the state of capital and space resources, and the environmental sustainability of campus operations. This chapter also includes information on the UC Community Safety Plan, which re-envisions safety at University of California locations. Faculty awards have been moved to this chapter as an illustrative measure of the University’s performance.
Finances (12.1)
The University’s operating budget funds its mission of teaching, research, and public service, as well as a wide range of support activities, including teaching hospitals, the Lawrence Berkeley National Laboratory, UC Extension, housing and dining services, libraries, and other functions. State General Funds remain extremely important as they support the University’s core instructional mission and make it possible to attract funds from other sources. Other fund sources augment the University’s core activities of instruction and research; support academic and administrative functions; allow UC to provide public service to the State and its people; and support rich social, cultural, and learning environments on its campuses. Finance indicators provide updates on UC revenues, gift funds, expenditures, and core fund expenditures for instruction.
Capital Projects (12.2)
UC has three broad capital program categories: Campus Education and General, Campus Auxiliary Enterprises, and Medical Centers. In general, Education and General projects do not have a revenue stream, contributing to its capital program having a significant funding shortfall. Auxiliary enterprises have revenue streams, but while still recovering from the substantial financial loss amid COVID-19, the enterprises’ capital program cannot provide enough housing to meet demand. UC medical centers’ capital program has increased to support the continued excellence of UC Health and its public service commitment to improving the health and well-being of all people in California. Capital projects indicators detail UC’s sources of capital funding and spending, capital project types, and increases in space for various uses.
Sustainability (12.3)
The University of California’s formal sustainability commitments began in 2003 with a Regental action that led to the adoption of the Presidential Policy on Green Building Design and Clean Energy Standards in 2004. Since then, UC has expanded the scope of the Sustainable Practices Policy to include climate, transportation, building operations, waste, procurement, food, water, health and well-being, UC Health and sustainability performance, as well as anti-racism, diversity, equity and inclusion. Sustainability indicators provide updates on UC’s progress in reducing greenhouse gas emissions, improving energy efficiency, and increasing LEED® certified green building projects.UC’s progress on sustainability is further detailed in the 2024 Annual Sustainability Report.
Community safety (12.4)
The UC Community Safety Plan re-envisions safety at the University of California locations and calls for transforming UC’s culture, policies, and practices to ensure that all members of the community feel welcomed, respected, and protected from harm. Community Safety indicators provide aggregate figures on the number of UCPD stops, use of force incidents, calls for service, criminal activity reports, and civilian complaints.
External Impact (12.5)
The UC Accountability Report no longer reports on University rankings and the Honors and Rankings chapter (Chapter 13) has been removed. The awards section of that chapter has been retained and moved to Chapter 12 (Institutional Measures) in the interest of shining a light on the multitude of profound contributions UC faculty have contributed to the world’s body of scientific, social science, and humanities knowledge. The 1,778 awards, medals, and honors represented in this section is a fraction of the awards bestowed on UC faculty over the past 150+ years, but as the most recognizable, they are illustrative proof of the fulfillment of UC’s mission. It should be noted that University researchers, students, and staff have received innumerable awards and are integral part of research, teaching, and public service mission of the University. This section also includes information on the critical role UC plays in bolstering California’s economy according to a 2021 report—The University of California: Systemwide economic, fiscal, and social impact analysis.
UC revenues primarily cover medical centers, followed by grants and contracts.
12.1.1 Revenues by source, Universitywide, Fiscal year 2023–24
![]()
Revenue and expense data dashboard
source: UC Information Center
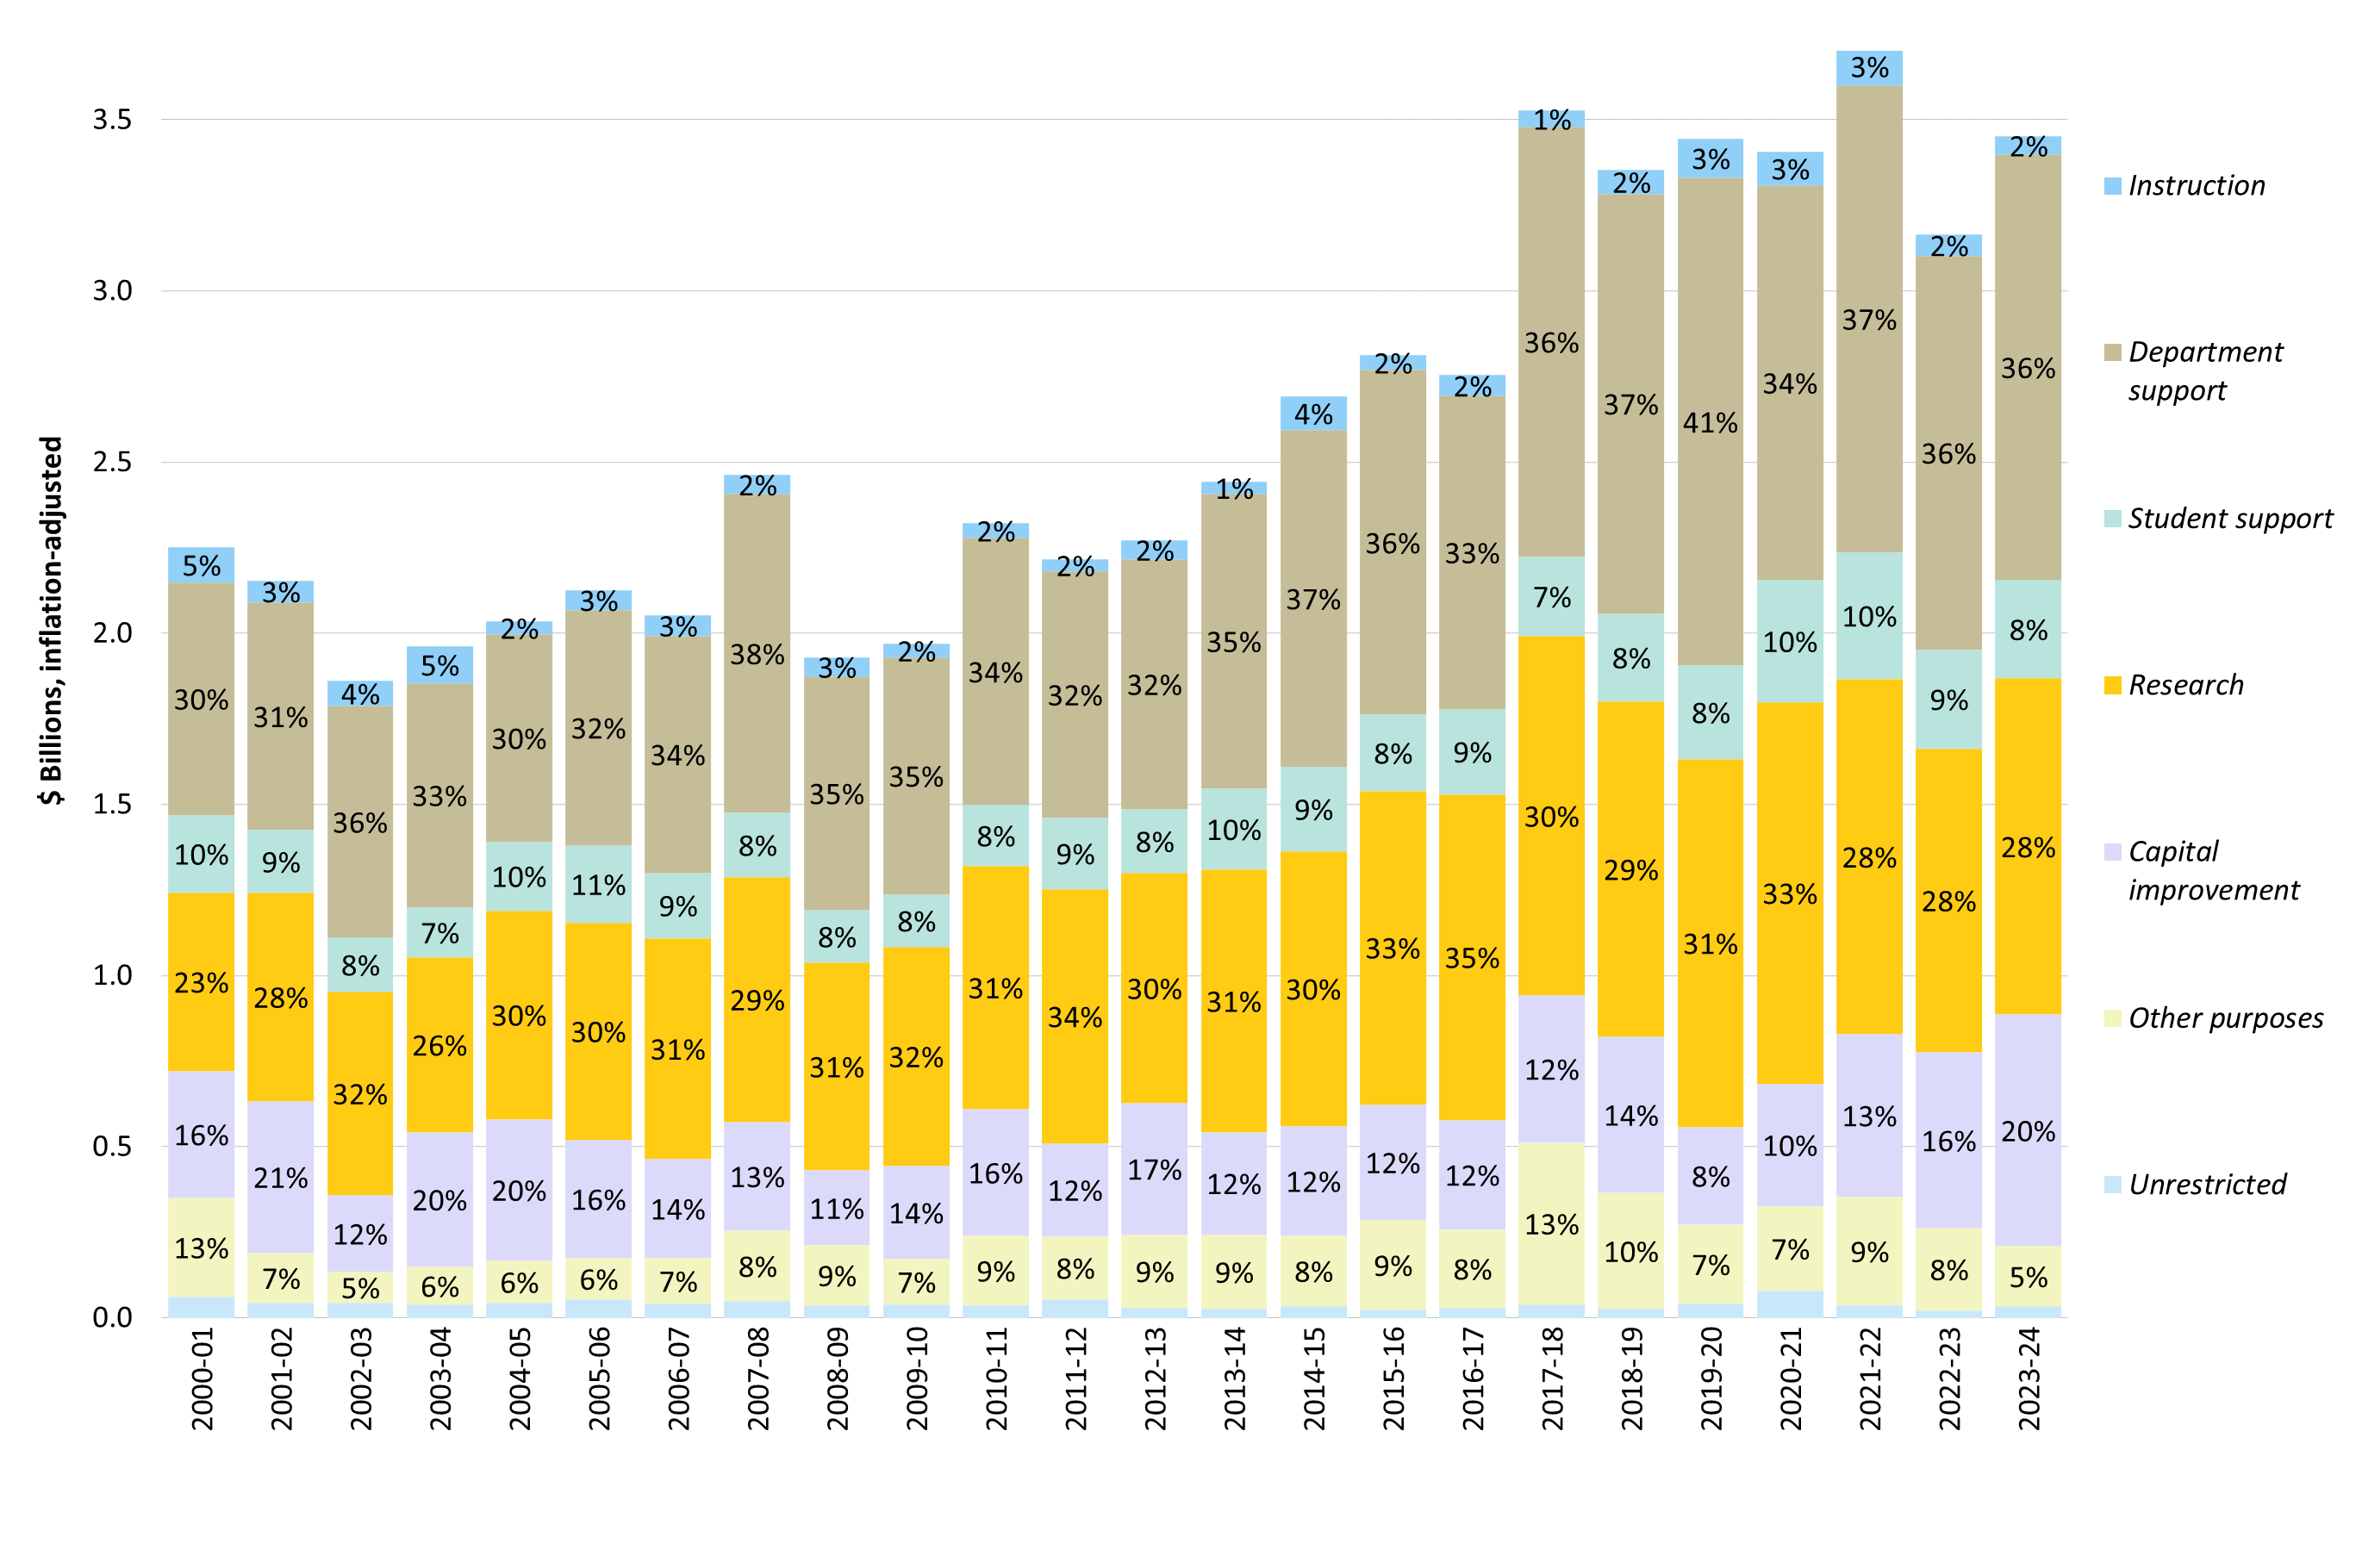
Of the $3.5 billion in gift funds, 99 percent are restricted by donors in how they may be used.
12.1.2 Current giving by purpose, Universitywide, 2000–01 to 2023–24
source: UC Institutional Advancement
Gift funds have become increasingly important to the University as a means to help address budget shortfalls and expand student financial aid. In 2023-24, new gifts to the University totaled nearly $3.5 billion. However, virtually all of these funds are restricted for specific purposes and are not available to support general operating costs. In addition, $651 million was designated for endowment, where only the income/payout is available for expenditure.
Private giving varies significantly by campus and relates to the campus’ age, number of alumni, and the presence of health science programs.
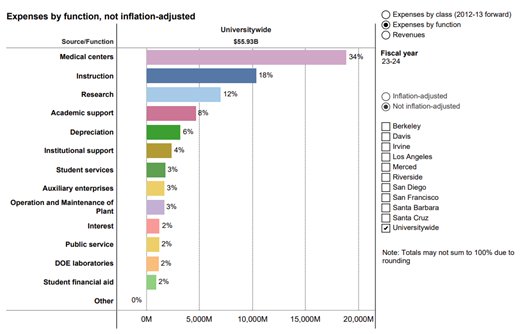
Medical centers are the largest single functional expense, and their share has grown over the last two decades.
12.1.3 Expenditures by function and class, Universitywide, Fiscal year 2023–-24
![]()
Revenue and expense data dashboard
Revenue and expense data dashboard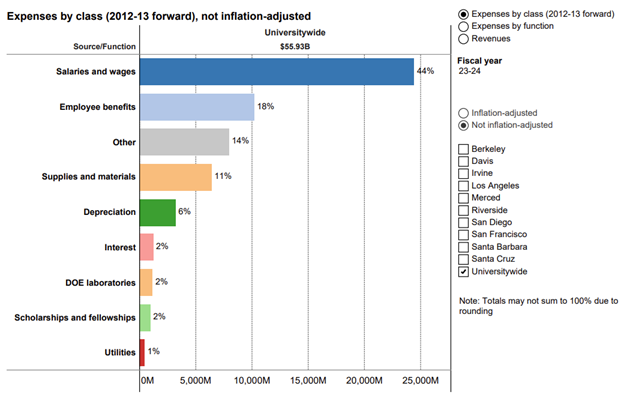
Average instructional expenditures per UC student declined from $26,130 per student in 2027-18 to $22,750 in 2023-2024.
12.1.4 Average general campus core fund expenditures for instruction per student, 2010–11 to 2023–24
![]()
University of California Budget for Current Operations 2025-26 report | page 19
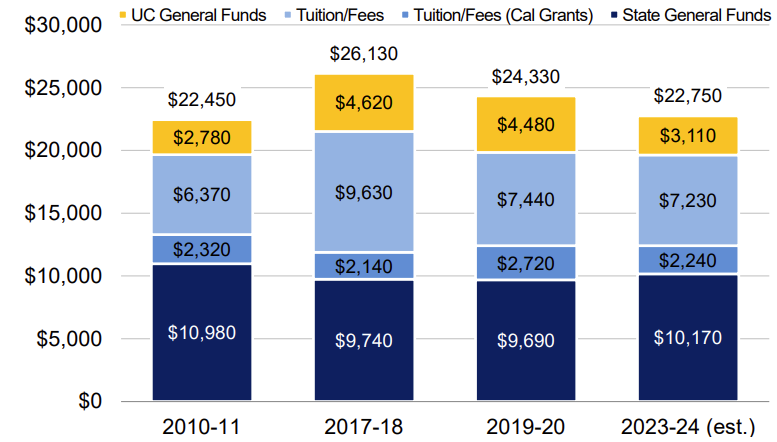
source: UC Budget Office
Note: These statistics are presented on page 19 of the University of California Budget for Current Operations report.
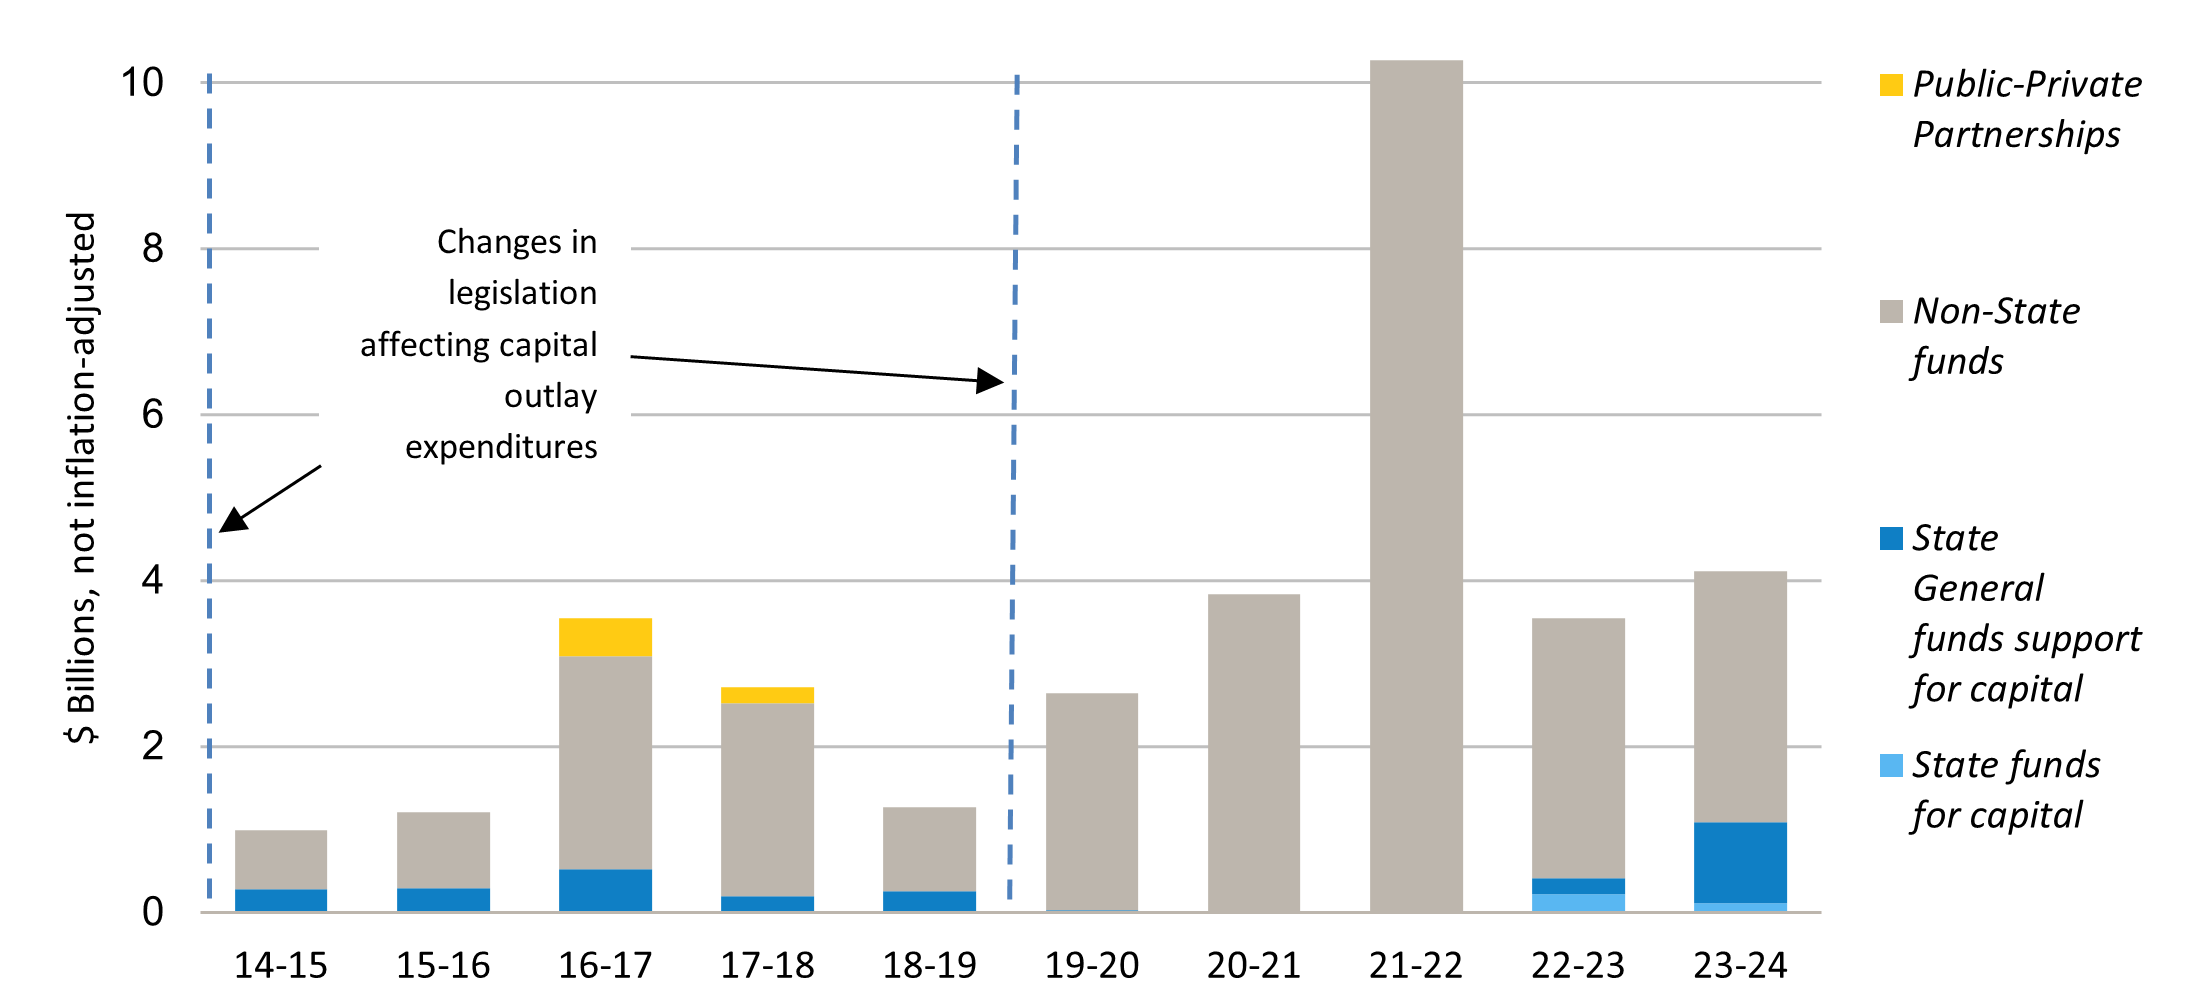
12.2.1 Sources of capital project funding by year of approval, Universitywide, 2014–15 to 2023–24
source: UC Capital Asset Strategies
The University’s capital program is driven by the campuses’ and medical centers’ strategic plans. UC’s capital program is funded by a combination of State and non-State funds, with non-State sources funding most of UC’s State-eligible capital needs and all self-supporting enterprises, such as housing, parking, athletics, and medical centers. To the extent that non-State funds are used to support core academic capital needs, less funding is available to support other high-priority needs such as deferred maintenance, seismic, and enrollment growth.
Note: In 2013-14, changes to the California Education Code allowed UC to direct a portion of its existing State operating funds support to capital.
The 2023–24 capital project program is heavily supported by external financing.
12.2.2 Sources of capital project spending detail, Universitywide, Project budgets approved in 2023–24
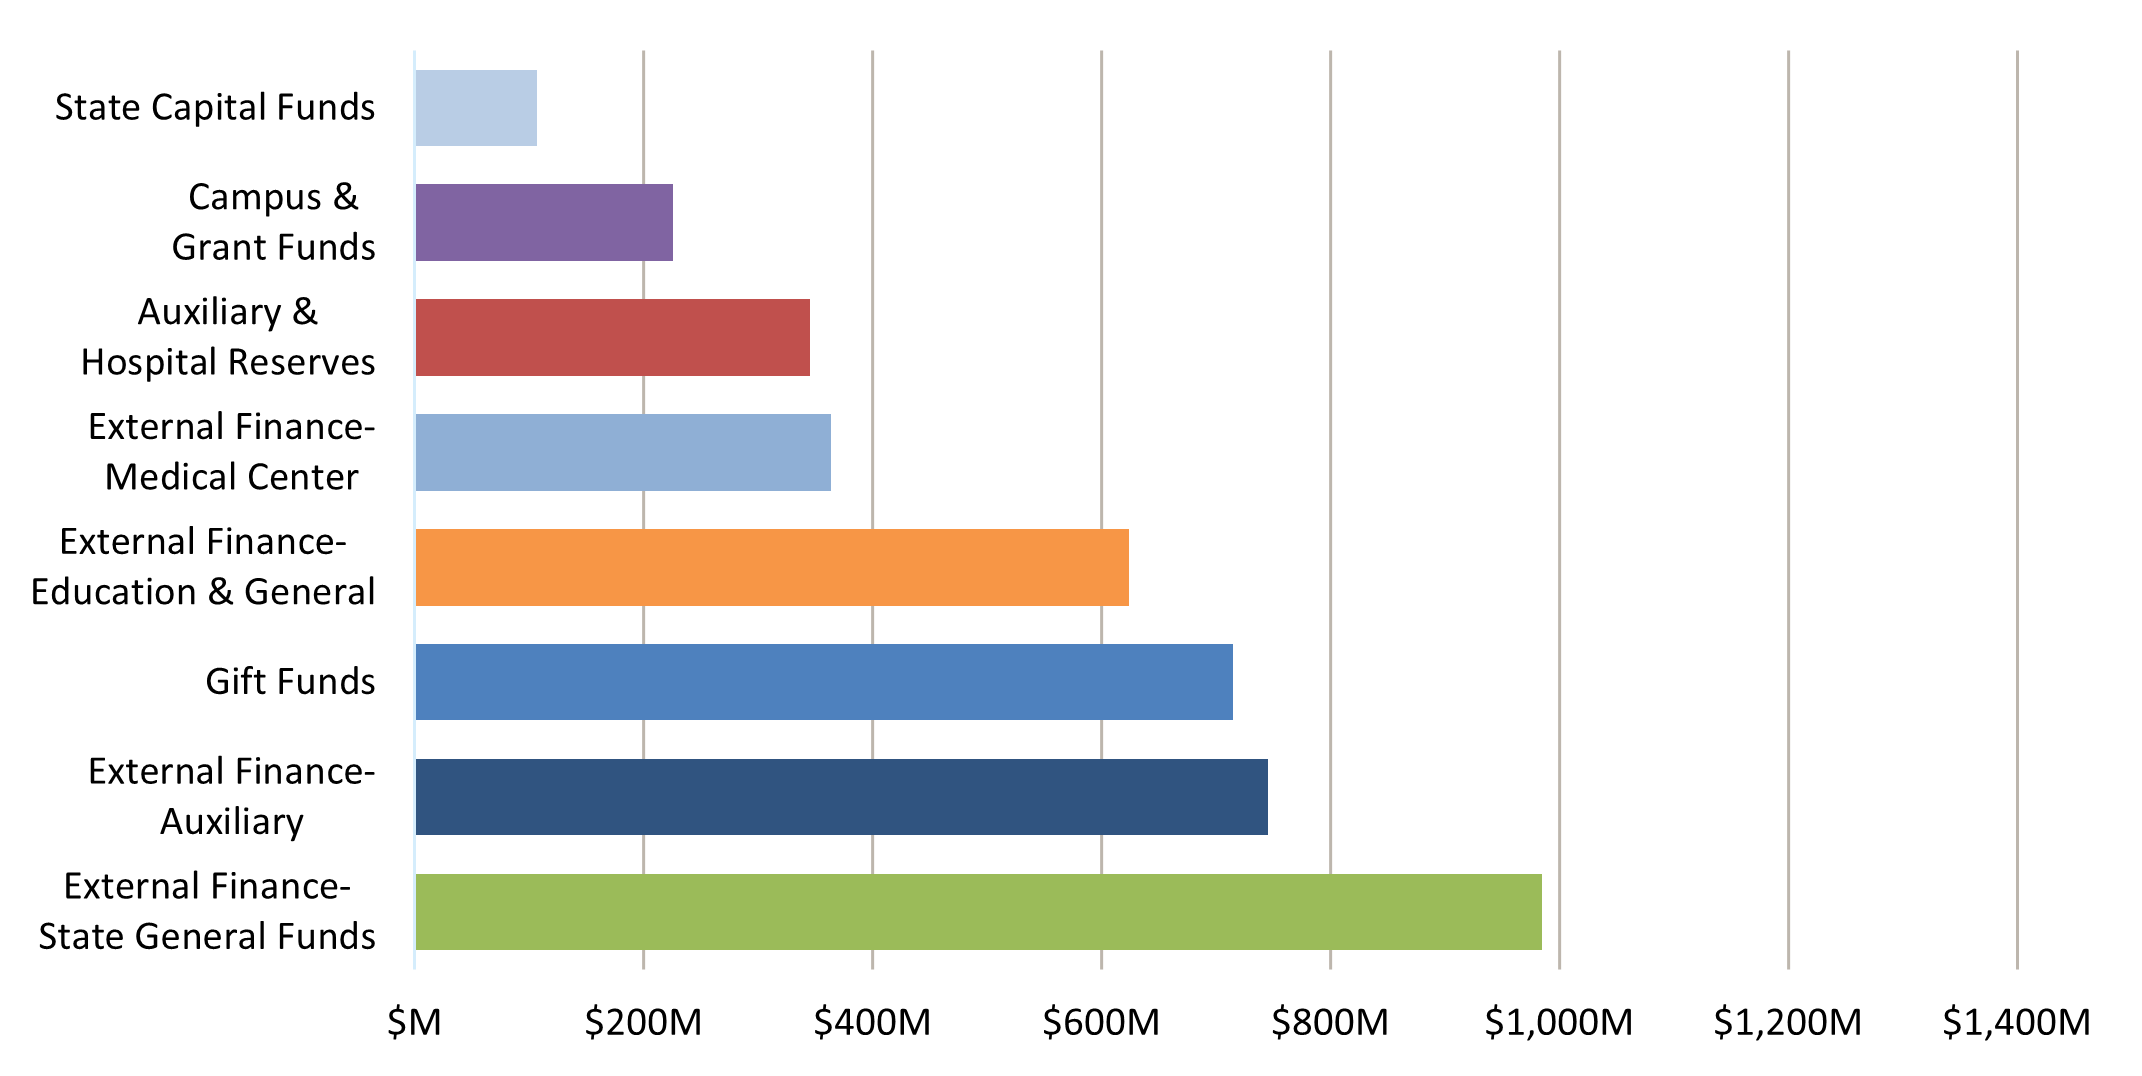
source: UC Capital Asset Strategies
External financing is a crucial component in supporting UC’s capital outlay. In 2023-24, 24 percent of the program was sourced from external financing supported by State resources and 42 percent of the funding was sourced from non-State supported external financing. Most of this financing supported the construction of student housing projects (auxiliary). The non-State financing also supported medical center construction as well as renewal and modernization of instructional and research space and program improvements (education and general).
The remainder of UC’s capital program is funded by gift funds, campus funds, and other non-State sources. These campus funds are derived from various sources, including indirect cost recovery and investment earnings.
Seventy-eight percent of capital funds approved for expenditure in 2023-24 supported program improvements and projects addressing enrollment growth.
12.2.3 Types of capital projects, based on budgets approved by year, Universitywide, 2014–15 to 2023–24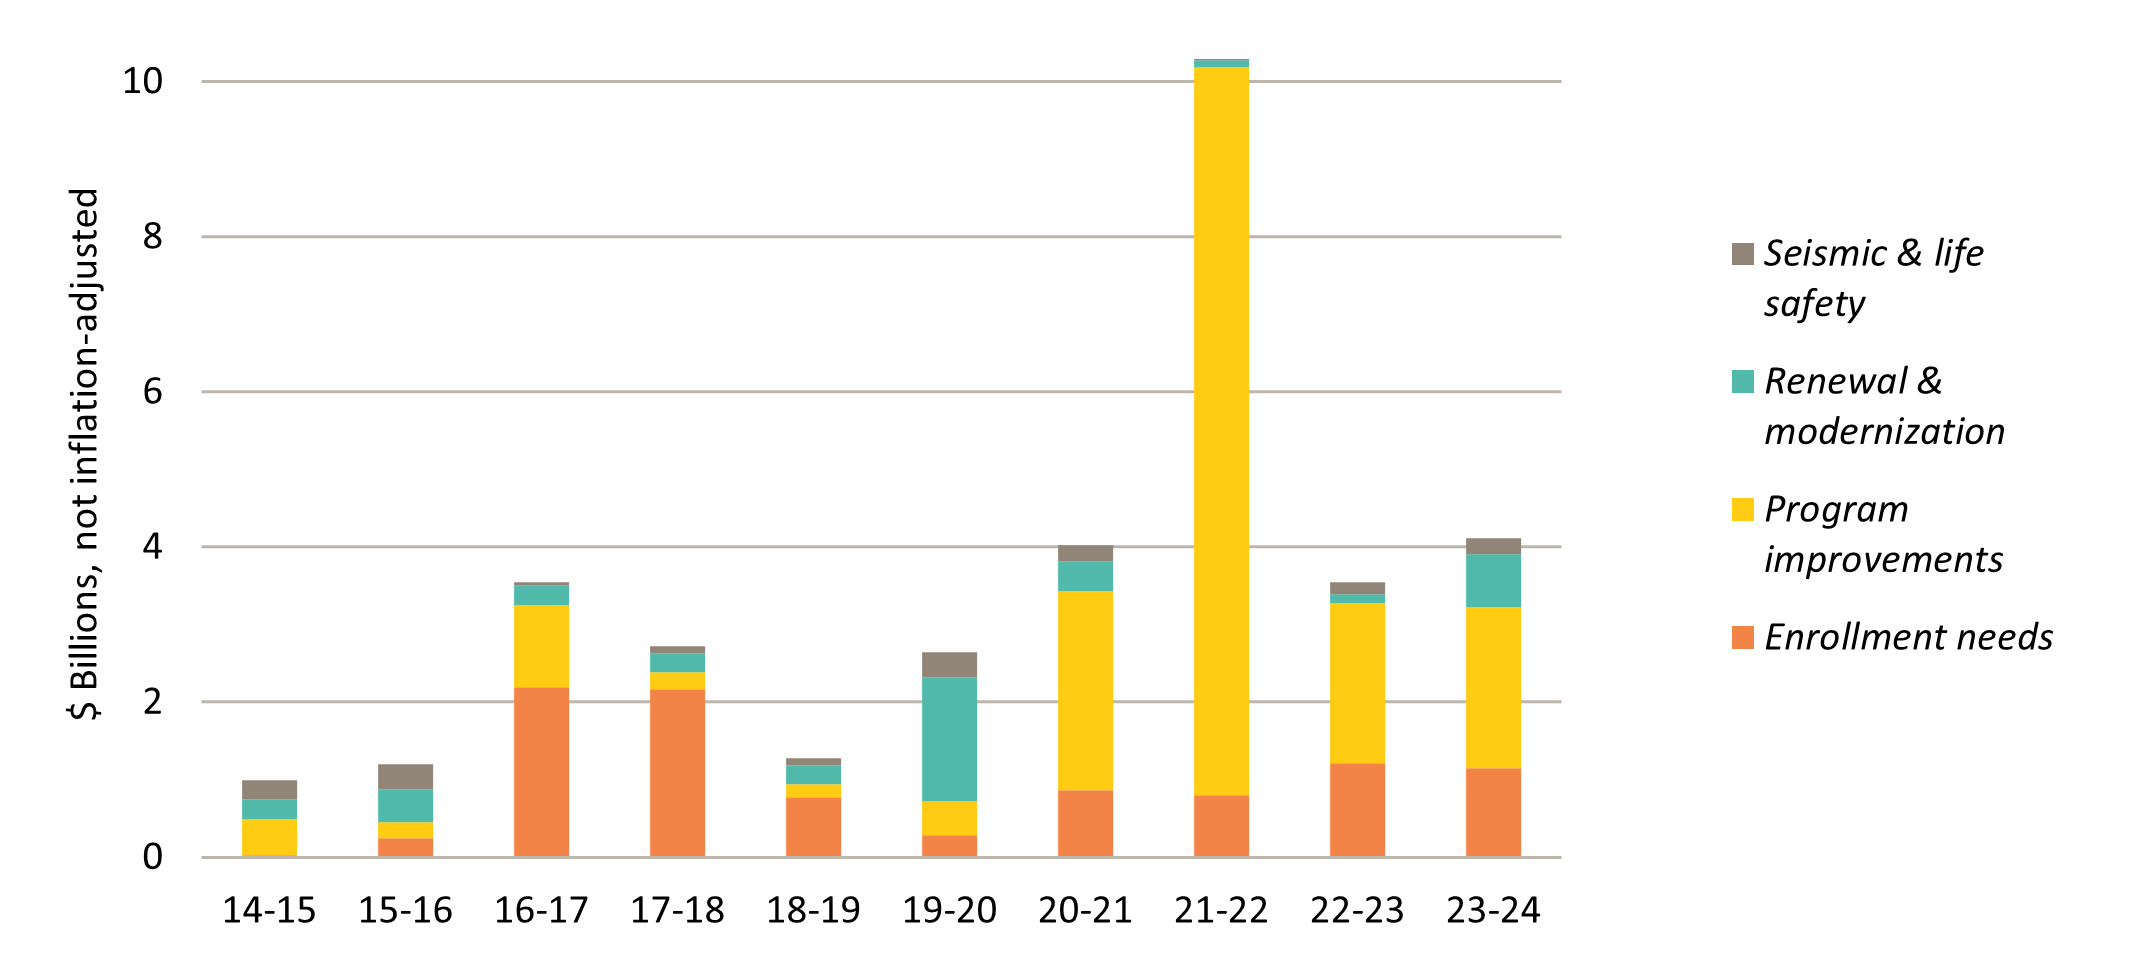
source: UC Capital Asset Strategies
Program improvements and modern program initiatives require state-of-the-art space, often necessitating the repurposing of existing facilities or new construction. During 2023-24, UC approved capital project budgets totaling $4.1 billion.
The capital outlay supported a variety of projects with $2.1 billion for program improvements. A significant portion of the program improvements investment (55 percent) supported two campus projects (UCSF Parnassus Research and Academic Building and West Campus Site Improvements and the State-supported UCM Medical Education Building).
Additionally, UC approved $1.1 billion for projects focused on meeting the demands of increasing enrollments, with the majority directed towards expanding student housing. Notably, 69 percent of these funds supported housing projects at Berkeley and Riverside (UCB 2200 Bancroft Housing Project and the State-supported UCR North District Phase 2).
The remaining $890 million supported projects that addressed renewal and modernization as well as seismic and life safety.
UC space has increased by twenty percent in the past decade, with over half of the growth targeted for residential use.
12.2.4 Assignable square footage (ASF), Universitywide, 2014–2024
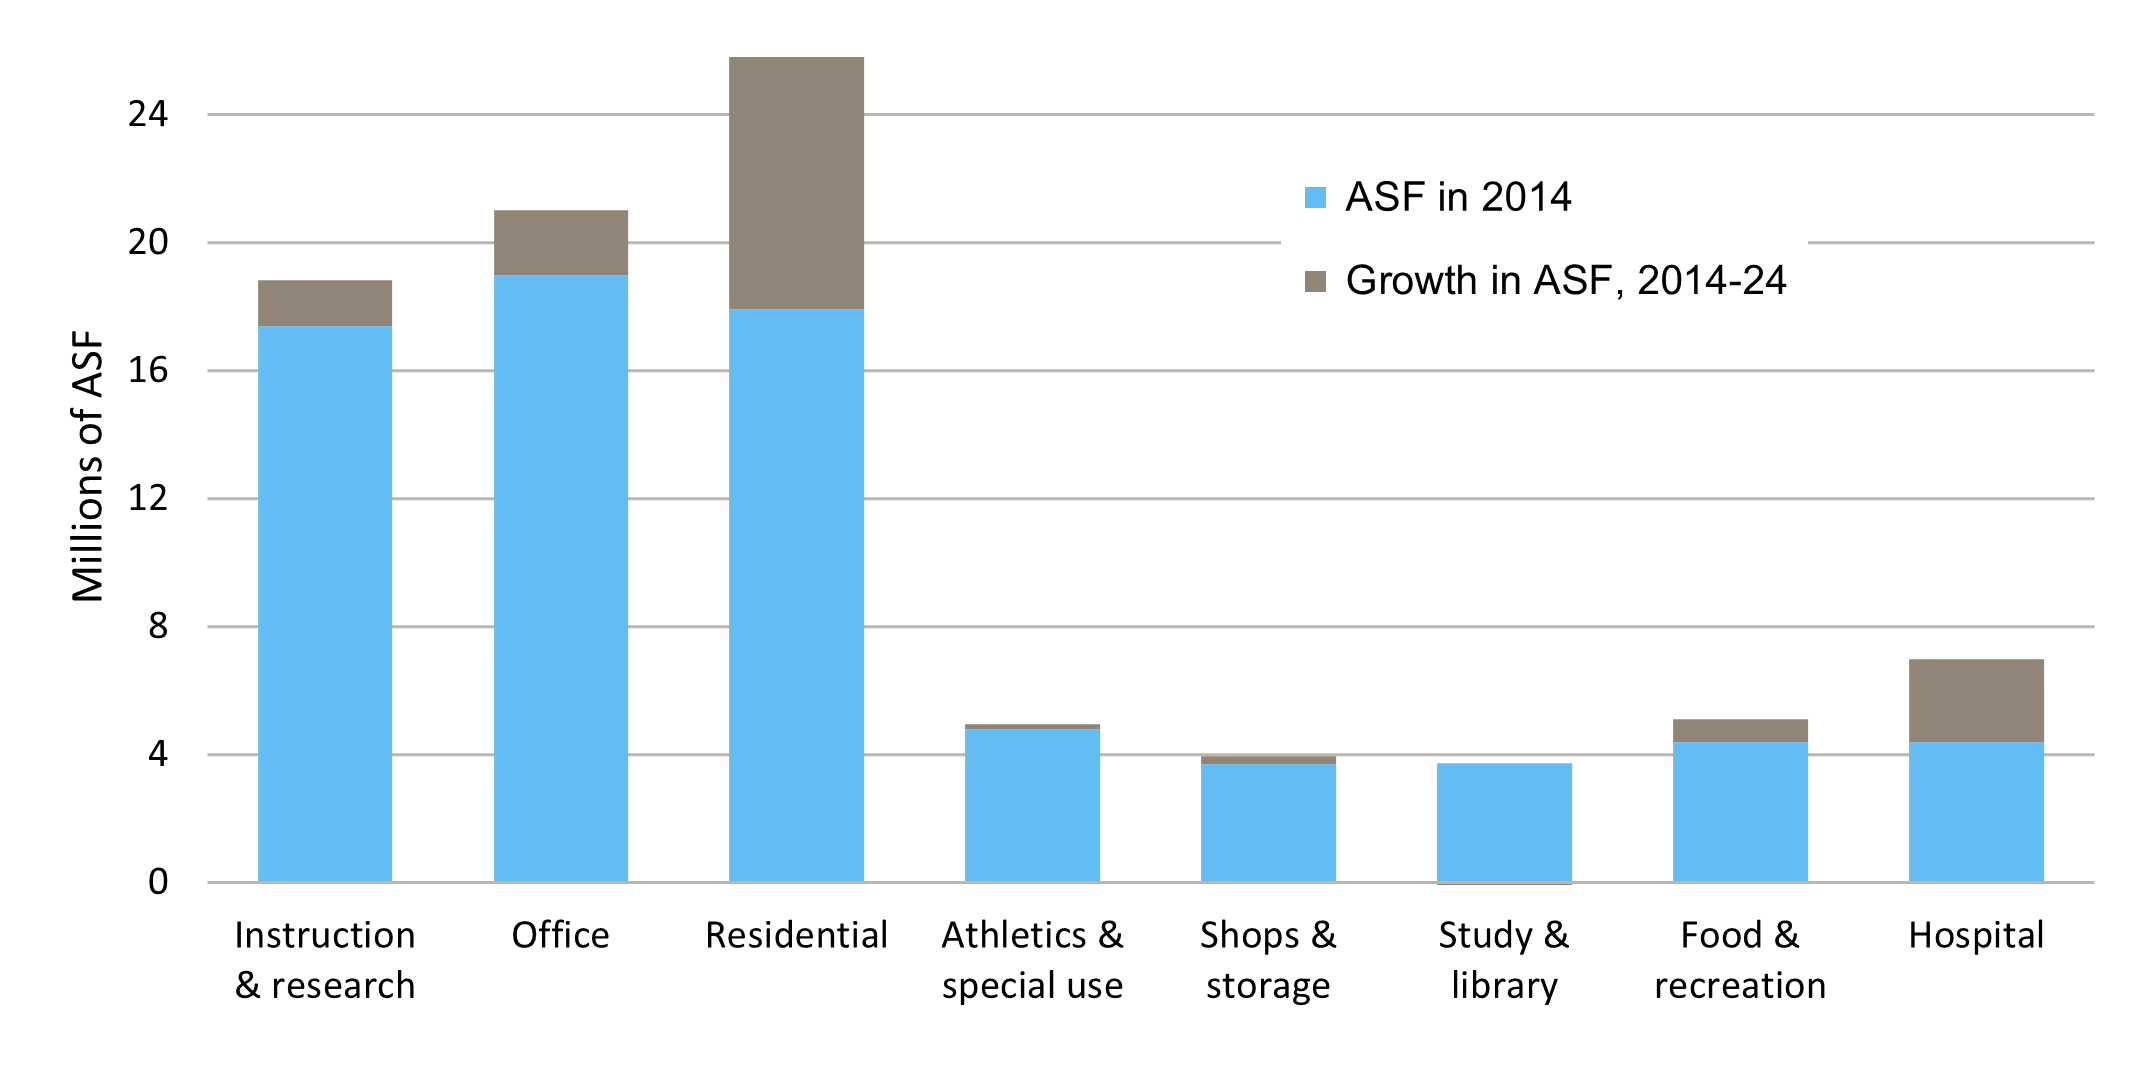
source: UC Capital Asset Strategies
Assignable square footage (ASF) is the space available for programs or assigned to specific uses. It does not include corridors, bathrooms, or building infrastructure. Indicator 12.2.4 illustrates the growth in space over the last decade, according to categories for assignable space. Since 2013, space has increased by 11.3 million ASF to 85.2 million ASF.
In the past decade, instructional and research space increased by about 1.4 million ASF, office space by 2.1 million ASF, and residential space by 7.9 million ASF. Residential space has grown as campuses strive for more on-campus student housing to improve student life in living/learning communities and to reduce environmental impacts from commuting. Increases in the student population have also required additional athletic, recreational, and food service space.
The lack of affordable housing is a problem in California and the nation. The University of California is working diligently to identify ways to support students with their housing. The University continues to access sources of funding to help with the development of affordable housing for UC’s student population. The University was successful in its application through the State of California’s Higher Education Student Housing Grant program, receiving $466 million for the construction of beds to support the lowest-income students.
Hospital space has also grown in the past decade. All five medical centers experienced growth, but most of the growth in hospital space can be attributed to UCSF Medical Center at Mission Bay (2015) and Ron Conway Family Gateway Medical Building (2015), and the Jacobs Medical Center (2016) and Koman Family Outpatient Pavilion (2018) at UC San Diego Health.
The University’s total greenhouse gas emissions increased by 1% in 2023 but remained down 8% from pre-pandemic levels.
12.3.1 Greenhouse gas emissions compared to climate goals, Universitywide, 2009–2023
![]()

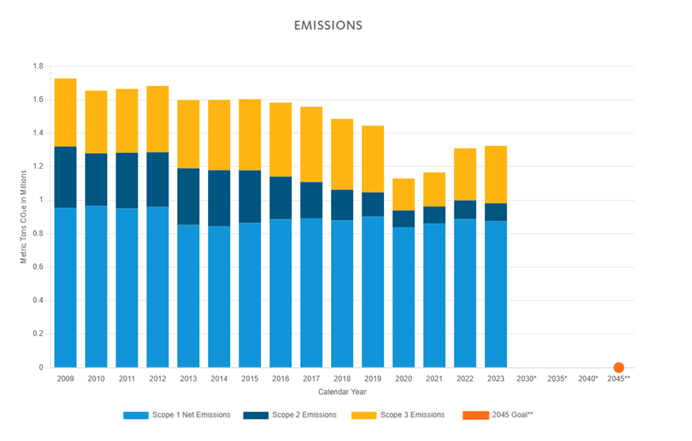
source: UCOP Energy and Sustainability Office
Note:
Interim goals for 2030, 2035, and 2040 to be developed through fossil-free planning that is underway at each location
90% direct reduction of total emissions from 2019 levels with residual emissions negated by carbon removal
Note: Systemwide calculations based on campus and academic health centers’ reported emissions (excluding ANR, UCOP and LBNL) will be verified by a third party by early 2025.
In 2023, UC locations continued their energy efficiency efforts while working to retain the energy use reductions realized during the pandemic, now with increased occupancy and campus activity, achieving a nearly 2% annual reduction systemwide.
12.3.2 Energy costs savings and energy use intensity, Universitywide, 2009–2023
![]()
2024 Annual Sustainability Report – Policy Progress: Energy
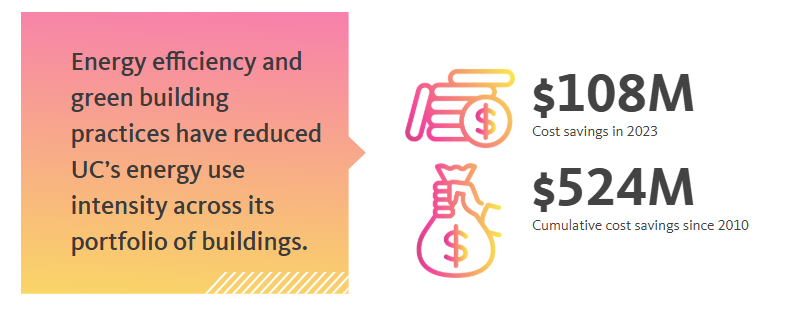
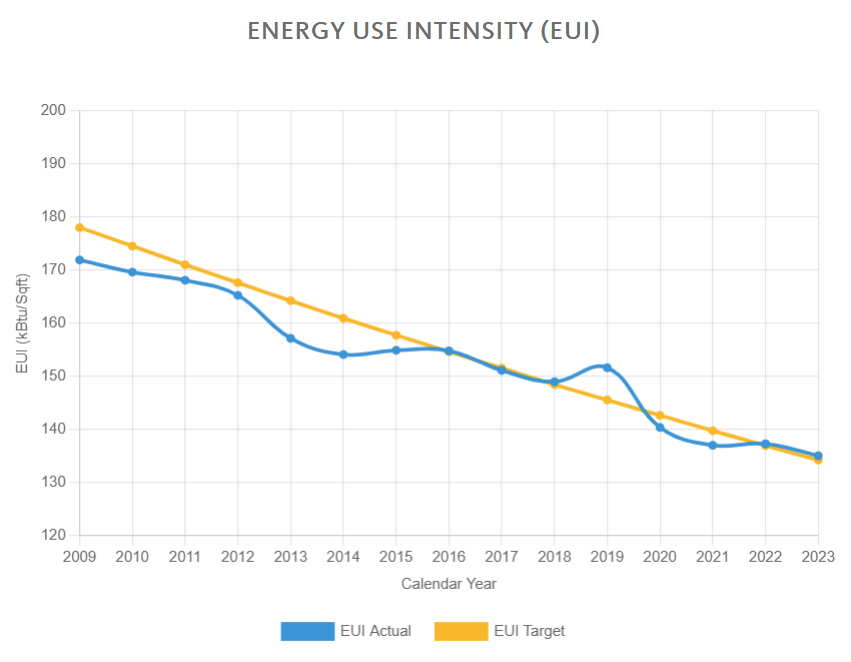
source: UCOP Energy and Sustainability Office
By mid-2024, UC had achieved 445 LEED® certifications.
12.3.3 LEED® certifications, Universitywide, 2002–2024 (cumulative)
![]()
University of California Sustainability Annual Report 2024 – Policy Progress: Green Building
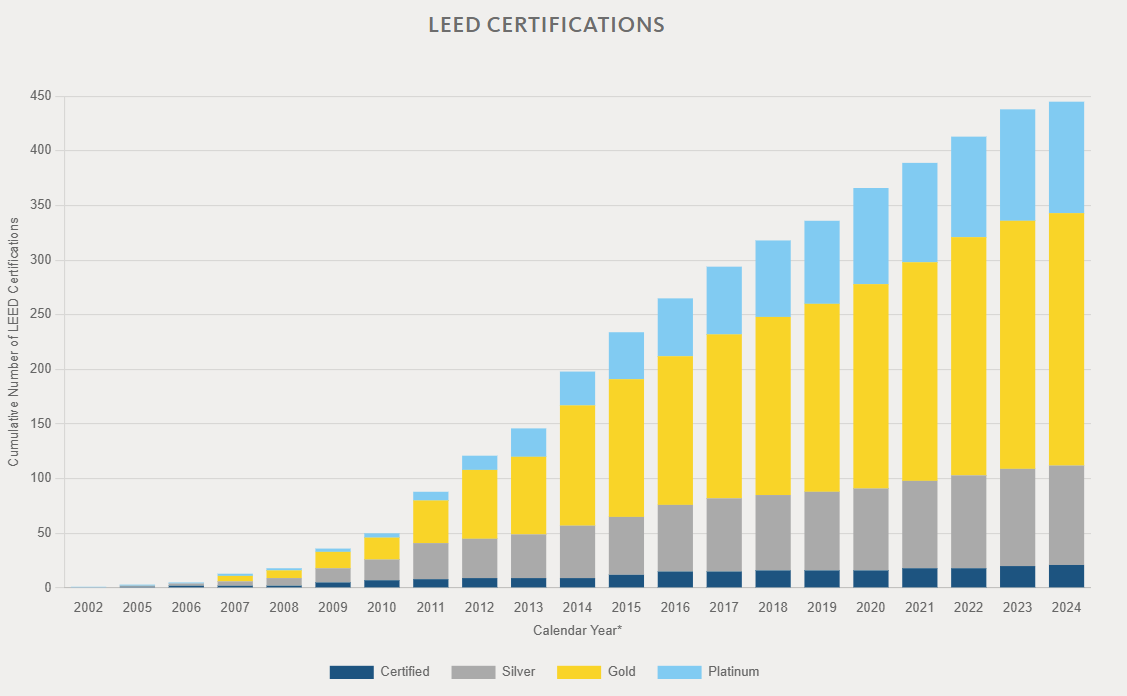
source: UCOP Energy and Sustainability Office
UC police departments made 19,171 stops in 2024 as compared to 15,016 stops in 2023.
12.4.1 Number and circumstances of UCPD stops by month, Universitywide, 2024
![]()
Community safety: Stops dashboard
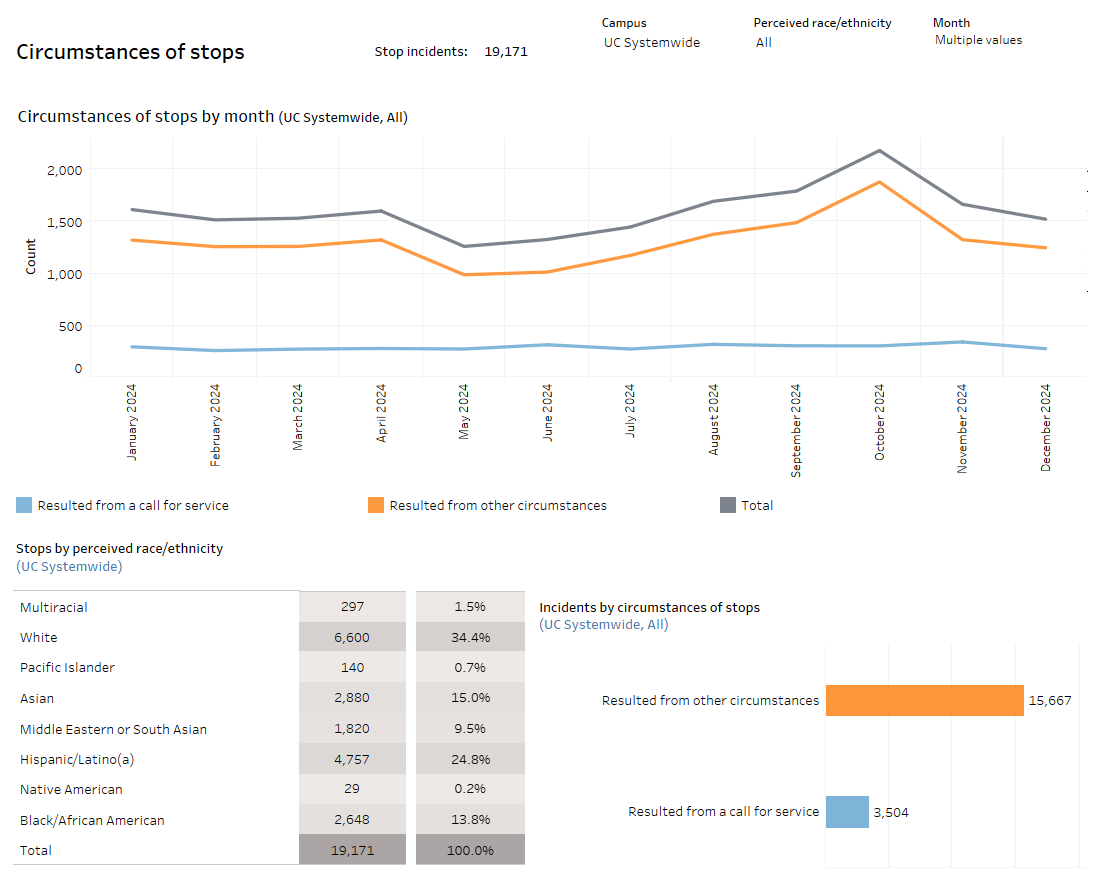
source: Quarterly data submissions from UC police departments
Most of the stops originated from a traffic violation, and the majority of all stops resulted in a warning. The dashboard linked above provides additional information on the reason for and result of UC police department stops by campus and perceived race/ethnicity.
There were 129 use-of-force incidents in 2024 as compared to the same number of incidents in the prior year.
12.4.2 Number of UCPD use of force incidents by month, Universitywide, 2024
![]()
Community safety: Use of force dashboard
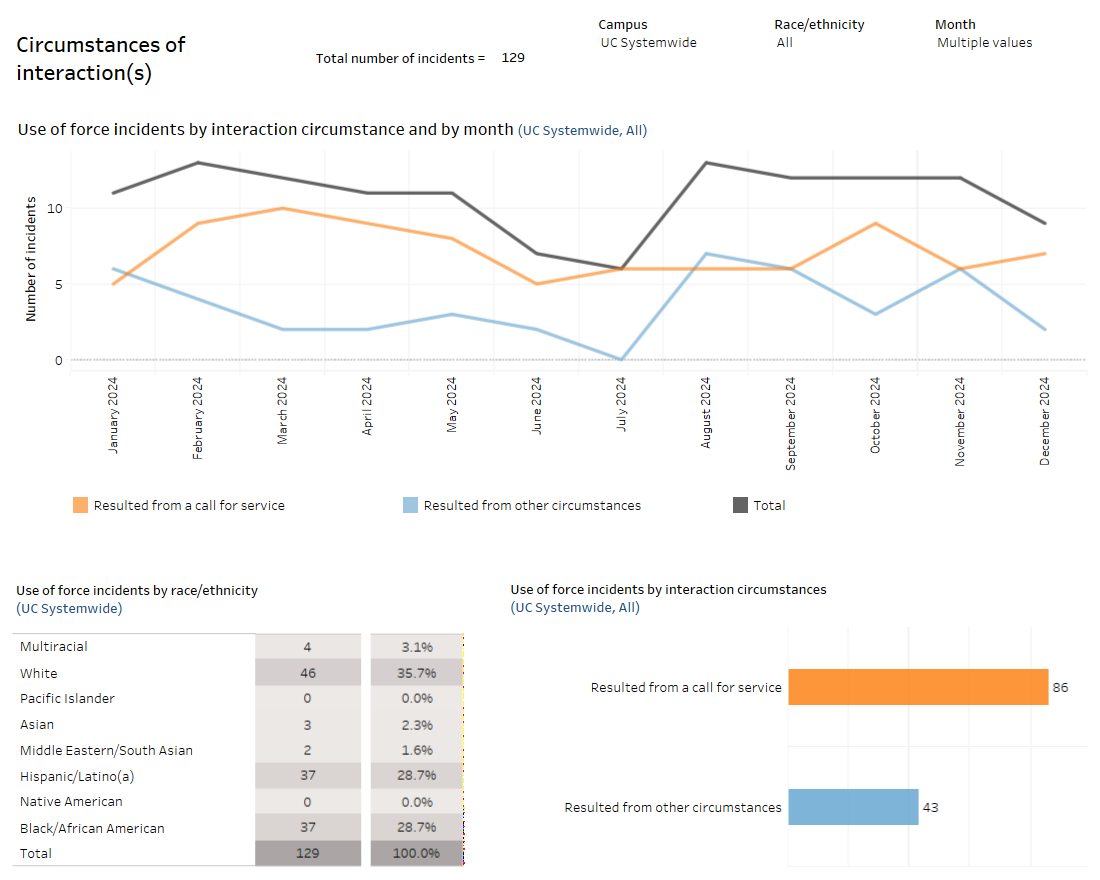
source: Quarterly data submissions from UC police departments
The majority of use-of-force incidents were preceded by a call for service and resulted in the use of a physical technique. The dashboard linked above provides additional information about use-of-force incidents by campus and by race/ethnicity.
Although the reporting of the use of force is not consistent across campuses, UCPD Chiefs are currently developing a consistent reporting approach.
There were over 471,000 calls for service to UC police departments throughout 2024, a 10.8 percent increase in calls for service over the prior year.
12.4.3 Number of UCPD calls for service by call category, Universitywide, 2024
![]()
Community safety: Calls for service dashboard
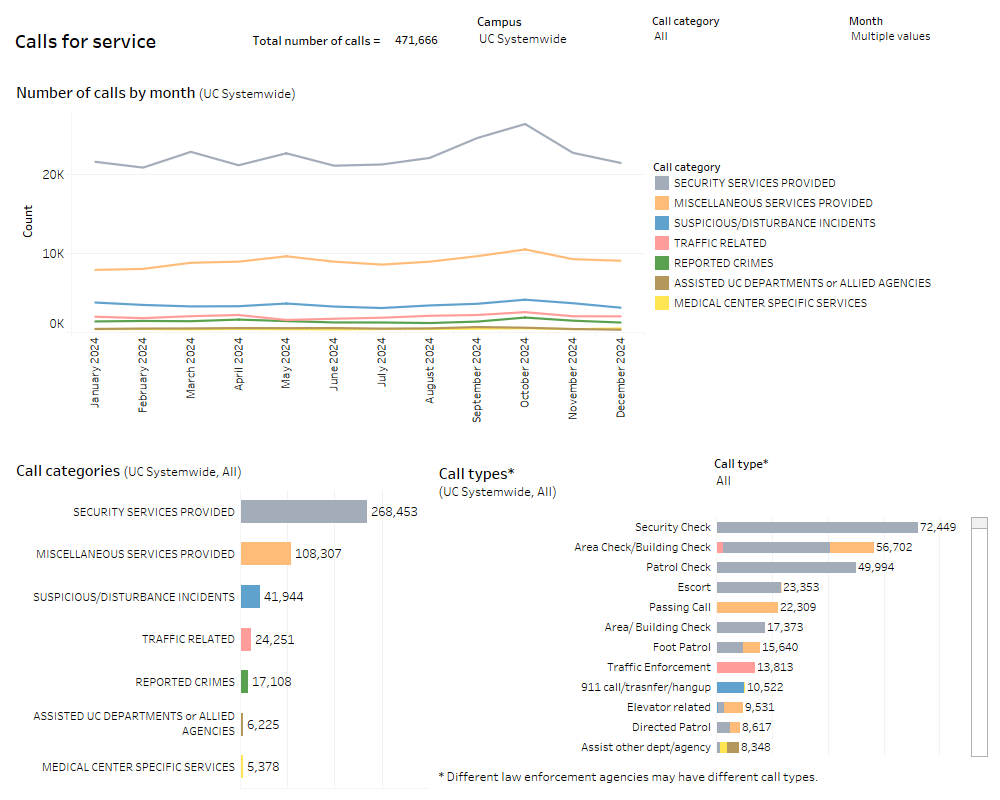
source: Quarterly data submissions from UC police departments
The majority of calls for service were for security services such as security checks, building checks, patrol checks, escorts, etc. The dashboard linked above provides additional information about calls for service by campus.
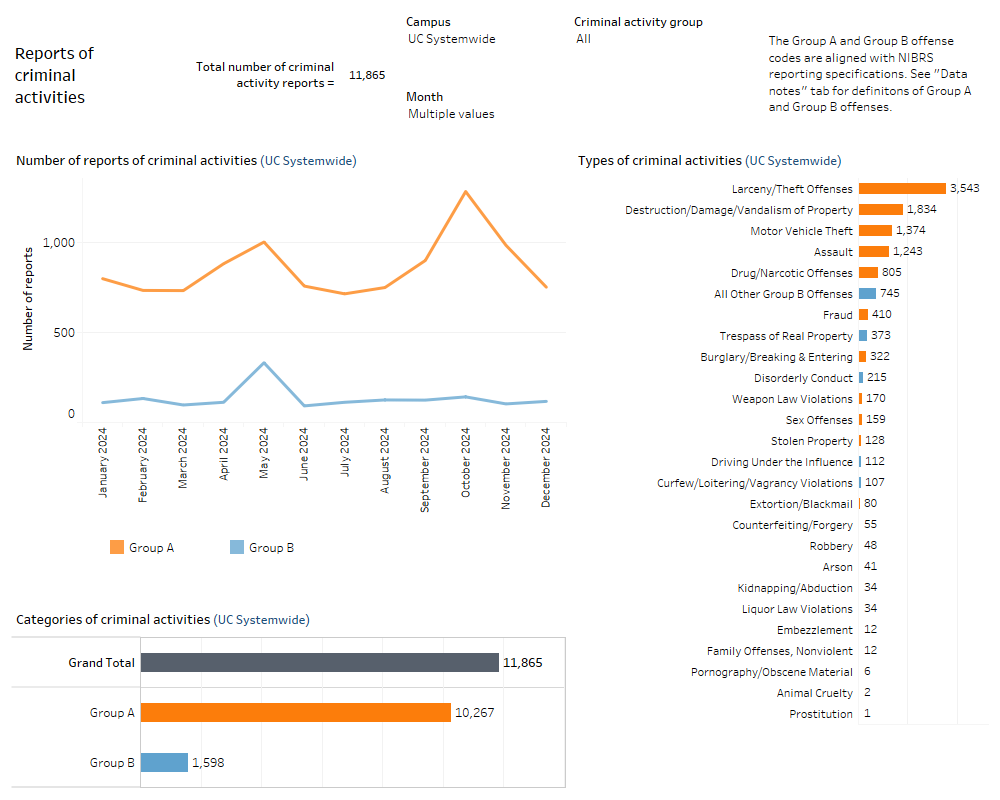
There were 11,865 reports of criminal activities/offenses and 3,196 arrests in 2024. While the number of criminal activities/incidents in 2024 remained on par with the prior year, the 16.4 percent increase in the number of arrests was a result of student protests over the Israel-Hamas war that led to nationwide campus unrest in 2024.
12.4.4 Number of UCPD criminal activity reports/offenses by month, Universitywide, 2024
![]()
Community safety: Crimes dashboard
source: Quarterly data submissions from UC police departments
The majority of criminal activity reports were for offenses such as larceny/theft, vandalism, motor vehicle theft, assault, etc. The dashboard linked above includes additional data on criminal activity reports by type of criminal activity and campus.
Group A: Under the National Incident-Based Reporting System (NIBRS), Group A offenses include, but are not limited to: Human trafficking, homicide, assault, larceny/theft, bribery, burglary/B&E, destruction/damage/vandalism of property, drug/narcotic offenses, pornography/obscene material offenses, embezzlement, prostitution offenses, extortion/blackmail, fraud, robbery, gambling offenses, stolen property, etc.
Group B: Under NIBRS, Group B offenses include, but are not limited to: Bad checks, curfew/loitering/vagrancy violations, disorderly conduct, driving under the influence, drunkenness, nonviolent family offenses, liquor law violations, peeping tom, trespassing, etc.
A full list of Group A and Group B offenses begin on page 10 of the NIBRS user manual
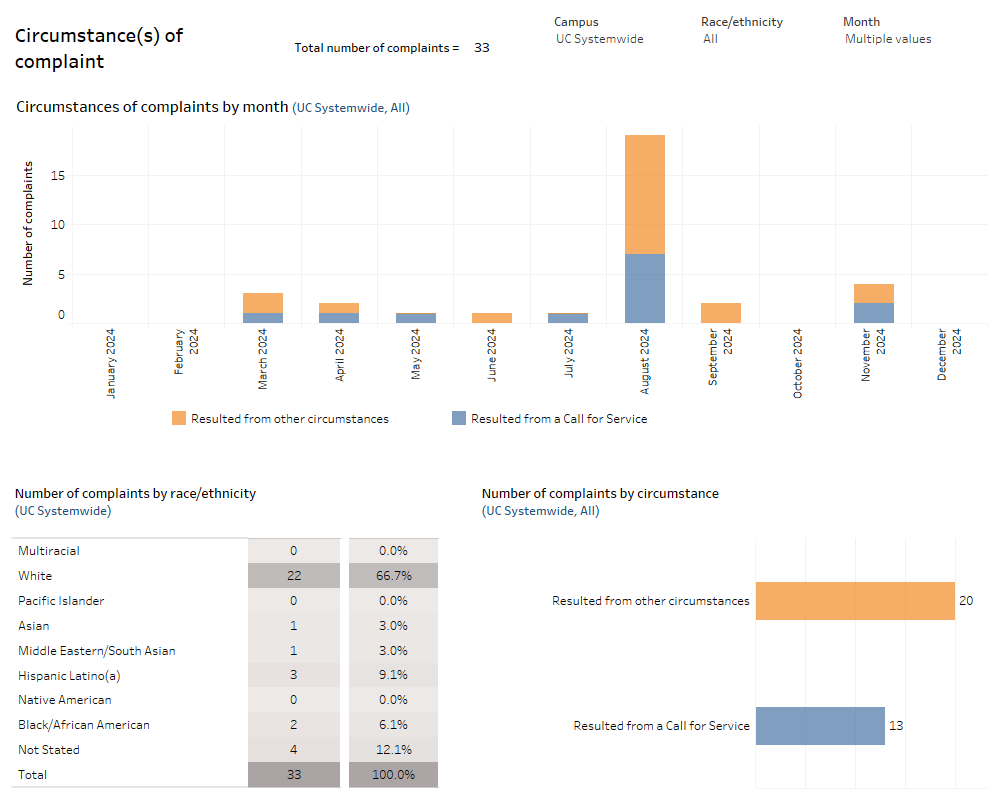
There were 33 civilian complaints against UC police officers in 2024 compared to 17 in the prior year.
12.4.5 Number of UCPD civilian complaints by month, Universitywide, 2024
![]()
Community safety: Civilian complaints dashboard
source: Quarterly data submissions from UC police departments
The majority of civilian complaints stemmed from allegations of unprofessional conduct and other unethical behavior. The dashboard linked above provides additional information on the circumstances and results of civilian complaints by campus.
12.5 EXTERNAL IMPACT
UC faculty receive prestigious awards as leaders in their fields.
12.5.1 Nobel Prizes by campus affiliation
Seventy faculty and researchers affiliated with the University of California have won 71 Nobel Prizes.
Learn who UC's Nobel prize winners are at the UC Laureates website.
|
Chemistry |
Economics |
Literature |
Medicine |
Physics |
Peace |
|
|
Berkeley/ Berkeley Lab |
10 |
6 |
1 |
1 |
9 |
|
|
Irvine |
2 |
1 |
||||
|
Livermore Lab |
1 |
|||||
|
UCLA |
3 |
1 |
1 |
2 |
||
|
Riverside |
1 |
1 |
||||
|
San Diego |
5 |
3 |
6 |
2 |
1 |
|
|
San Francisco |
6 |
|||||
|
Santa Barbara |
2 |
1 |
4 |
|||
|
Santa Cruz |
|
|
1 |
|
||
|
|
|
|
|
12.5.2 Prizes, medals, and awards won by UC faculty
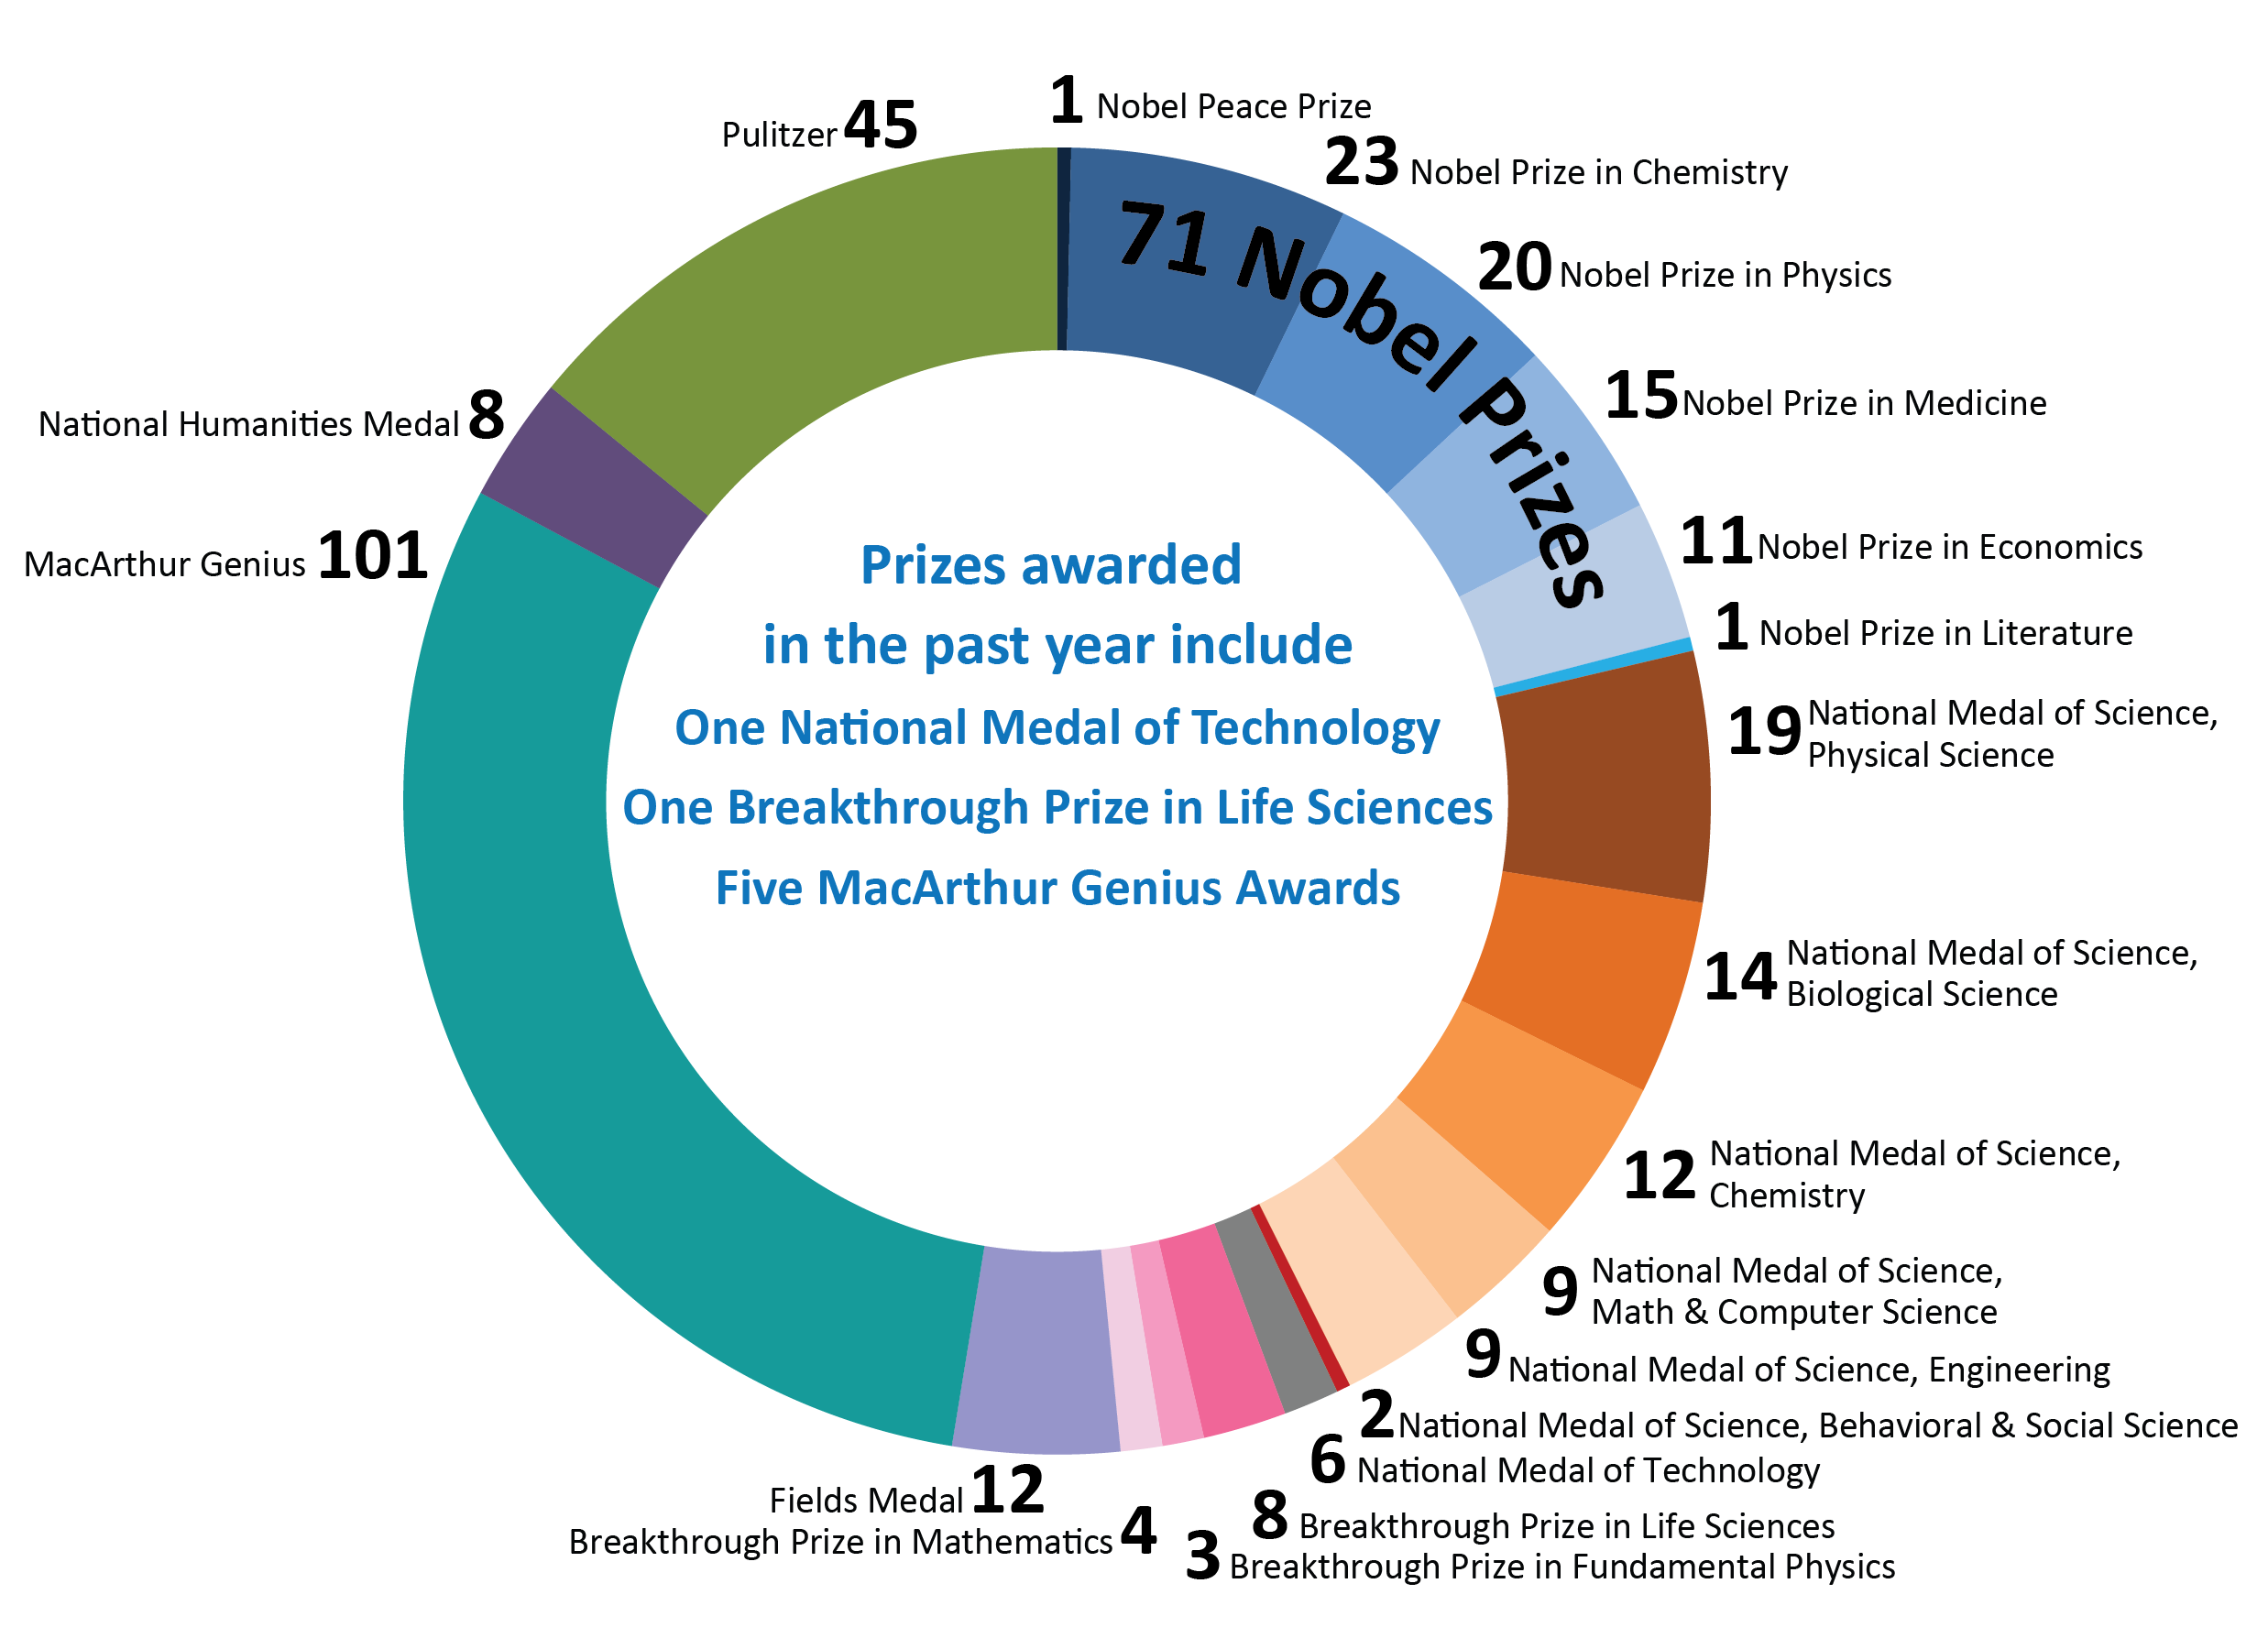
In addition to the prizes, medals, and awards presented in the chart above, many UC faculty are members of prestigious National Academies, providing leadership in service and general welfare to the nation.
National Academy of Sciences: 730
National Academy of Engineering: 299
National Academy of Medicine: 278
National Academy of Inventors: 148
12.5 EXTERNAL IMPACT
UC’s economic impact to California is $82 billion annually, based on 2021 report
12.5.3 The economic impact of UC in California
![]()
The University of California: Systemwide economic, fiscal, and social impact analysis, 2021 report
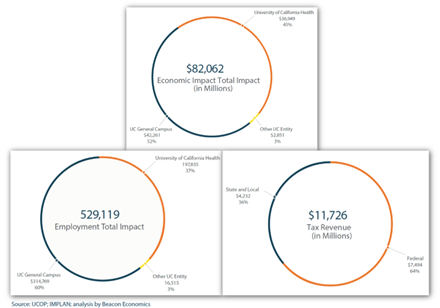
The University of California is a powerful economic engine, contributing significantly to the State’s vibrancy and economic strength. According to a 2021 economic impact report, UC’s presence supports over half a million jobs, or one in every 45 across the state. UC also delivers a remarkable return on investment—every dollar invested in UC by the state yields more than $21 in economic output. Beyond employment and economic output, UC-related spending contributes nearly $12 billion in federal, state, and local tax revenues each year, further underscoring UC’s vital role in bolstering California’s economy.
Finances
Annual Financial reports (website)
Annual Financial reports (Medical Centers) (website)
Annual reports on University private support (website)
UC’s Operating Budget (website)
Capital Projects
Annual Major Capital Projects report (website)
Capital Financial Plan (website)
UC's capital planning (website)
UC’s capital programs (website)
Sustainability
Annual Sustainability reports (website)
2024 Annual Sustainability report – Policy Progress (website)
Information on UC’s sustainability (website)
UC Community Safety
UC Community Safety Plan (website)
Update on the implementation progress of the UC community Safety Plan (November 2022) (pdf)
![]()
UC community safety dashboards
The complete UC Information Center Institutional measures subject area.
The complete UC Information Center UC 2030 goals subject area.
The complete UC Information Center UC by the numbers subject area.
Download data tables for chapter 12 indicators (Excel format)