Chapter 3:
UNDERGRADUATE SUCCESS
MEETING CALIFORNIA'S NEED TO INCREASE DEGREE RECIPIENTS
UC has committed to adding more than 160,000 bachelor’s degree recipients by 2029–30, in part by increasing graduation rates and improving timely graduation. By 2030, UC’s goal is to have nine of ten undergraduates leave with a degree, and to improve four-year freshman graduation rates to 76 percent, and two-year transfer graduation rates to 70 percent. In addition, UC’s goal is to eliminate gaps in timely graduation for students with a low socioeconomic status including Pell Grant recipients, first-generation students, and underrepresented groups (URG), in the spirit of demonstrating progress toward the Governor’s Compact goals and UC Presidential priorities.
This chapter provides a progress report on these critical goals and priorities, covering the following three topics:
- Graduation rates and time to degree for freshmen and transfers, including demographic and academic subgroups (3.1)
- First-year retention rates for freshmen and transfers, including subgroups (3.2)
- Outcomes, including undergraduate degrees awarded and alumni employment and earnings (3.3)
Although the overall freshman and transfer graduation rates have increased over the years and are showing good progress toward UC 2030 goals, there are still gaps in rates between subgroups. Low-income students, first-generation students, URG students, and less academically prepared students have lower average graduation rates, especially four-year graduation rates for freshmen and two-year graduation rates for transfers. However, academic preparedness seems to explain more of the difference in graduation rates than the other aforementioned student characteristics. The effects of missed and lost learning experiences during the COVID-19 pandemic had an impact on graduation rates for all students and exacerbated the trend seen with low socioeconomic-status students and less academically prepared students.
Note: Underrepresented (URG) include African American, American Indian, and Hispanic/Latino(a) students.
UC freshmen graduate at higher rates than comparable AAU public universities; UC four- and six-year graduation rates are 73 percent and 86 percent respectively while AAU public university four- and six-year graduation rates are 66 percent and 82 percent respectively.
3.1.1 Freshman graduation rates, UC and comparison institutions, Cohorts entering fall 2018, 2019, and 2020; fall 2017 cohort for AAU comparison
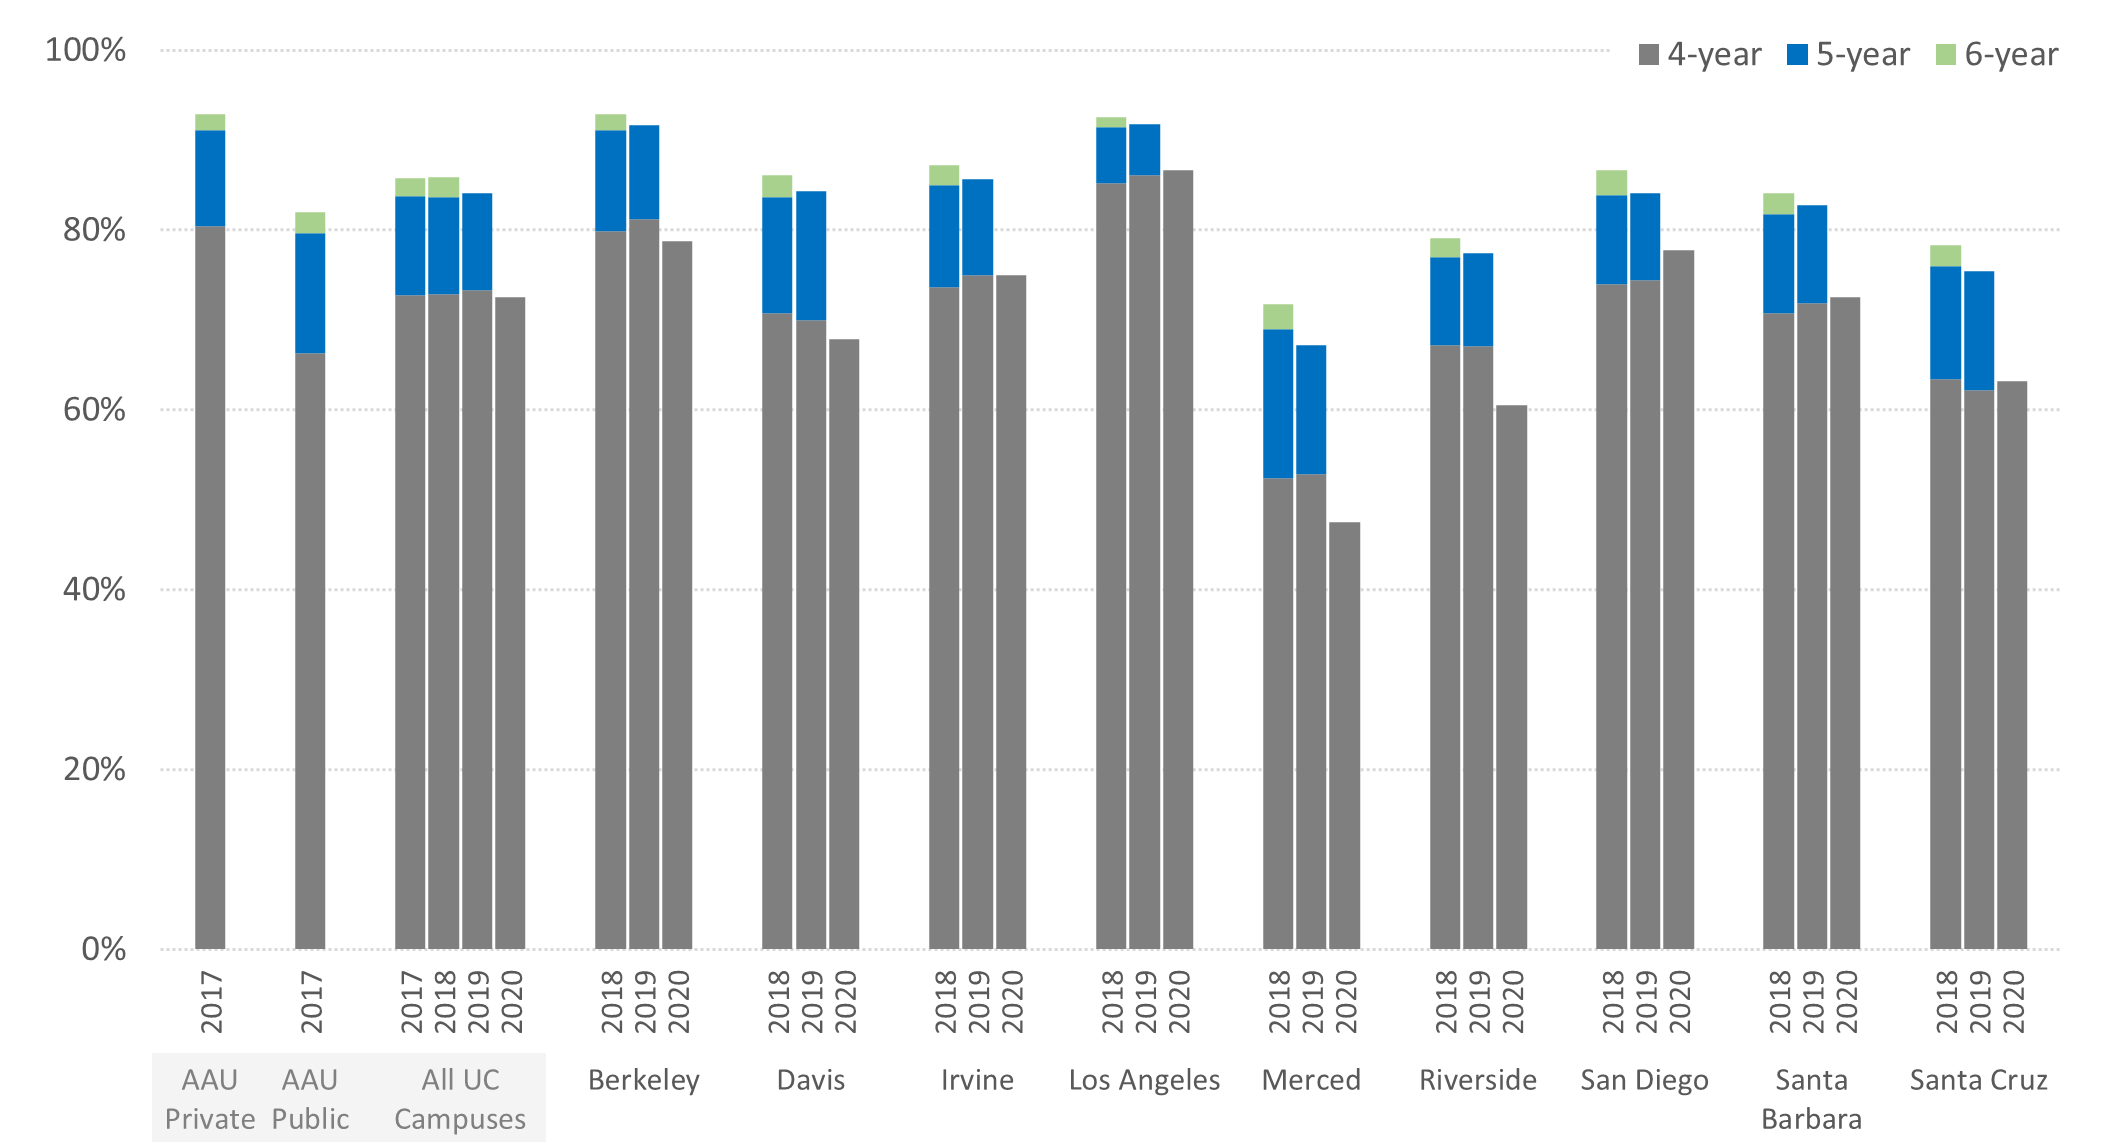
source: UC Data Warehouse and IPEDS
By 2030, UC is striving to raise four-year freshman graduate rates to 76 percent and six-year freshman graduation rates to 90 percent. UC has identified a wide range of programs to promote the academic success of undergraduates and is seeking financial support from the State to achieve these goals. These programs include expanding orientation, advising, and counseling services; increasing on-campus work opportunities; redesigning and removing achievement gaps in entry courses with large enrollments; streamlining course prerequisites, course sequences, and degree requirements; summer research and summer bridge programs; increasing access to summer session courses; developing pedagogical strategies for the diversification of classrooms and instruction; and conducting learning analytics to assist students who might need additional support.
The freshman graduation rates for each racial/ethnic group at UC are higher compared to students at other AAU public institutions; however, disparities among these groups persist.
3.1.2 Freshman graduation rates by race/ethnicity between UC and comparison institutions, cohort entering fall 2017

source: UC Data Warehouse and IPEDS
When broken down by race/ethnicity, AAU private institutions generally demonstrate higher graduations rates for all groups relative to UC and other AAU public institutions. UC has higher graduation rates for each racial/ethnic group than other AAU publics.
The six-year graduation rate of UC freshmen is 88 percent when students who finished their degrees at a non-UC institution are included.
3.1.3 Freshman extended graduation rates, including those who graduated from a non-UC institution, Universitywide and UC campuses, Cohort entering fall 2017

Undergraduate graduation rates dashboard
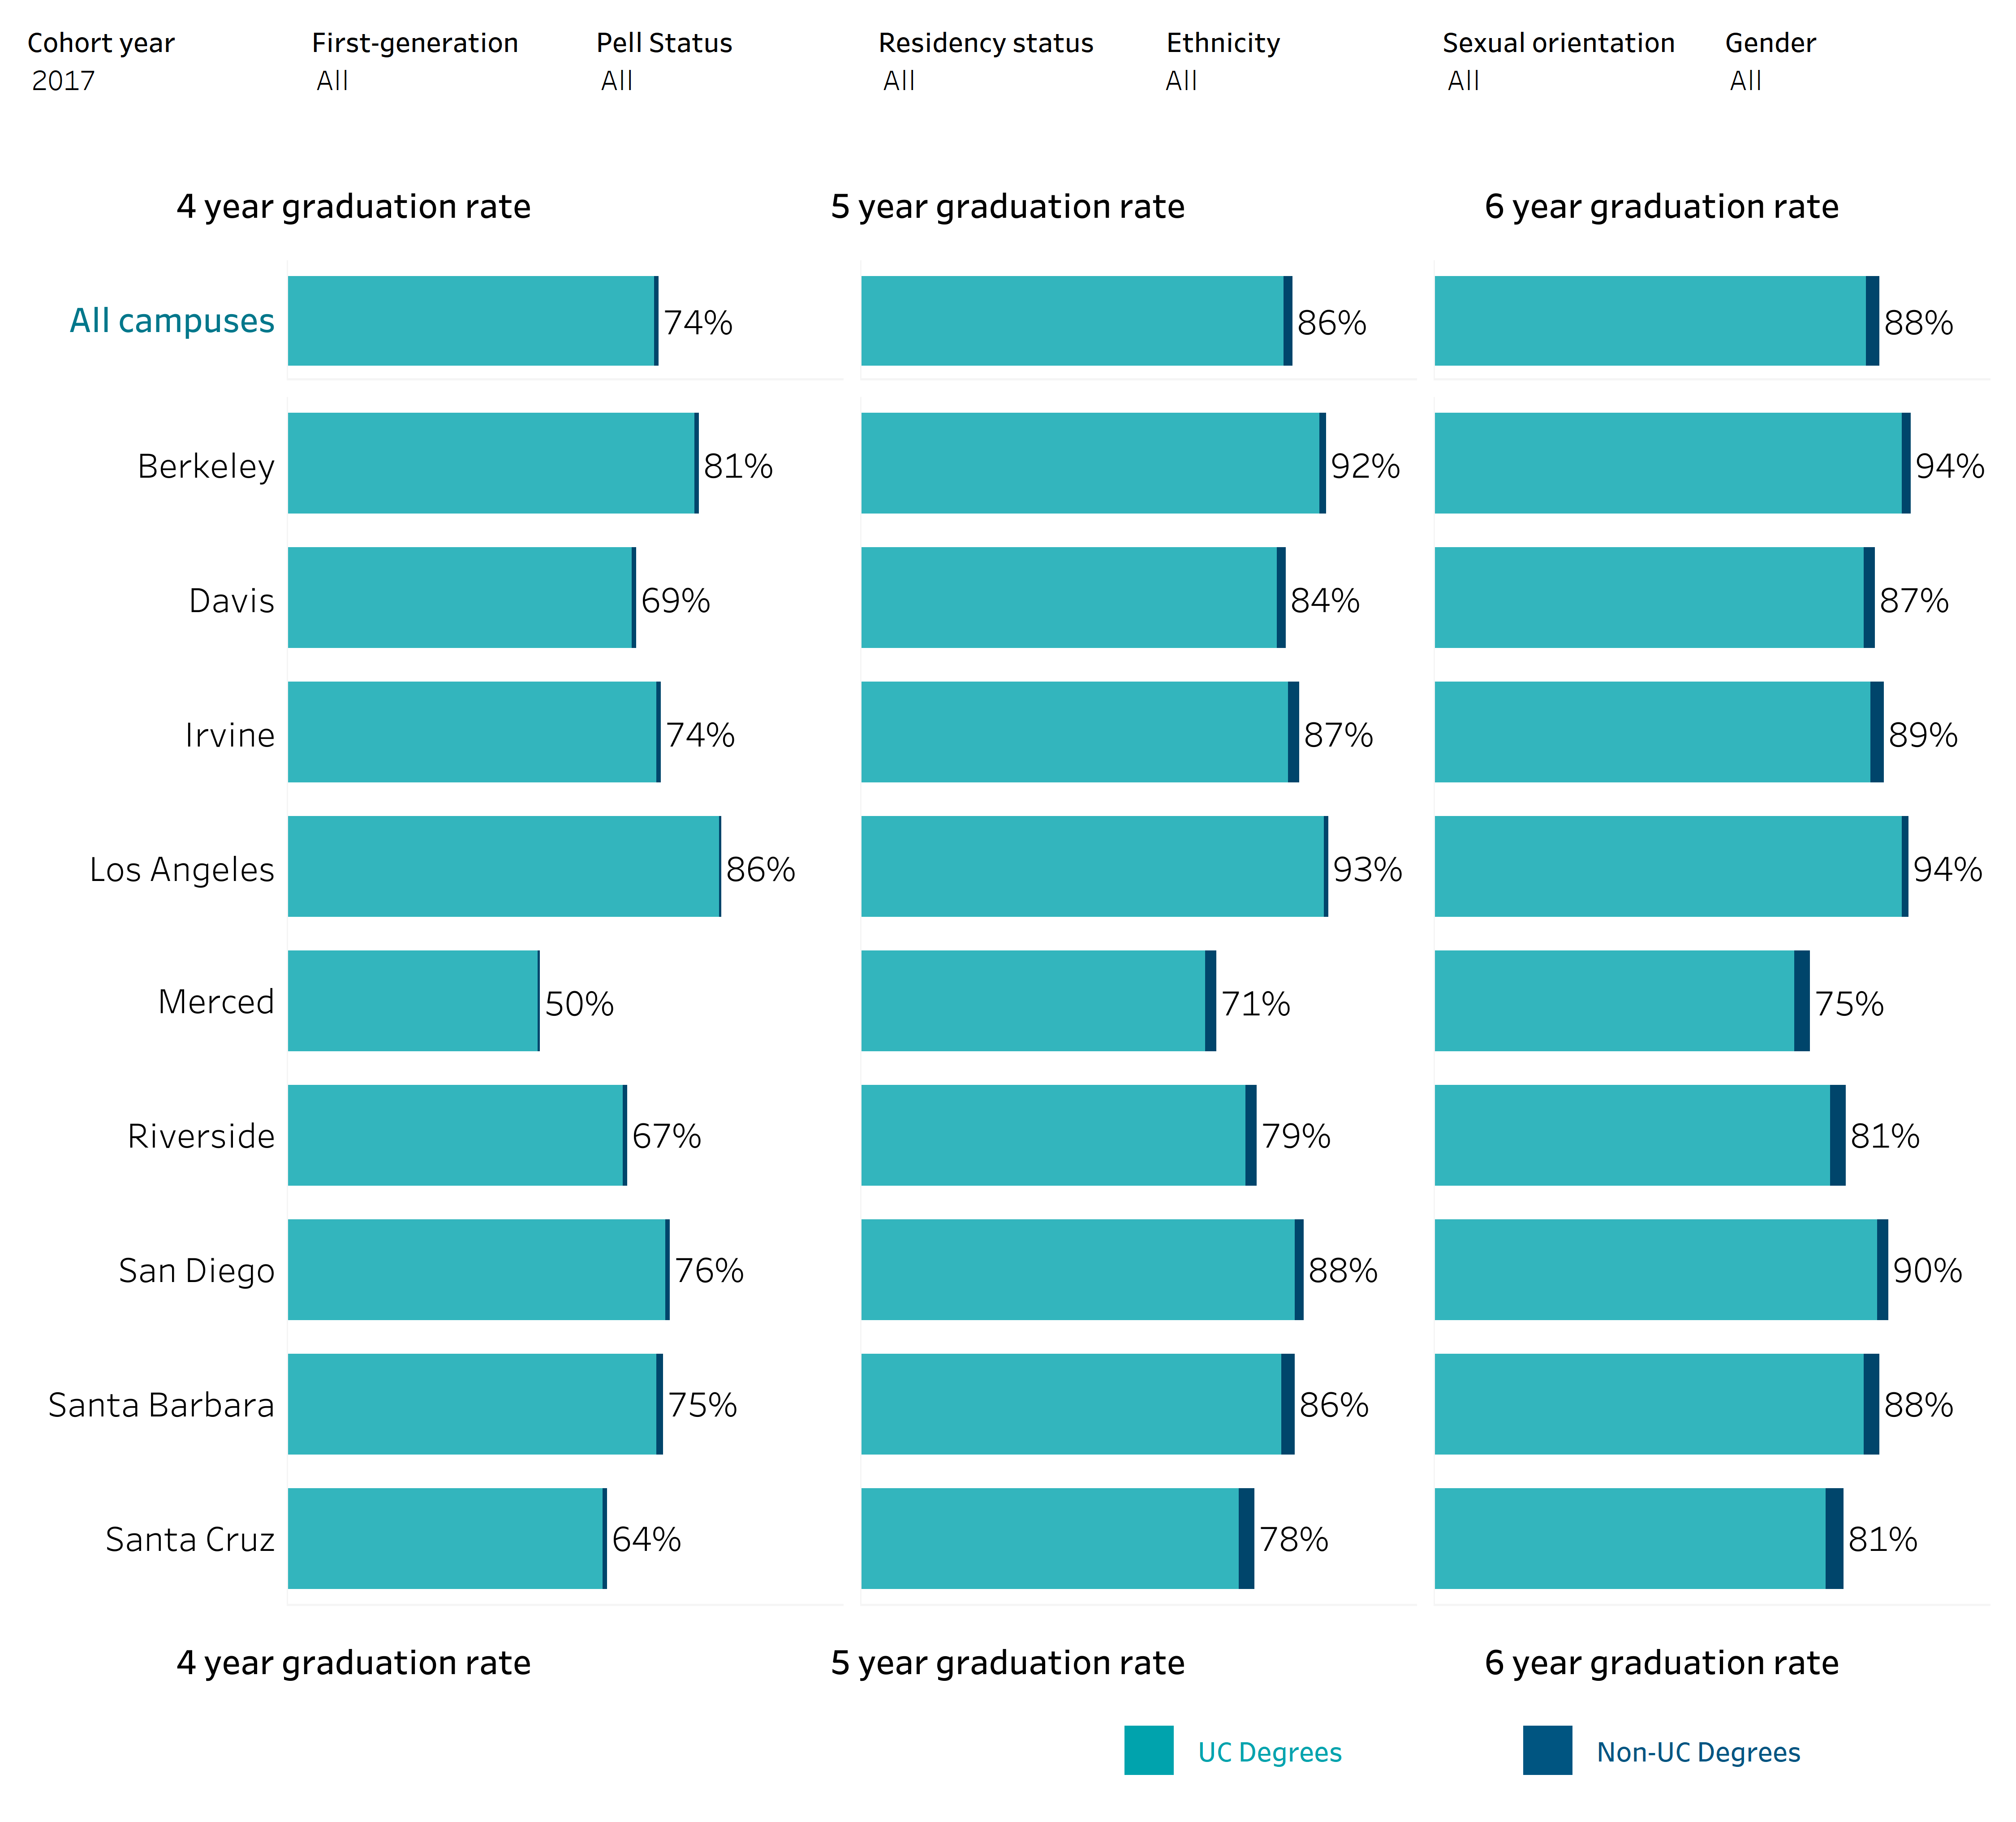
source: UC Data Warehouse and the National Student Clearinghouse
The extended graduation rate of students who begin their studies as freshmen at UC includes those who transfer to a non-UC institution and complete their bachelor’s degree within four, five, or six years.
Note: Intercampus transfers within UC are counted as graduates of their originating UC campus. In this graph, non-UC rates only include those who transferred to non-UC institutions and graduated with a bachelor’s degree.
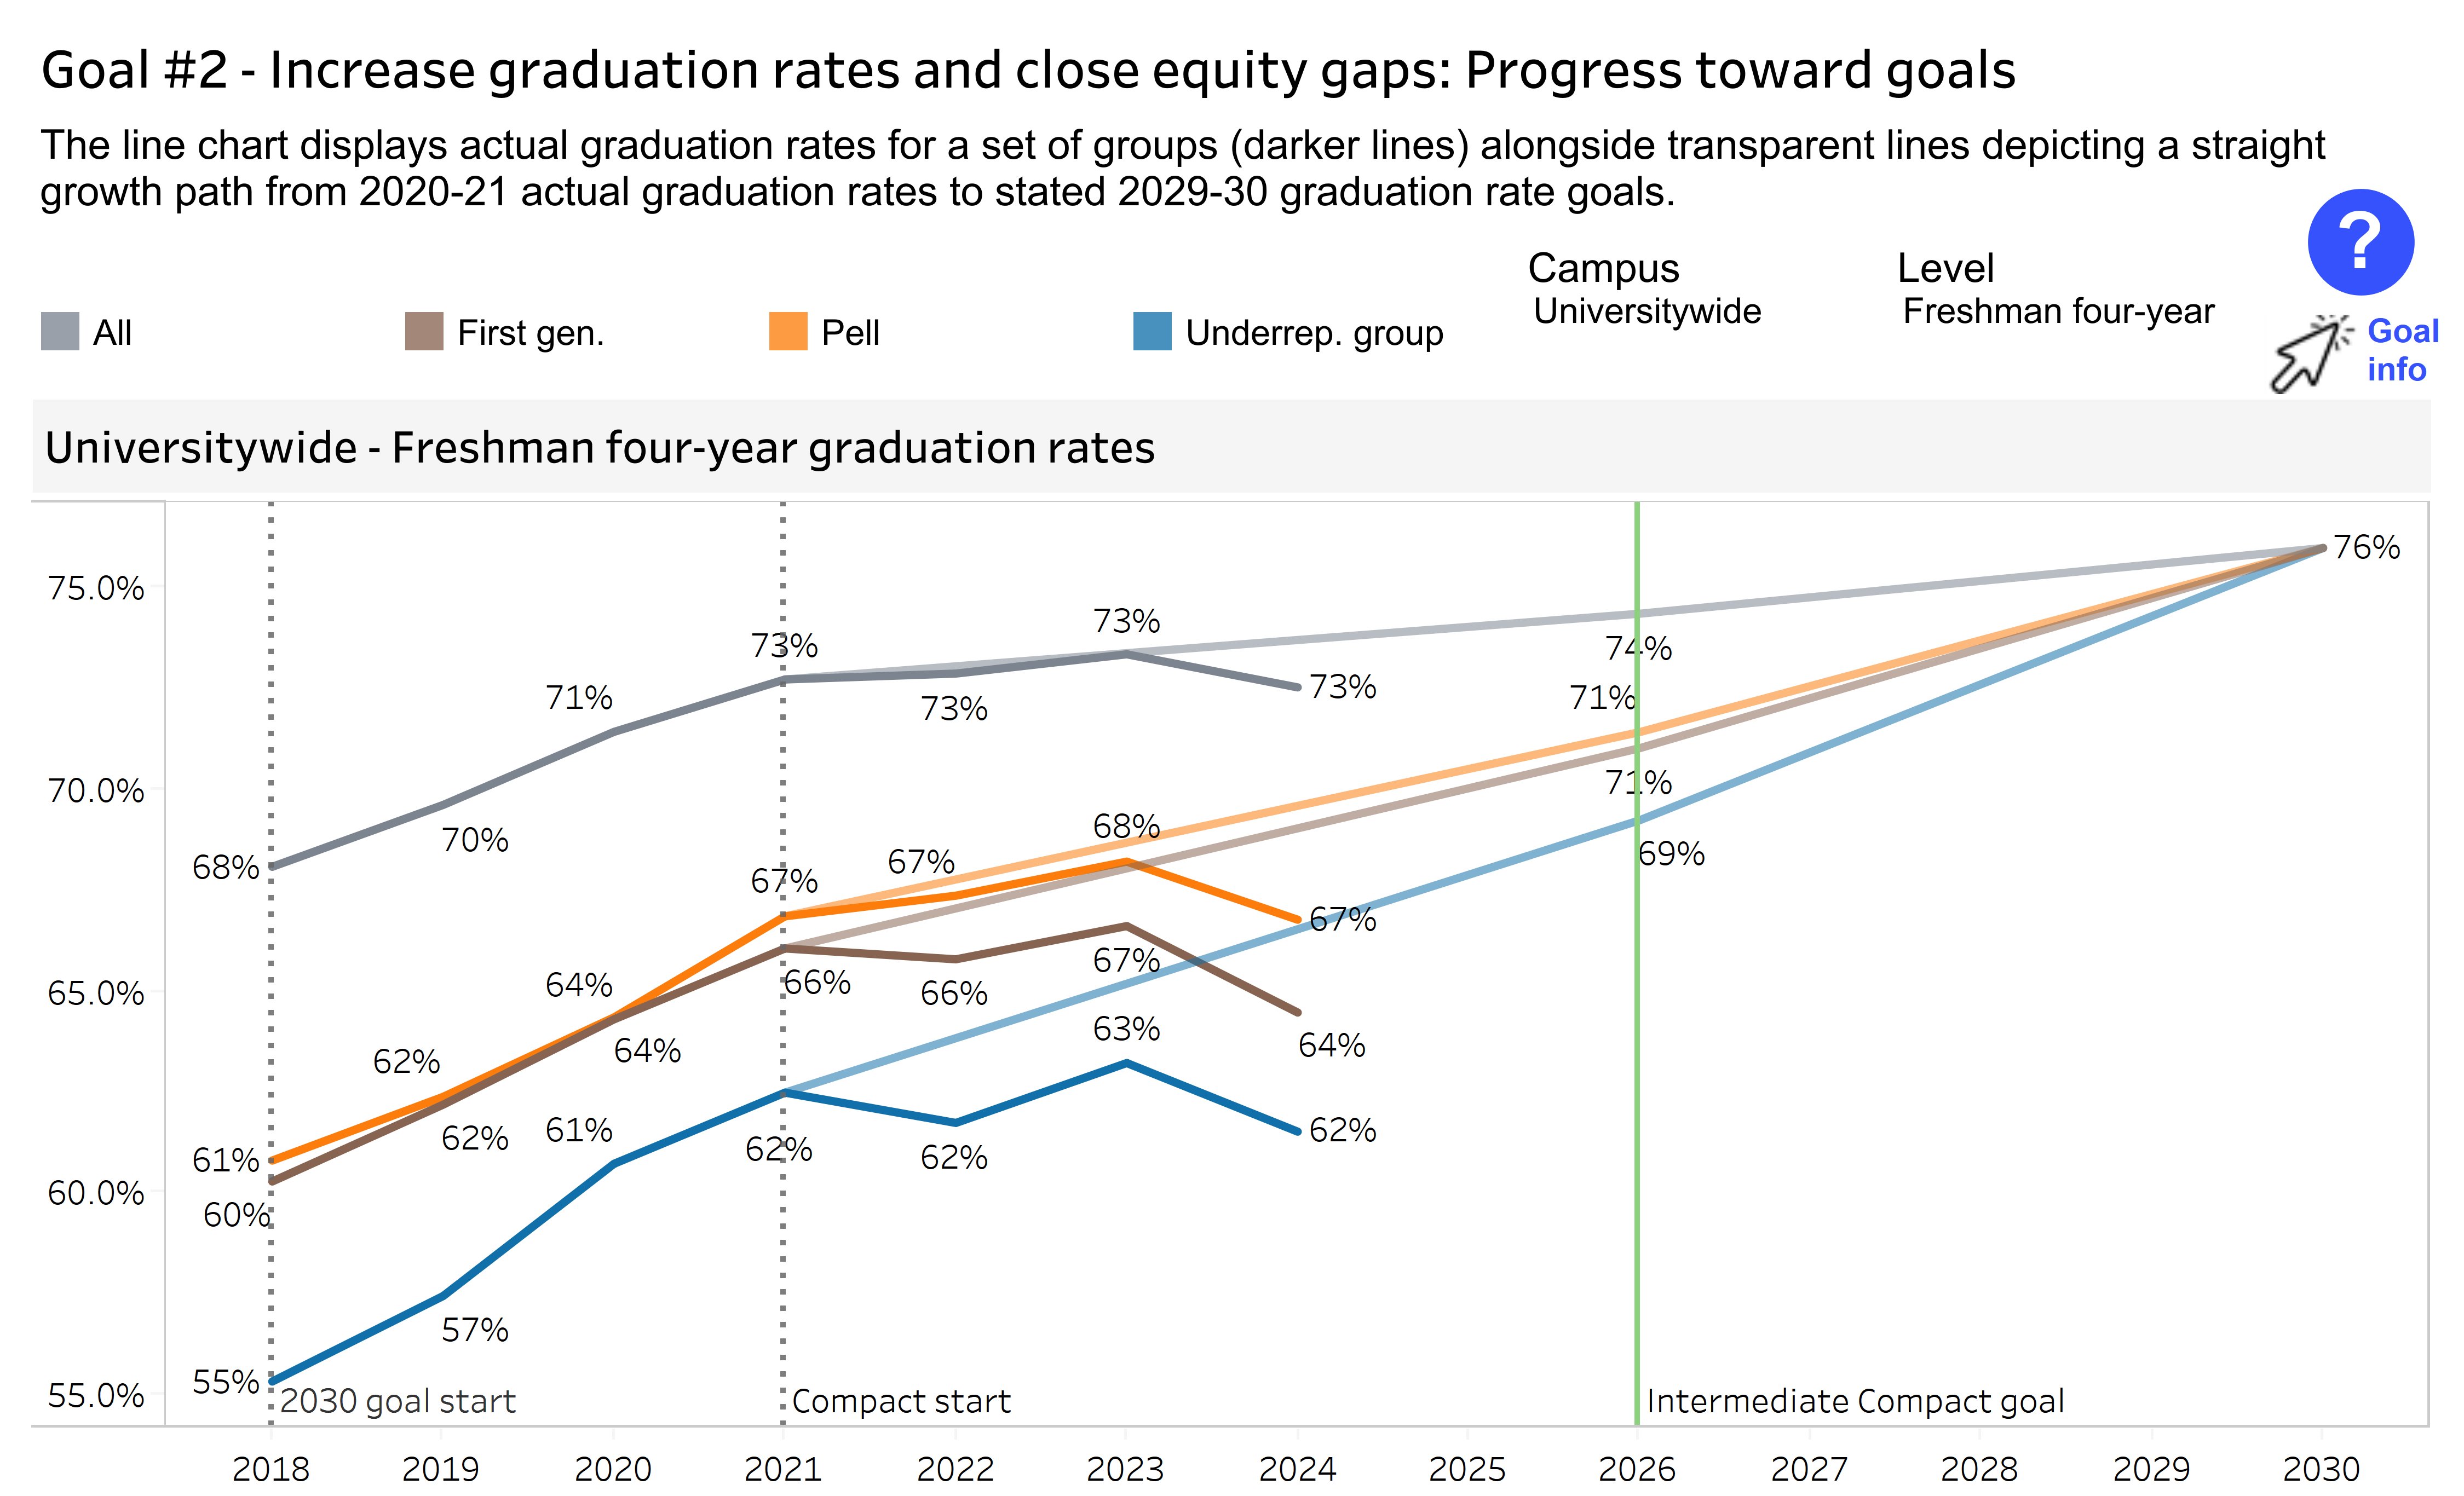
While the overall freshman graduation rate is only three percentage points short of the 2030 graduation rate goal of 76 percent, there is still a sizable gap for Pell Grant recipients, first-generation students, and underrepresented racial/ethnic group (URG) members.
3.1.4 Freshman four-year graduation rates by first generation, Pell, and URG status
UC 2030 goals dashboard
source: UC Information Center
By 2030, UC is looking to eliminate graduation gaps for underrepresented groups and reach a 76 percent graduation rate. Overall, 73 percent of all freshman students graduate within four years. When broken down by freshman student subgroups, 67 percent of Pell Grant recipients, 64 percent of first-generation students, and 62 percent of underrepresented racial/ethnic group (URG, including African American, American Indian, and Hispanic/Latino students) members graduate within four years. All students, regardless of URG status, showed 1-2% decreases in their four-year graduation rates from that of the previous cohort, likely due to the impact of the COVID-19 pandemic.
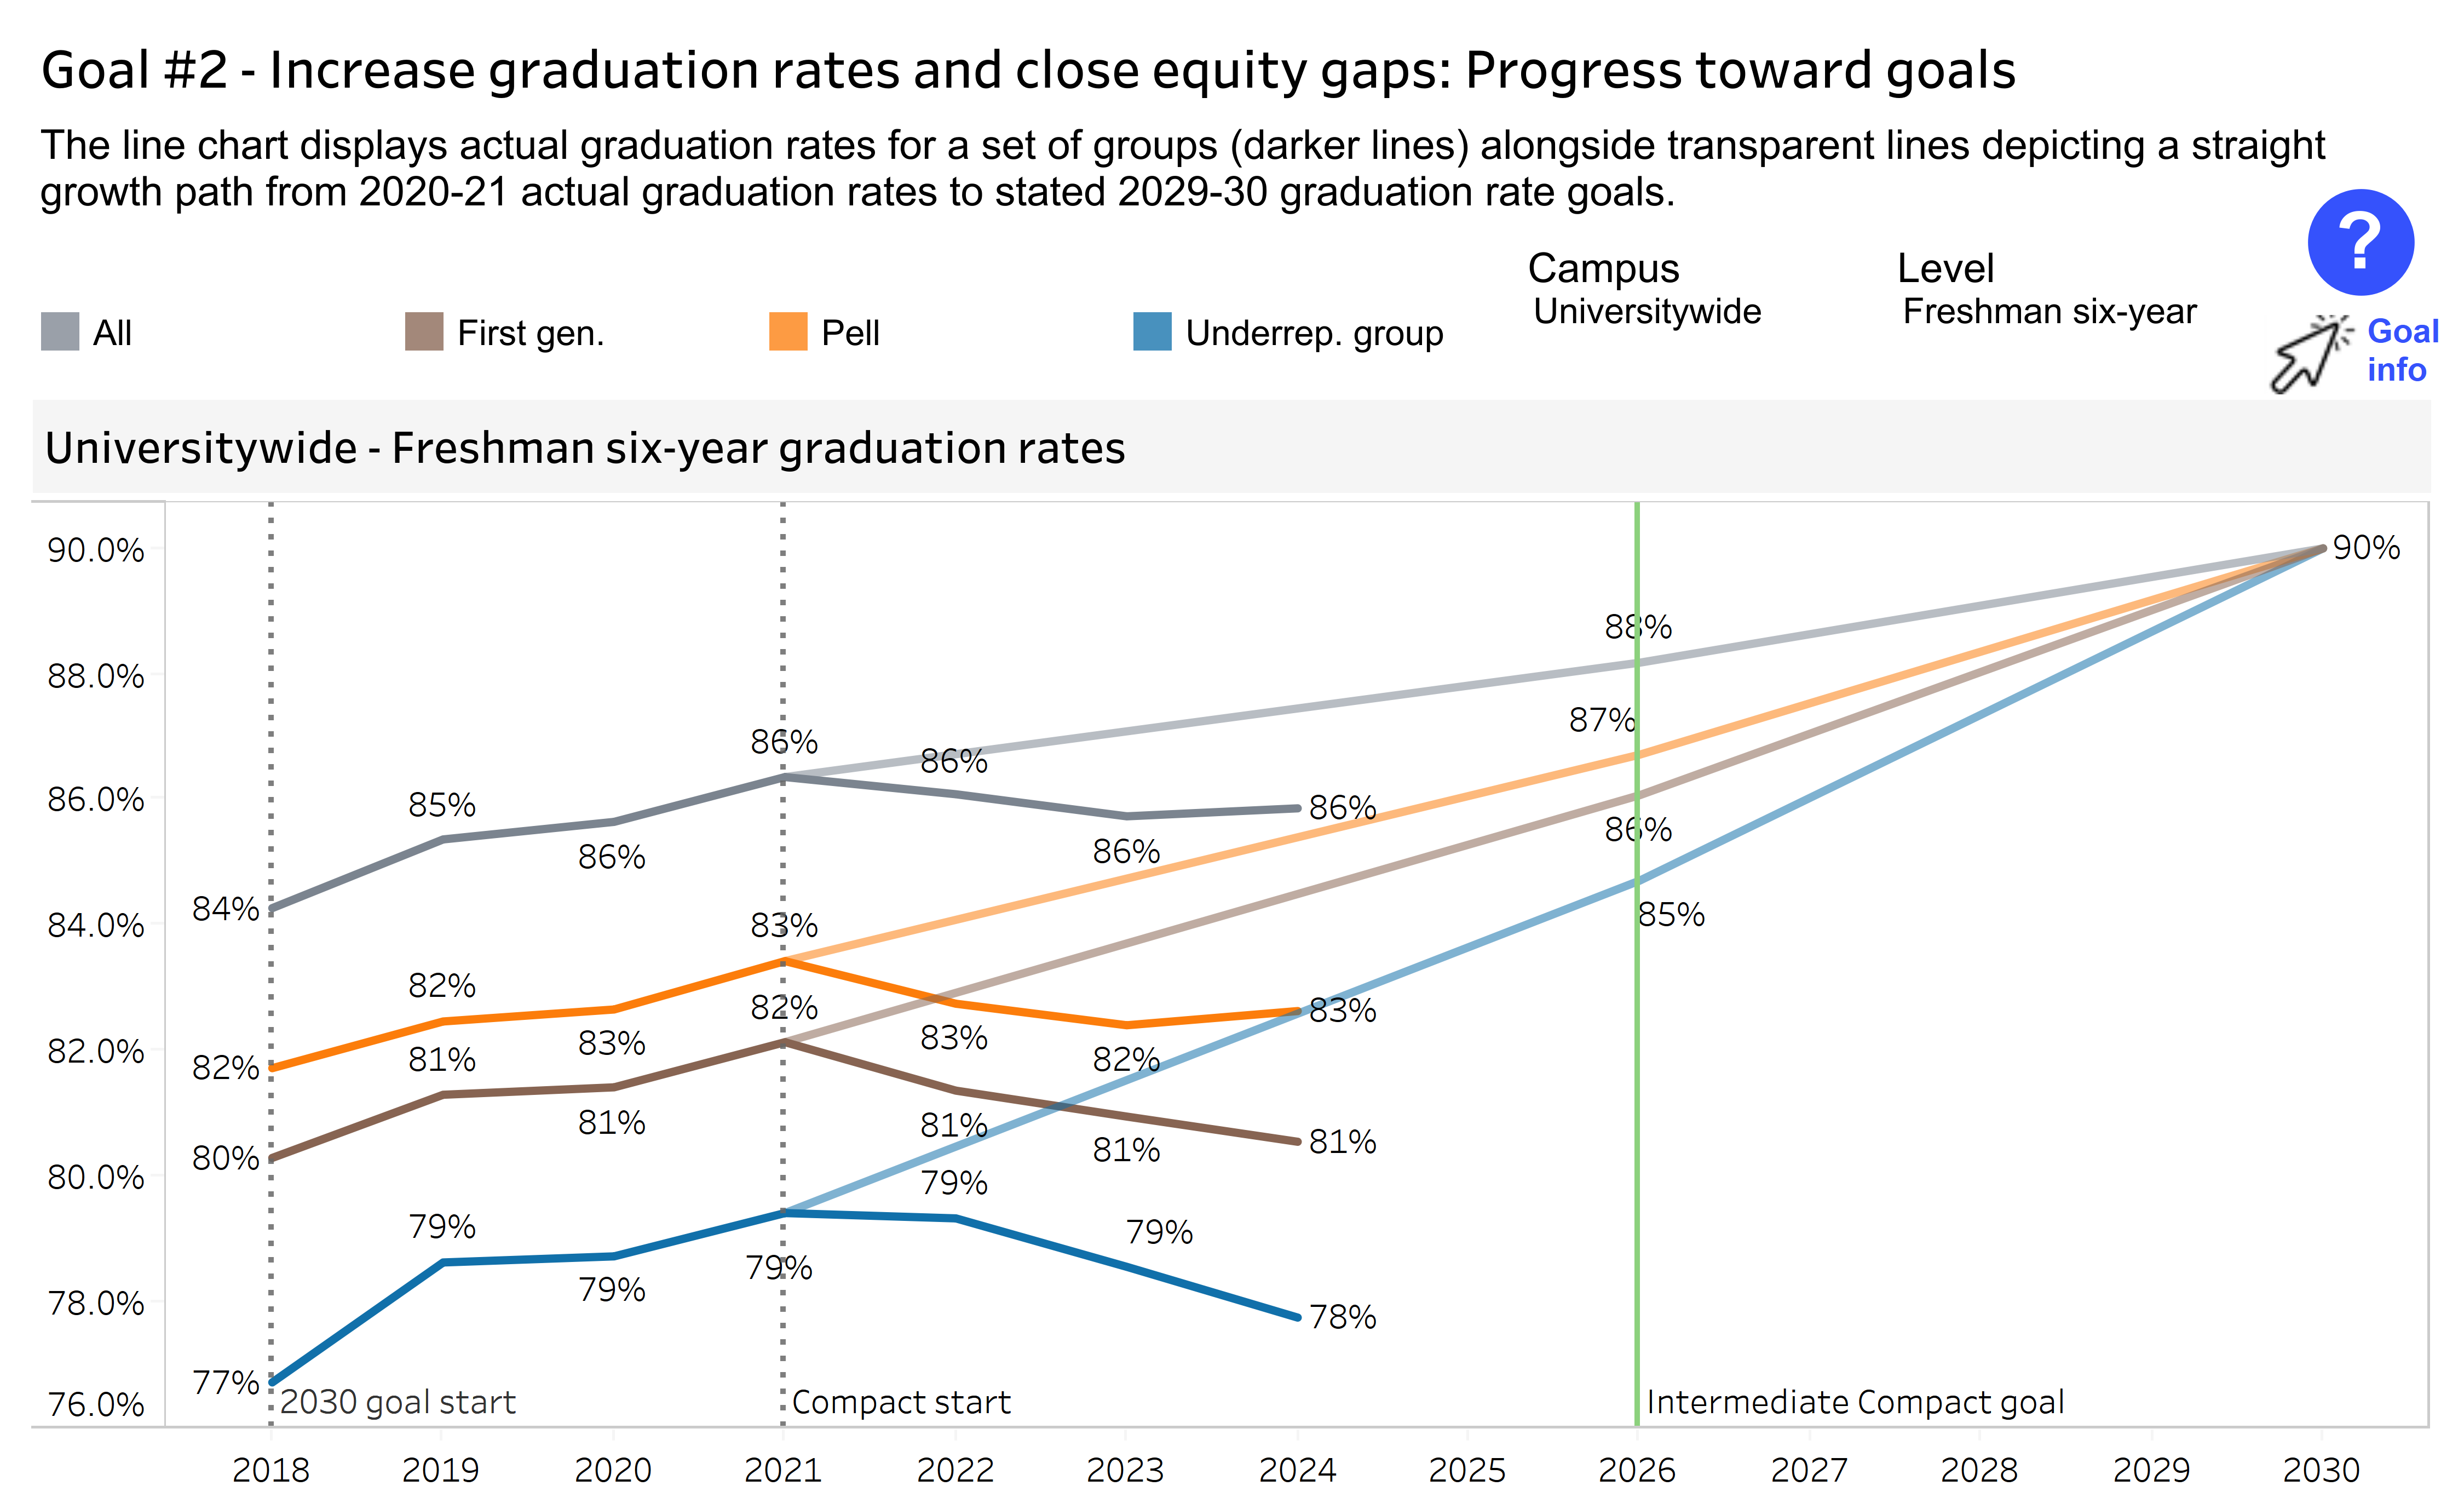
There is only a four-percentage point gap between the current freshman six-year graduation rate and the 2030 graduation rate goal of 90 percent. However, among subgroups, this gap remains between seven and twelve percent.
3.1.5 Freshman six-year graduation rates by first generation, Pell, and URG status
UC 2030 goals dashboard
source: UC Information Center
UC is striving to improve six-year freshman graduation rates to 90 percent by 2030. Graduation rates among freshman, overall, stayed consistent with the previous cohort, remaining at 86 percent. By 2030, UC is looking to eliminate these graduation gaps for underrepresented groups. When broken down by freshman student subgroups, 83 percent of Pell Grant recipients, 81 percent of first-generation students, and 78 percent of underrepresented racial/ethnic group (URG) members graduate within six years. All freshman URGs’ six-year graduation rates declined by less than a percent from that of the previous cohort.
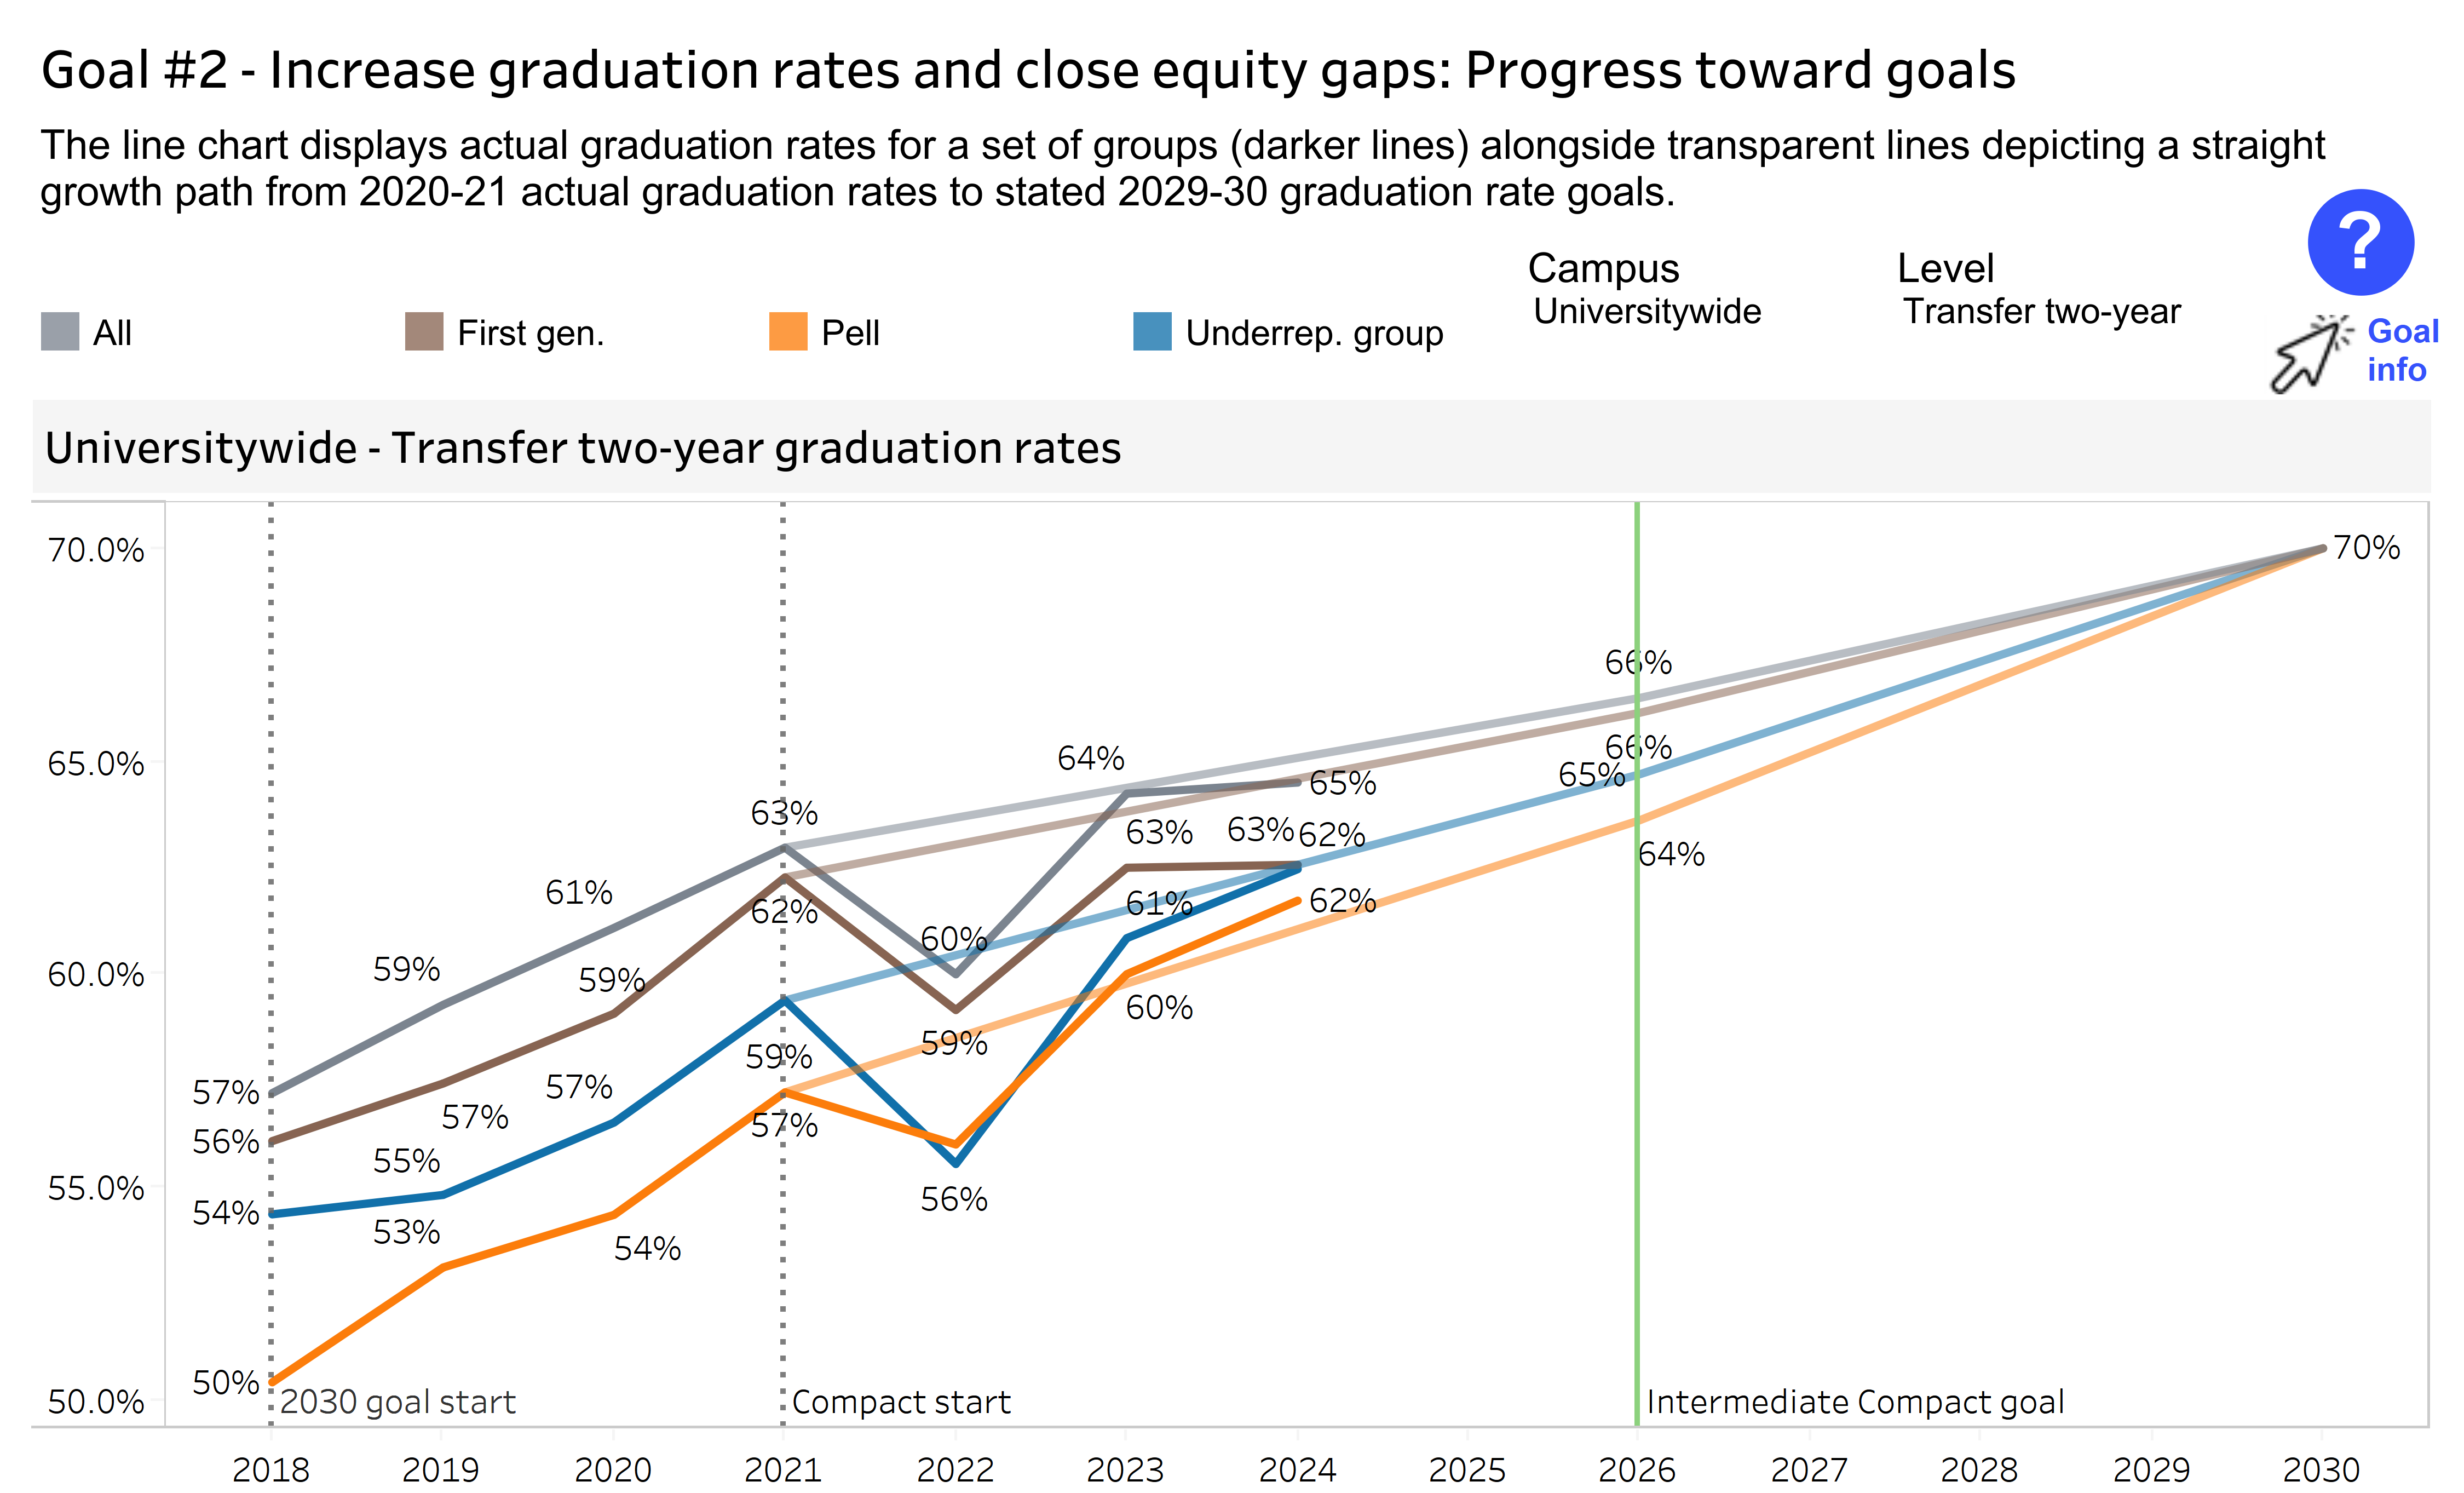
Sixty-five percent of all transfer students graduate within two years, with a small gap for first-generation, Pell Grant recipients, and underrepresented racial/ethnic group members (URG) compared to the overall transfer student population.
3.1.6 Transfer two-year graduation rates by first generation, Pell, and URG status
UC 2030 goals dashboard
source: UC Information Center
UC is striving to improve the two-year transfer graduation rates to 70 percent by 2030. Additionally, by 2030, UC is looking to eliminate transfer graduation gaps for underrepresented groups. Overall, transfer students have a 65 percent two-year graduation rate, but when broken down by transfer student subgroups, 62 percent of Pell Grant recipients, 63 percent of first-generation students, and 62 percent of underrepresented racial/ethnic group (URG) members graduate within two years. All URGs remained consistent or increased their two-year graduation rates from that of the previous cohort.
3.1 GRADUATION RATES
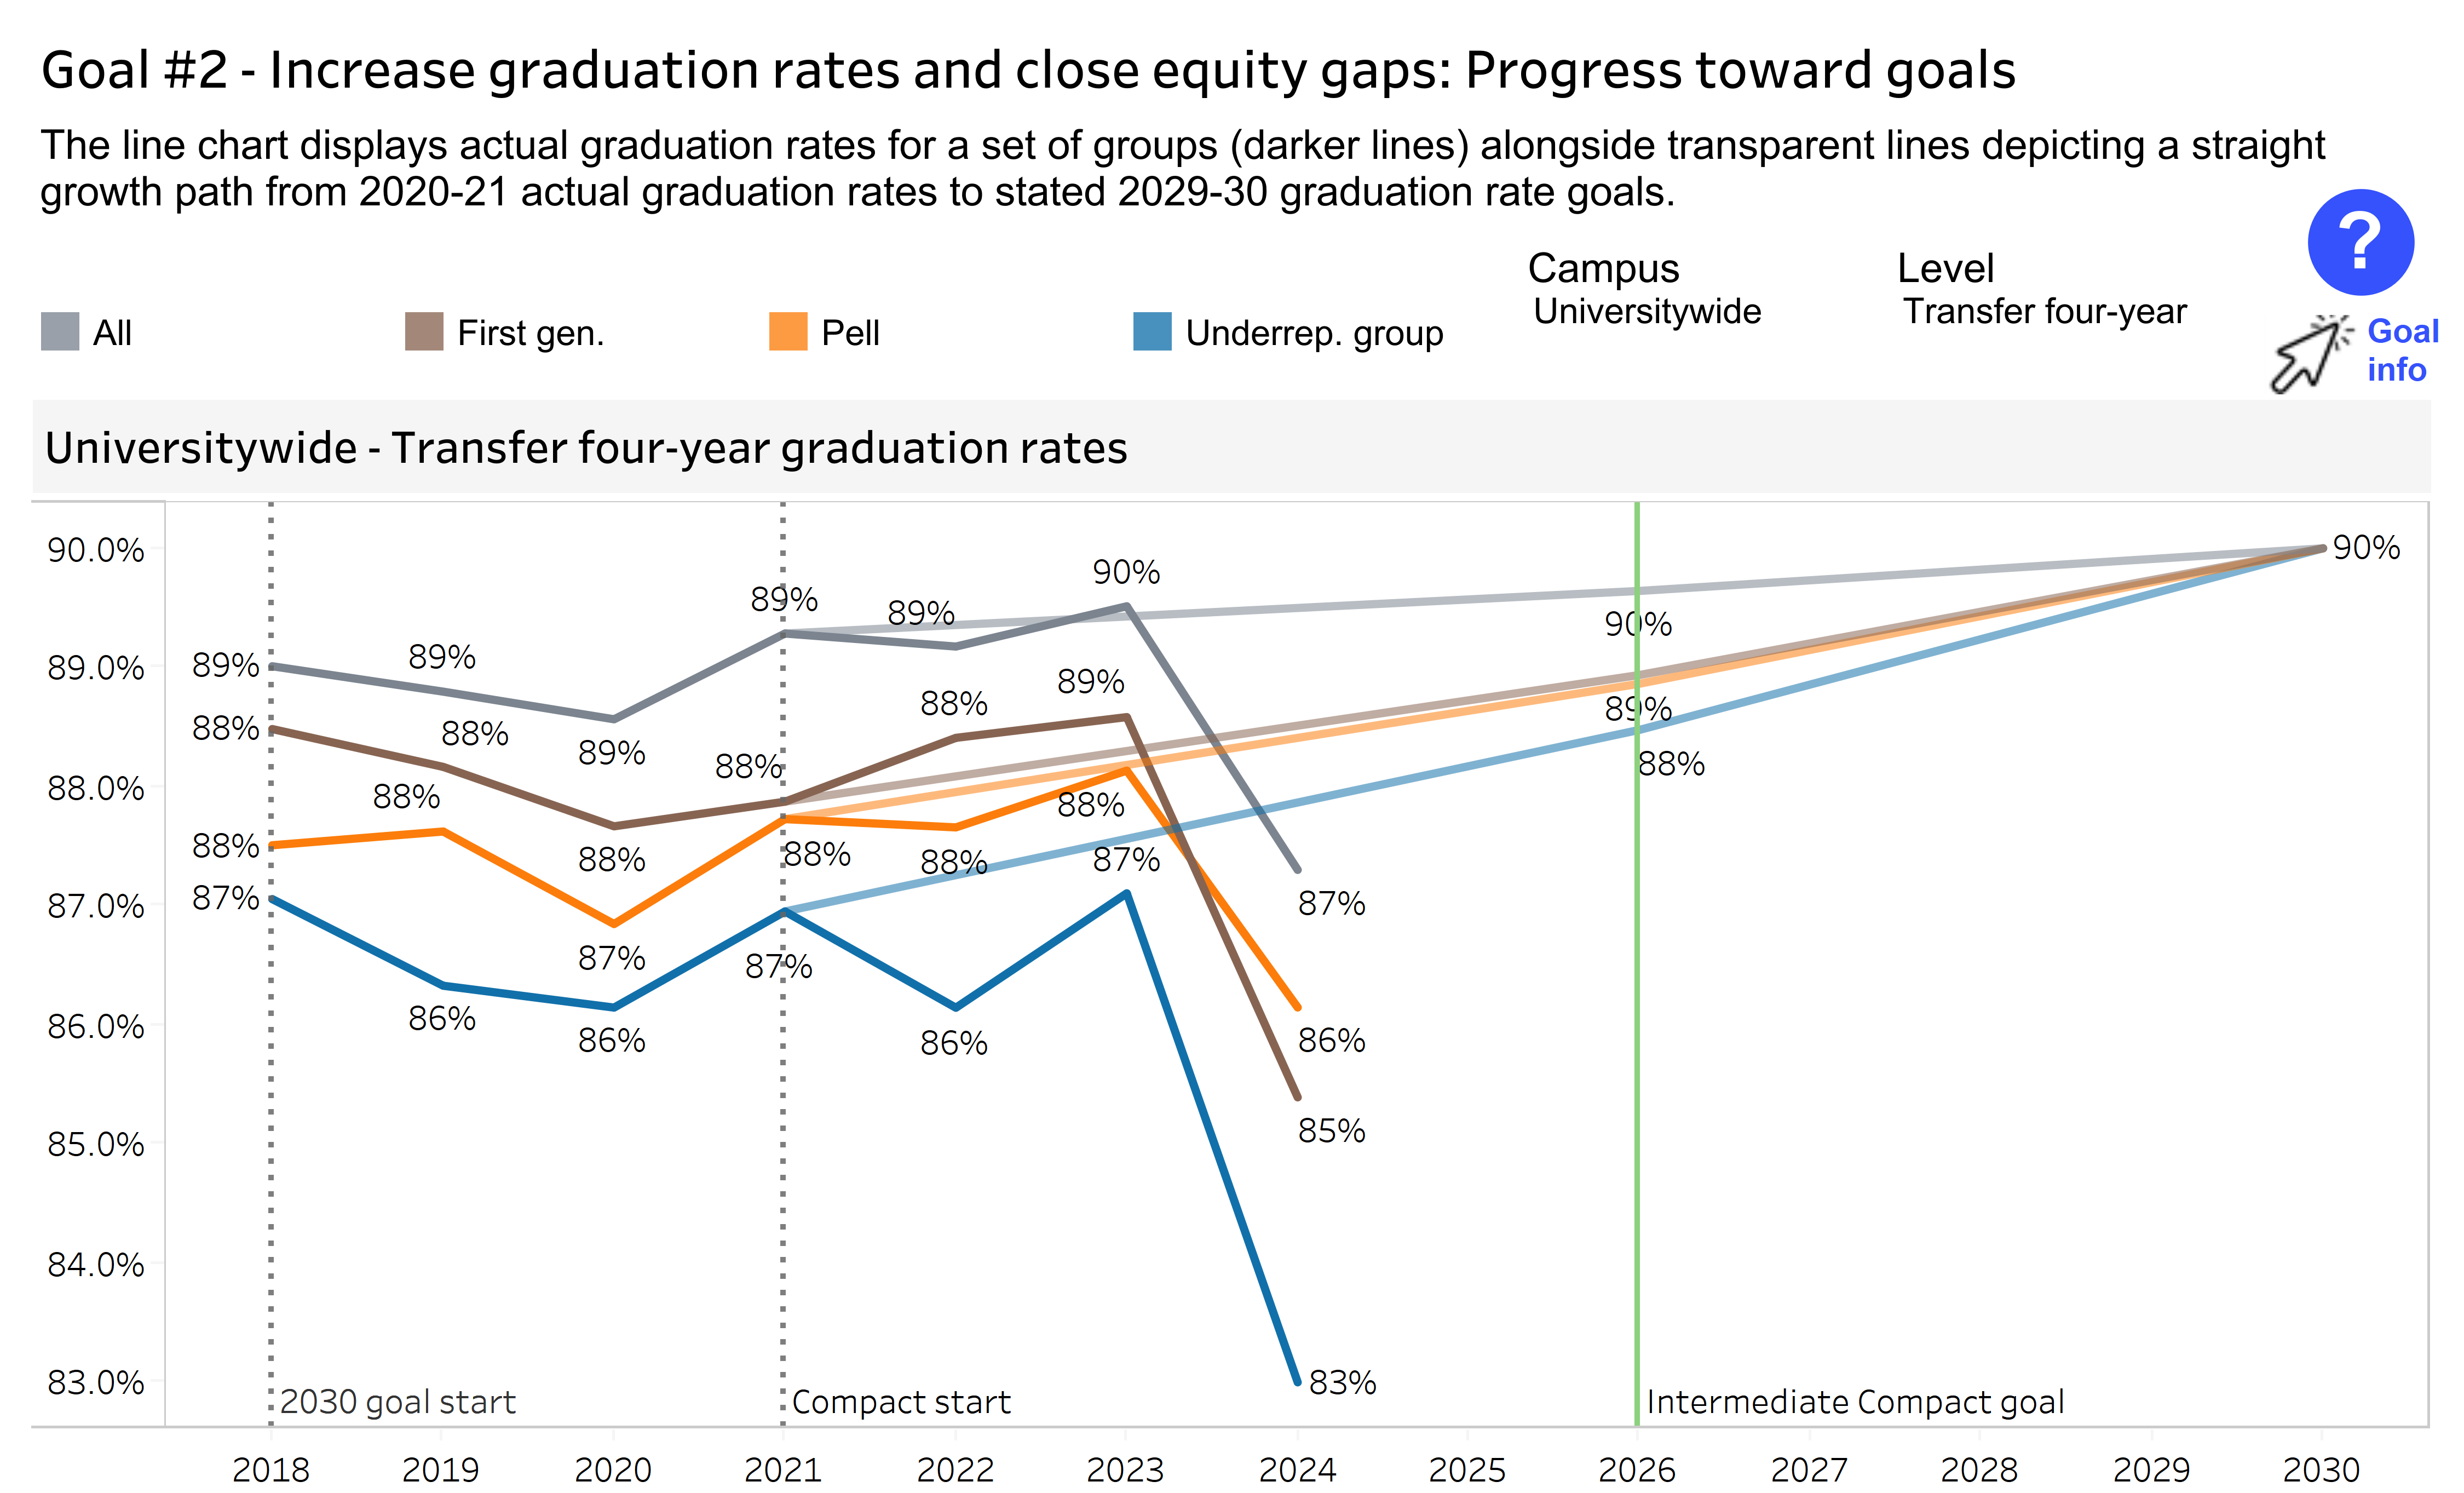
Eighty-seven percent of all transfer students graduate within four years. Overall, the transfer four-year graduation rate is within three percent of the 2030 goal and student subgroups remain between four and seven percentage points away from the goal.
3.1.7 Transfer four-year graduation rates by first generation, Pell, and URG status
UC 2030 goals dashboard
soource: UC Information Center
UC is striving to improve four-year transfer graduation rates to 90 percent by 2030 and is looking to eliminate graduation gaps for underrepresented groups. When broken down by transfer student subgroups, 86 percent of Pell Grant recipients, 85 percent of first-generation students, and 83 percent of underrepresented racial/ethnic group members (URG) graduate within four years. All transfer students, regardless of URG status, showed three to five percent decreases in their four-year graduation rates from that of the previous cohort. The most recent cohort was in community colleges during the pandemic and the drop shows the impact of the COVID-19 pandemic. The prior indicator shows a similar drop for the 2022 two-year graduation rates. A rebound in four-year graduation rates is expected for future cohorts.
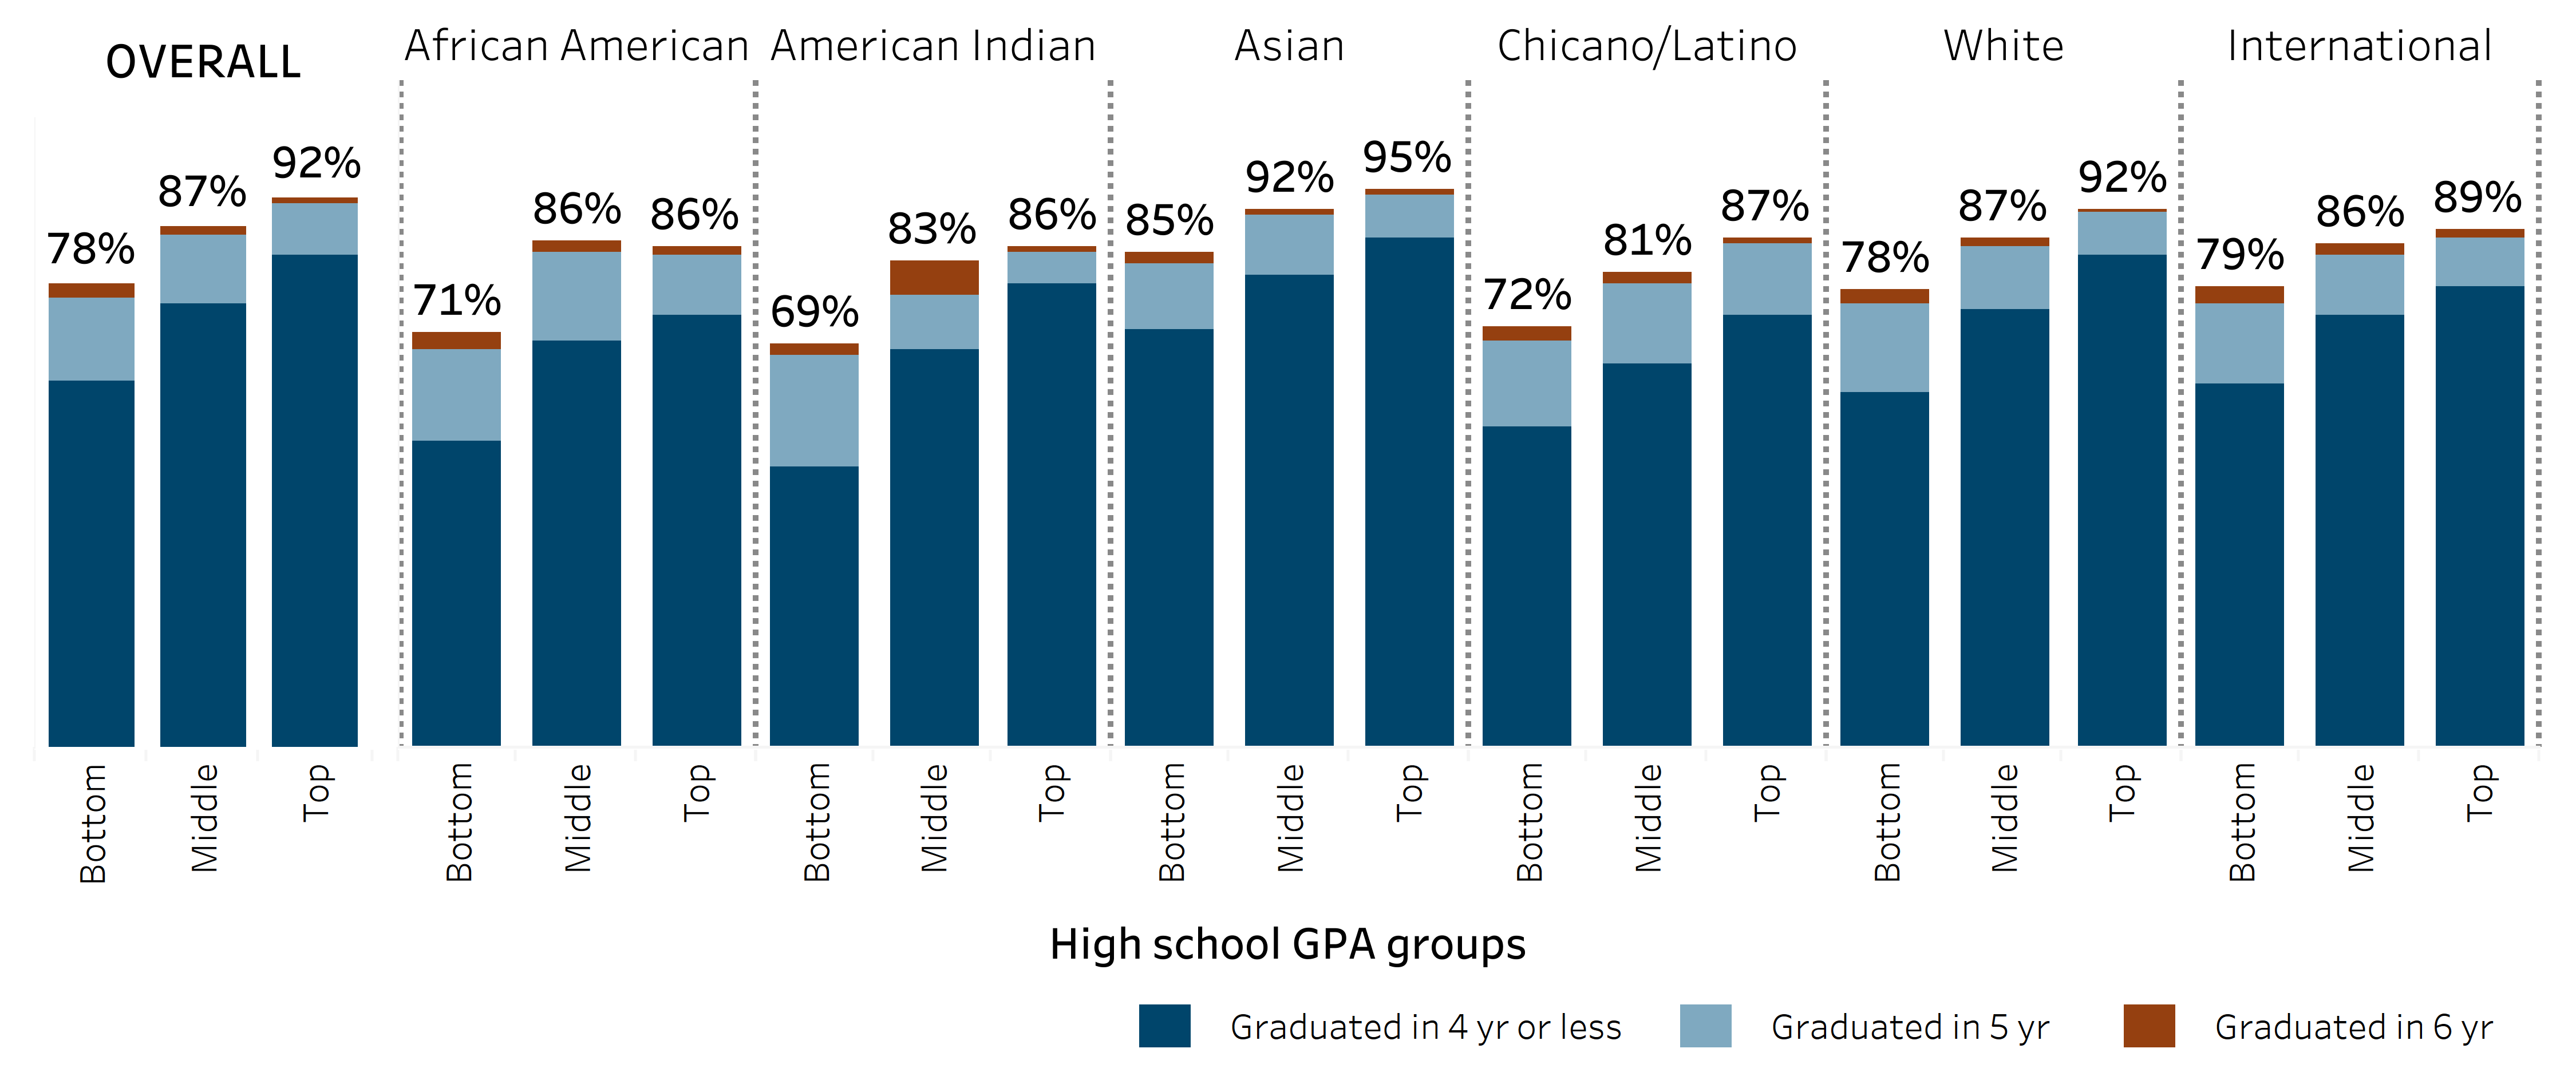
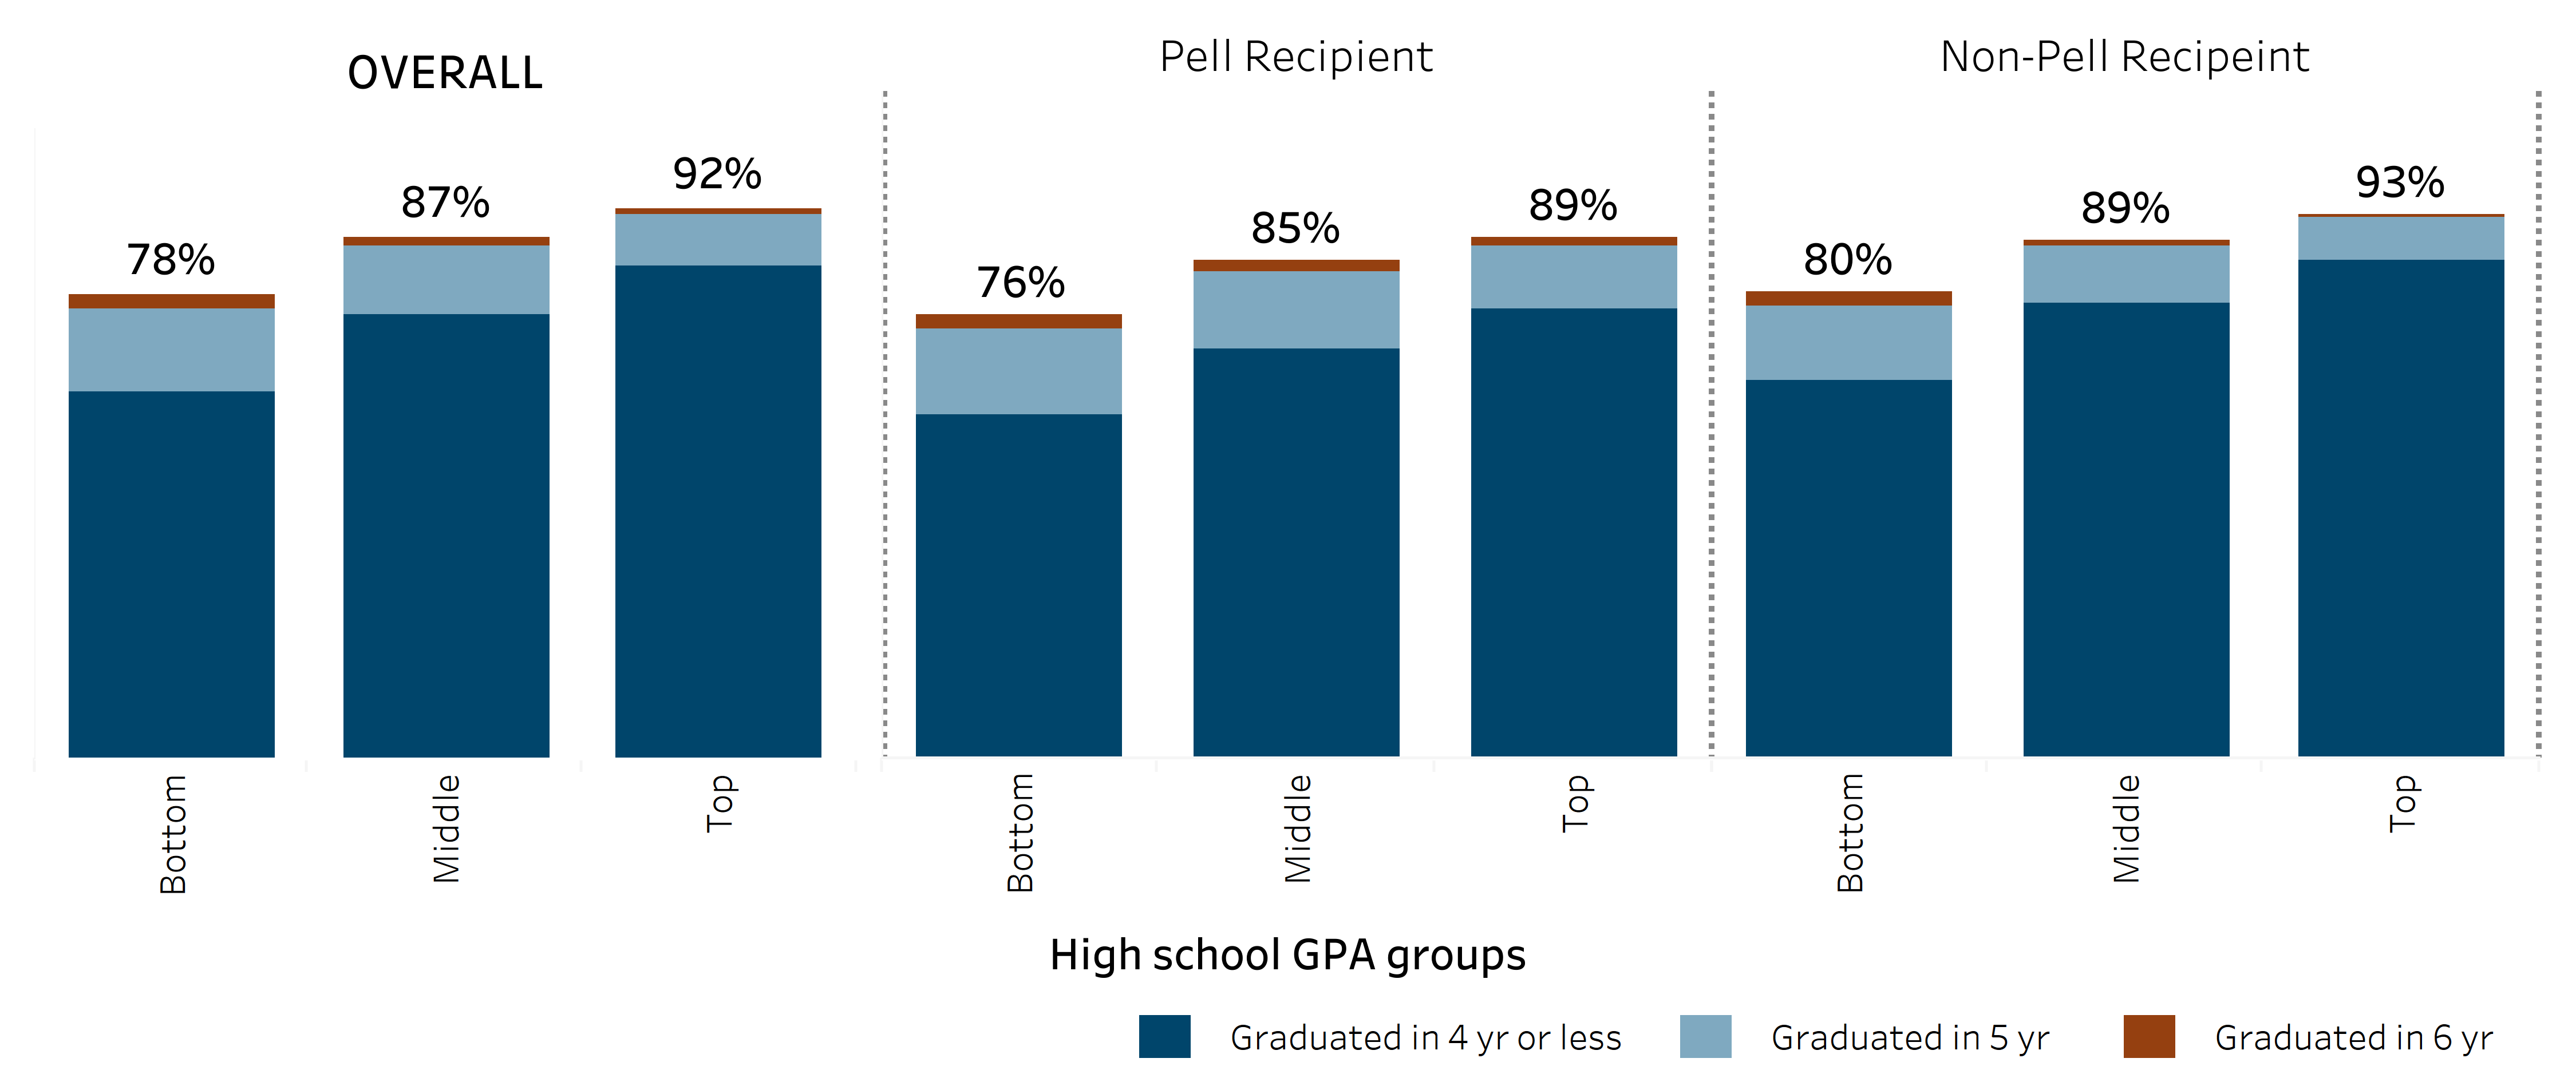
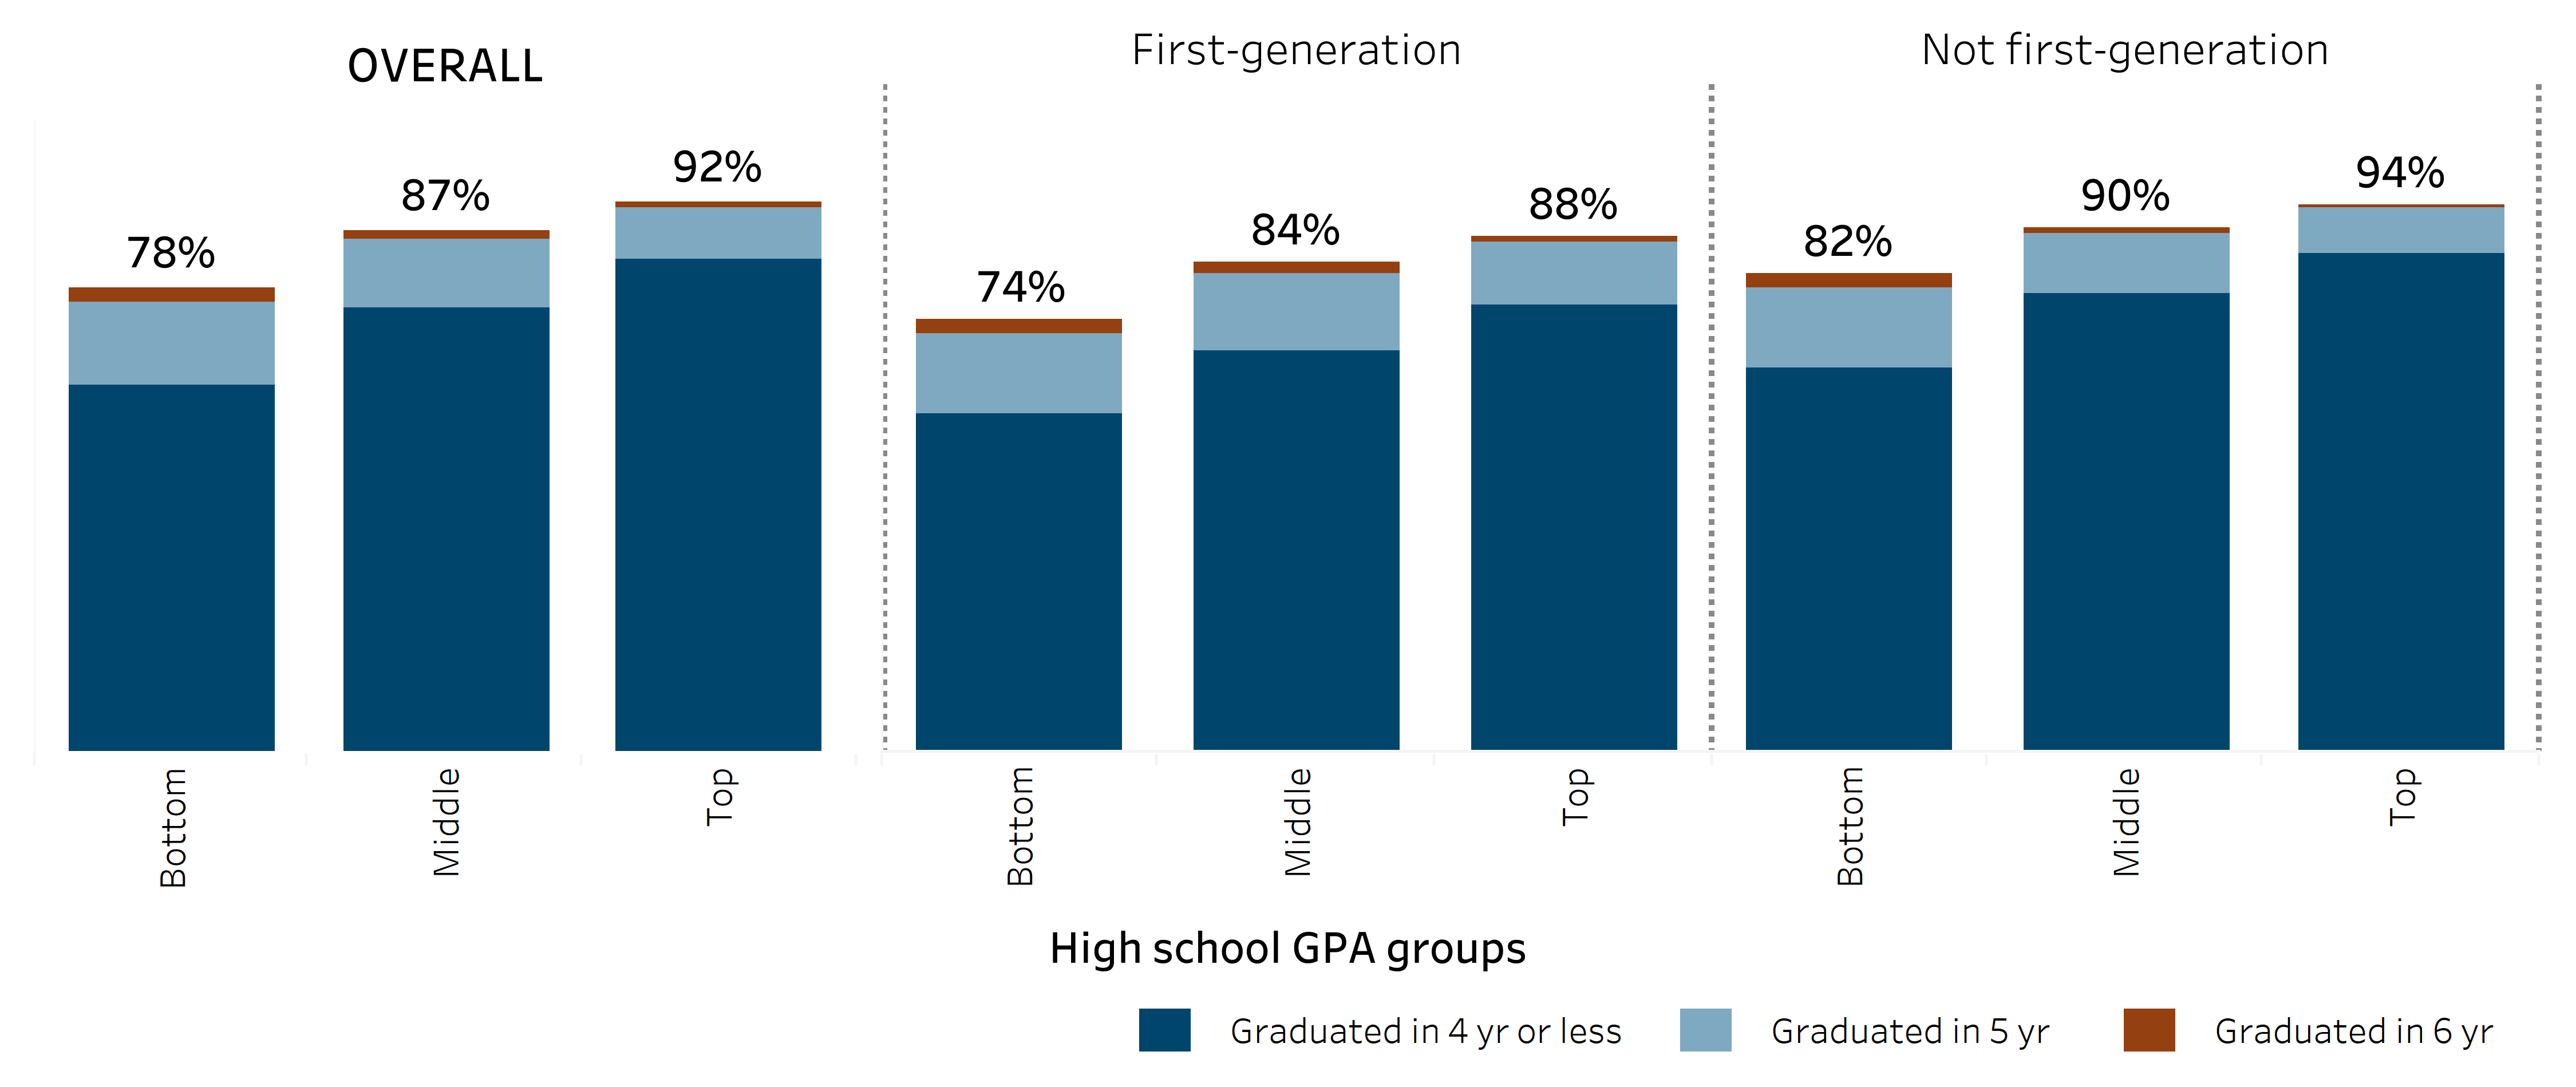
Academic preparation explains more of the difference in freshman graduation rates than race/ethnicity, Pell recipient status, or first-generation status alone.
3.1.8 Freshman graduation rates by HS GPA (top, middle, and bottom thirds) and race/ethnicity, Pell Grant recipient status, and first-generation status, Universitywide, Cohort entering fall 2017
source: UC Information Center
Larger differences in graduation rates are explained by high school unweighted grade point average (GPA), which is used as a proxy measure for academic preparation of entering freshmen students. The within-group gaps for graduation rates between the lowest GPA category (“bottom third”) and highest GPA category (“top third”) are much wider than the gaps between groups when comparing the same GPA categories.
It is important to note that while more of the difference is explained by academic preparedness, there are still main effects observed by race/ethnicity, Pell grant recipient status, and first-generation status, regardless of academic preparedness.
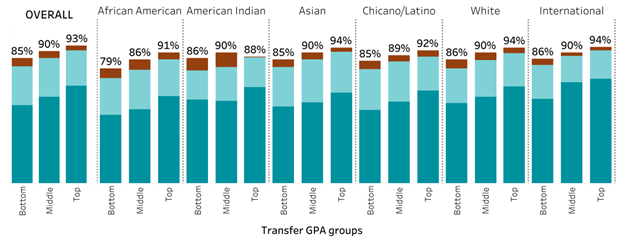
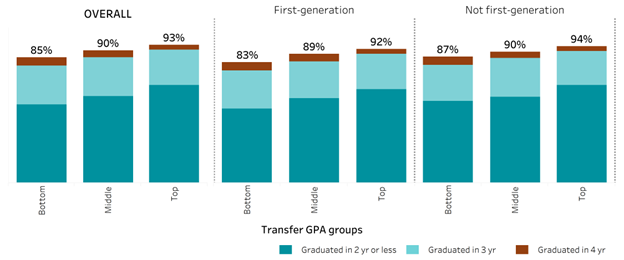
Academic preparation explains more of the difference in transfer graduation rates than race/ethnicity, Pell recipient status, or first-generation status alone.
3.1.9 Transfer graduation rates by incoming transfer GPA (top, middle, and bottom thirds) and race/ethnicity,
Pell Grant recipient status, and first-generation status, Universitywide, for cohort entering fall 2019
source: UC Information Center
Larger differences in graduation rates are explained by transfer grade point average (GPA). The within-group gaps for graduation rates between the lowest GPA category (“bottom third”) and highest GPA category (“top third”) are wider than the gaps between groups when comparing the same GPA categories.
Academic preparation is an important factor to consider for those who seek to eliminate equity gaps in graduation rates and may help campuses create preemptive initiatives for students in their first year on campus.
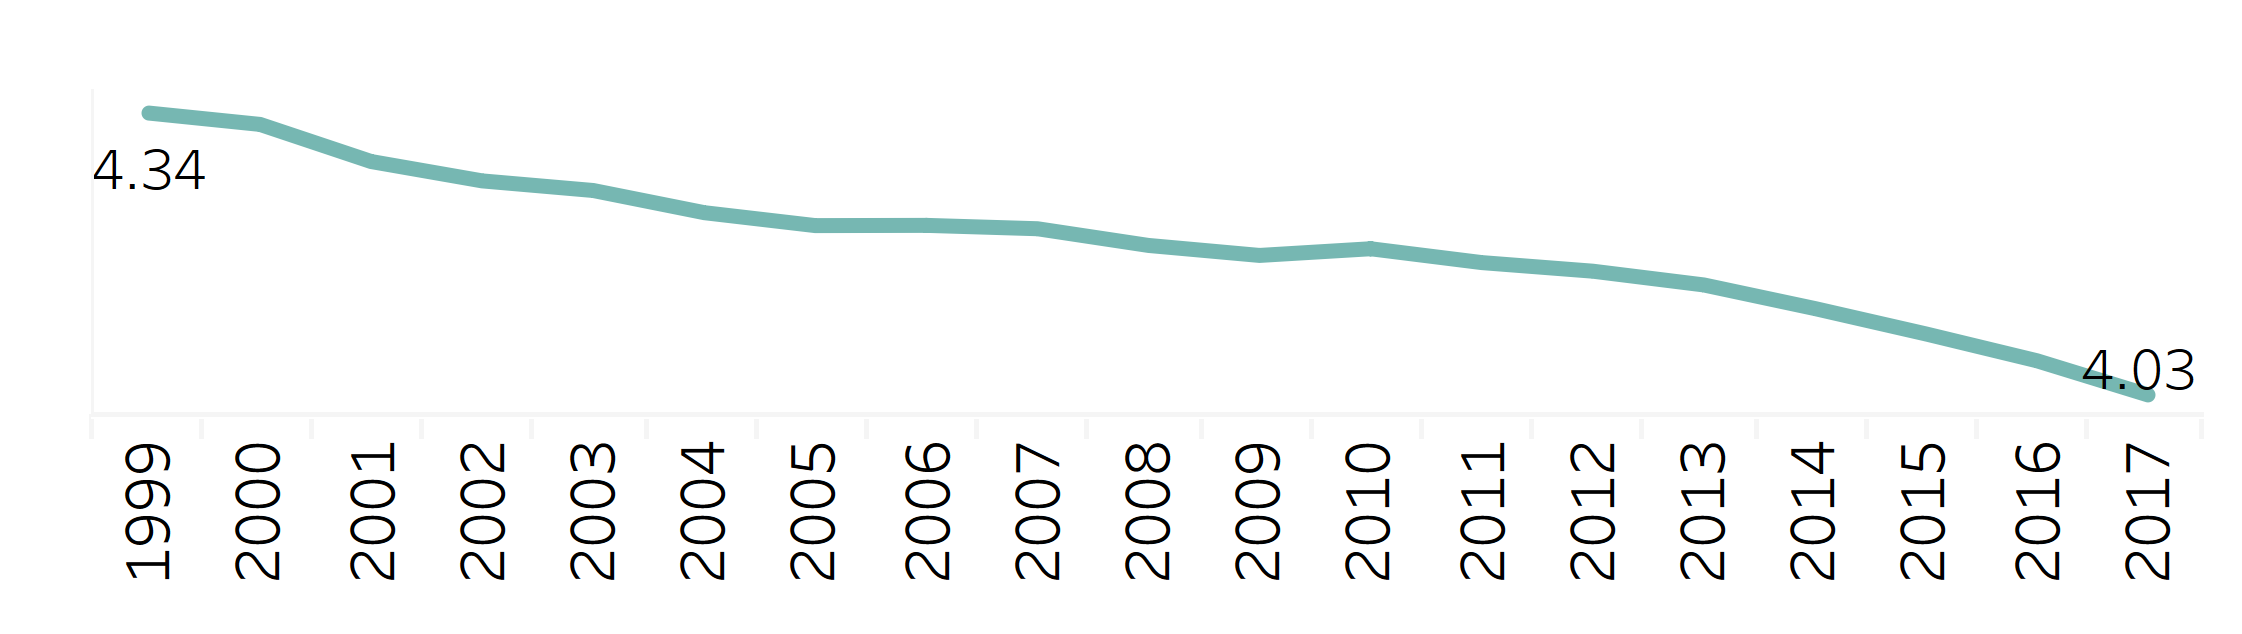
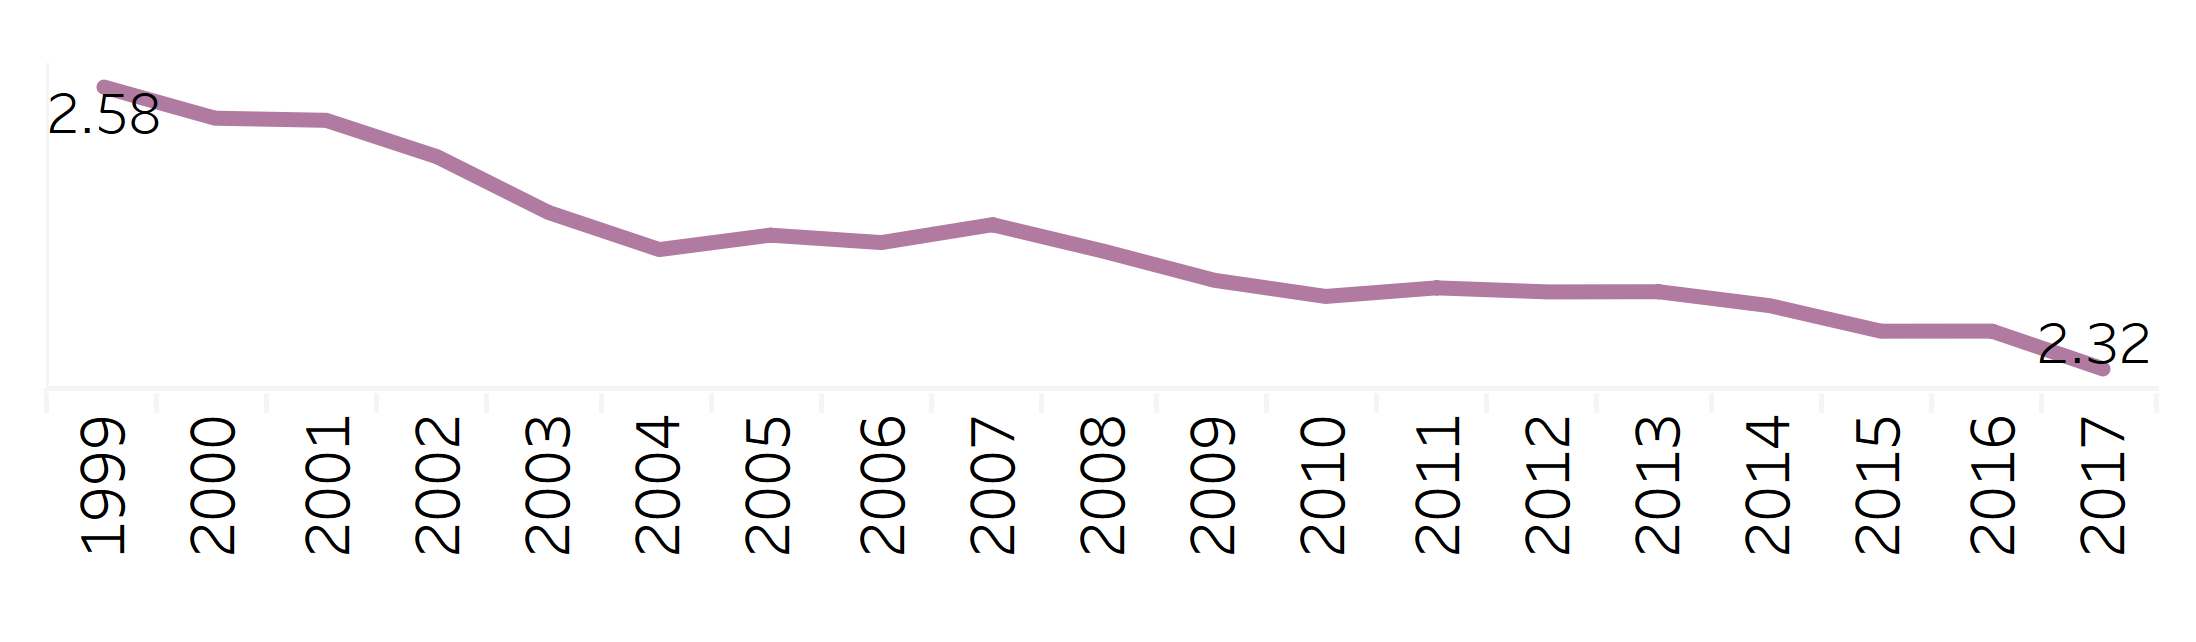
Undergraduate students at UC are graduating more quickly than in previous years with freshmen taking, on average, 4.03 years to complete their degree and transfer students taking 2.32 years to complete their degree.
3.1.10a Freshman average time to degree, Universitywide
Undergraduate graduation rates dashboard
source: UC Information Center
3.1.10b Transfer average time to degree, Universitywide
Undergraduate graduation rates dashboard
source: UC Information Center
The average time to earn a bachelor’s degree at UC has decreased fairly steadily since 1999. Students entering as freshmen in 2017 took an average of 4.03 years, down from 4.34 years in 1999.
For students entering as transfers, the average time to degree is 2.32 years, down from 2.58 years in 1999.
Note: Average time to graduation only includes students who graduated from UC within seven years.
3.2 RETENTION RATES
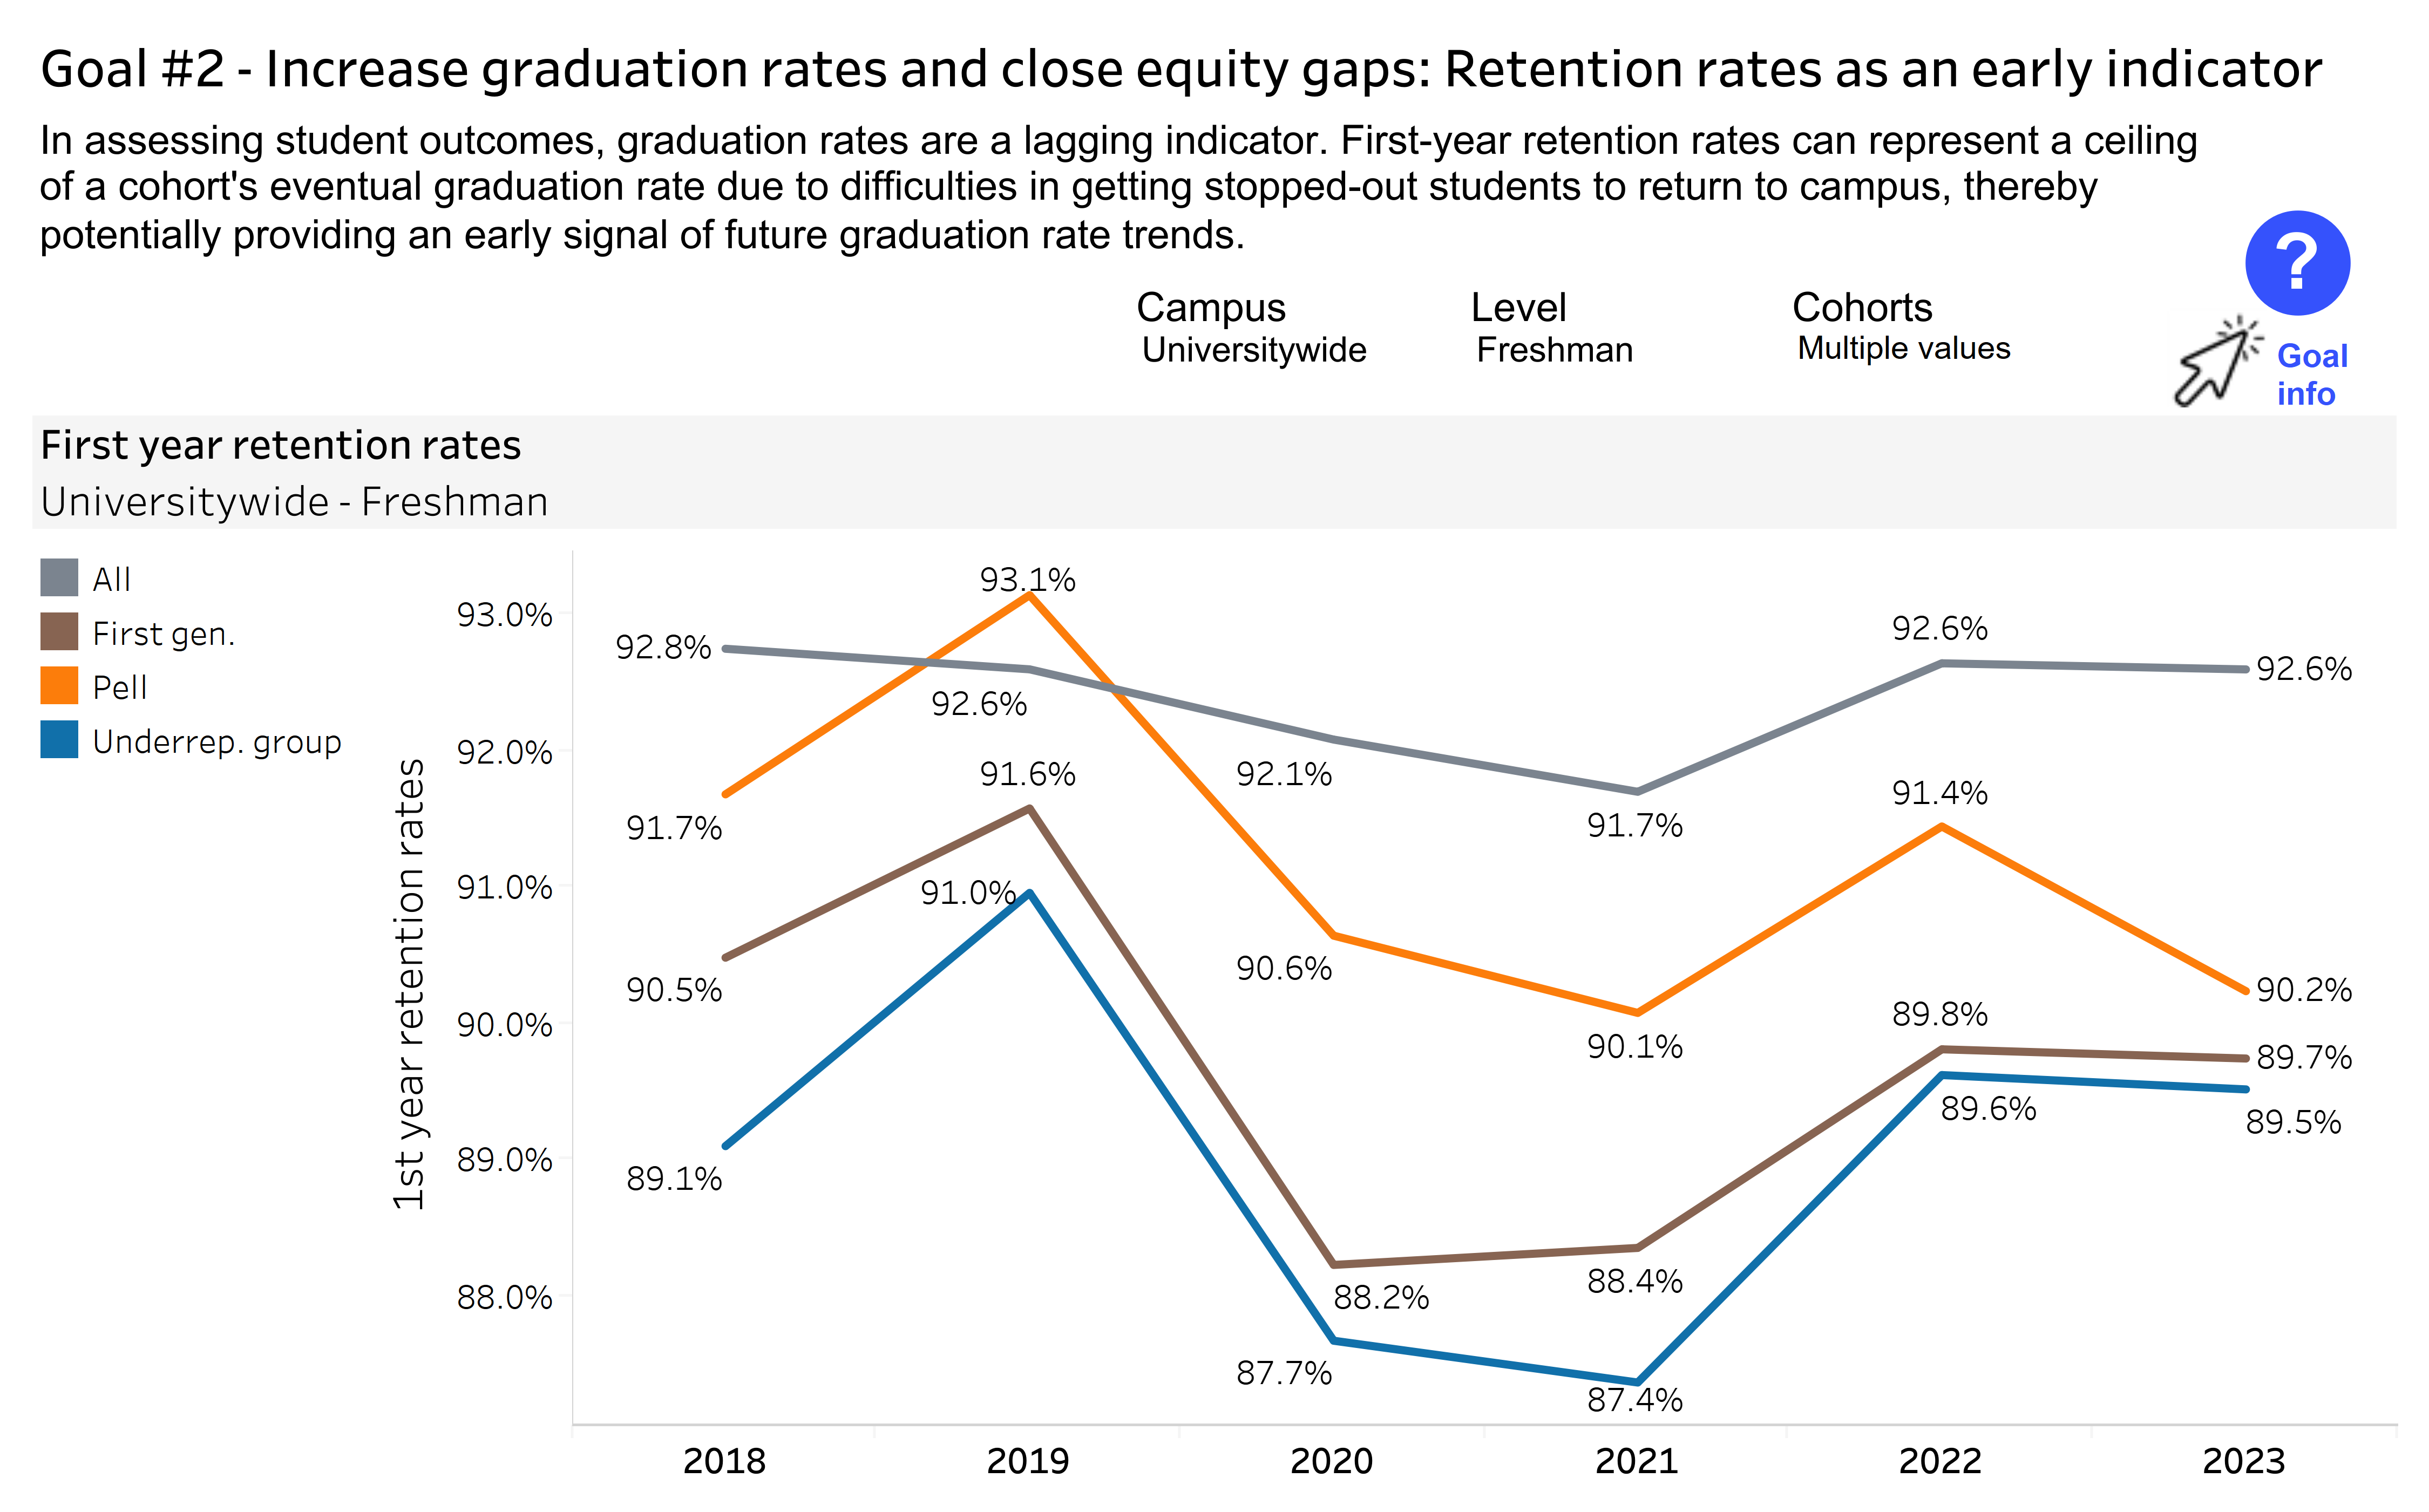
Retention rates are high, at 93 and 94 percent for freshman and transfer students, rebounding after a drop in retention rates seen during the COVID-19 pandemic. Among subgroups we see a difference of up to three percentage points for freshman students and less than one percentage points for transfer students.
3.2.1a First year freshman retention rate by first generation, Pell, and URG status
UC 2030 goals dashboard
source: UC Information Center
3.2.1b First year transfer retention rate by first generation, Pell, and URG status
UC 2030 goals dashboard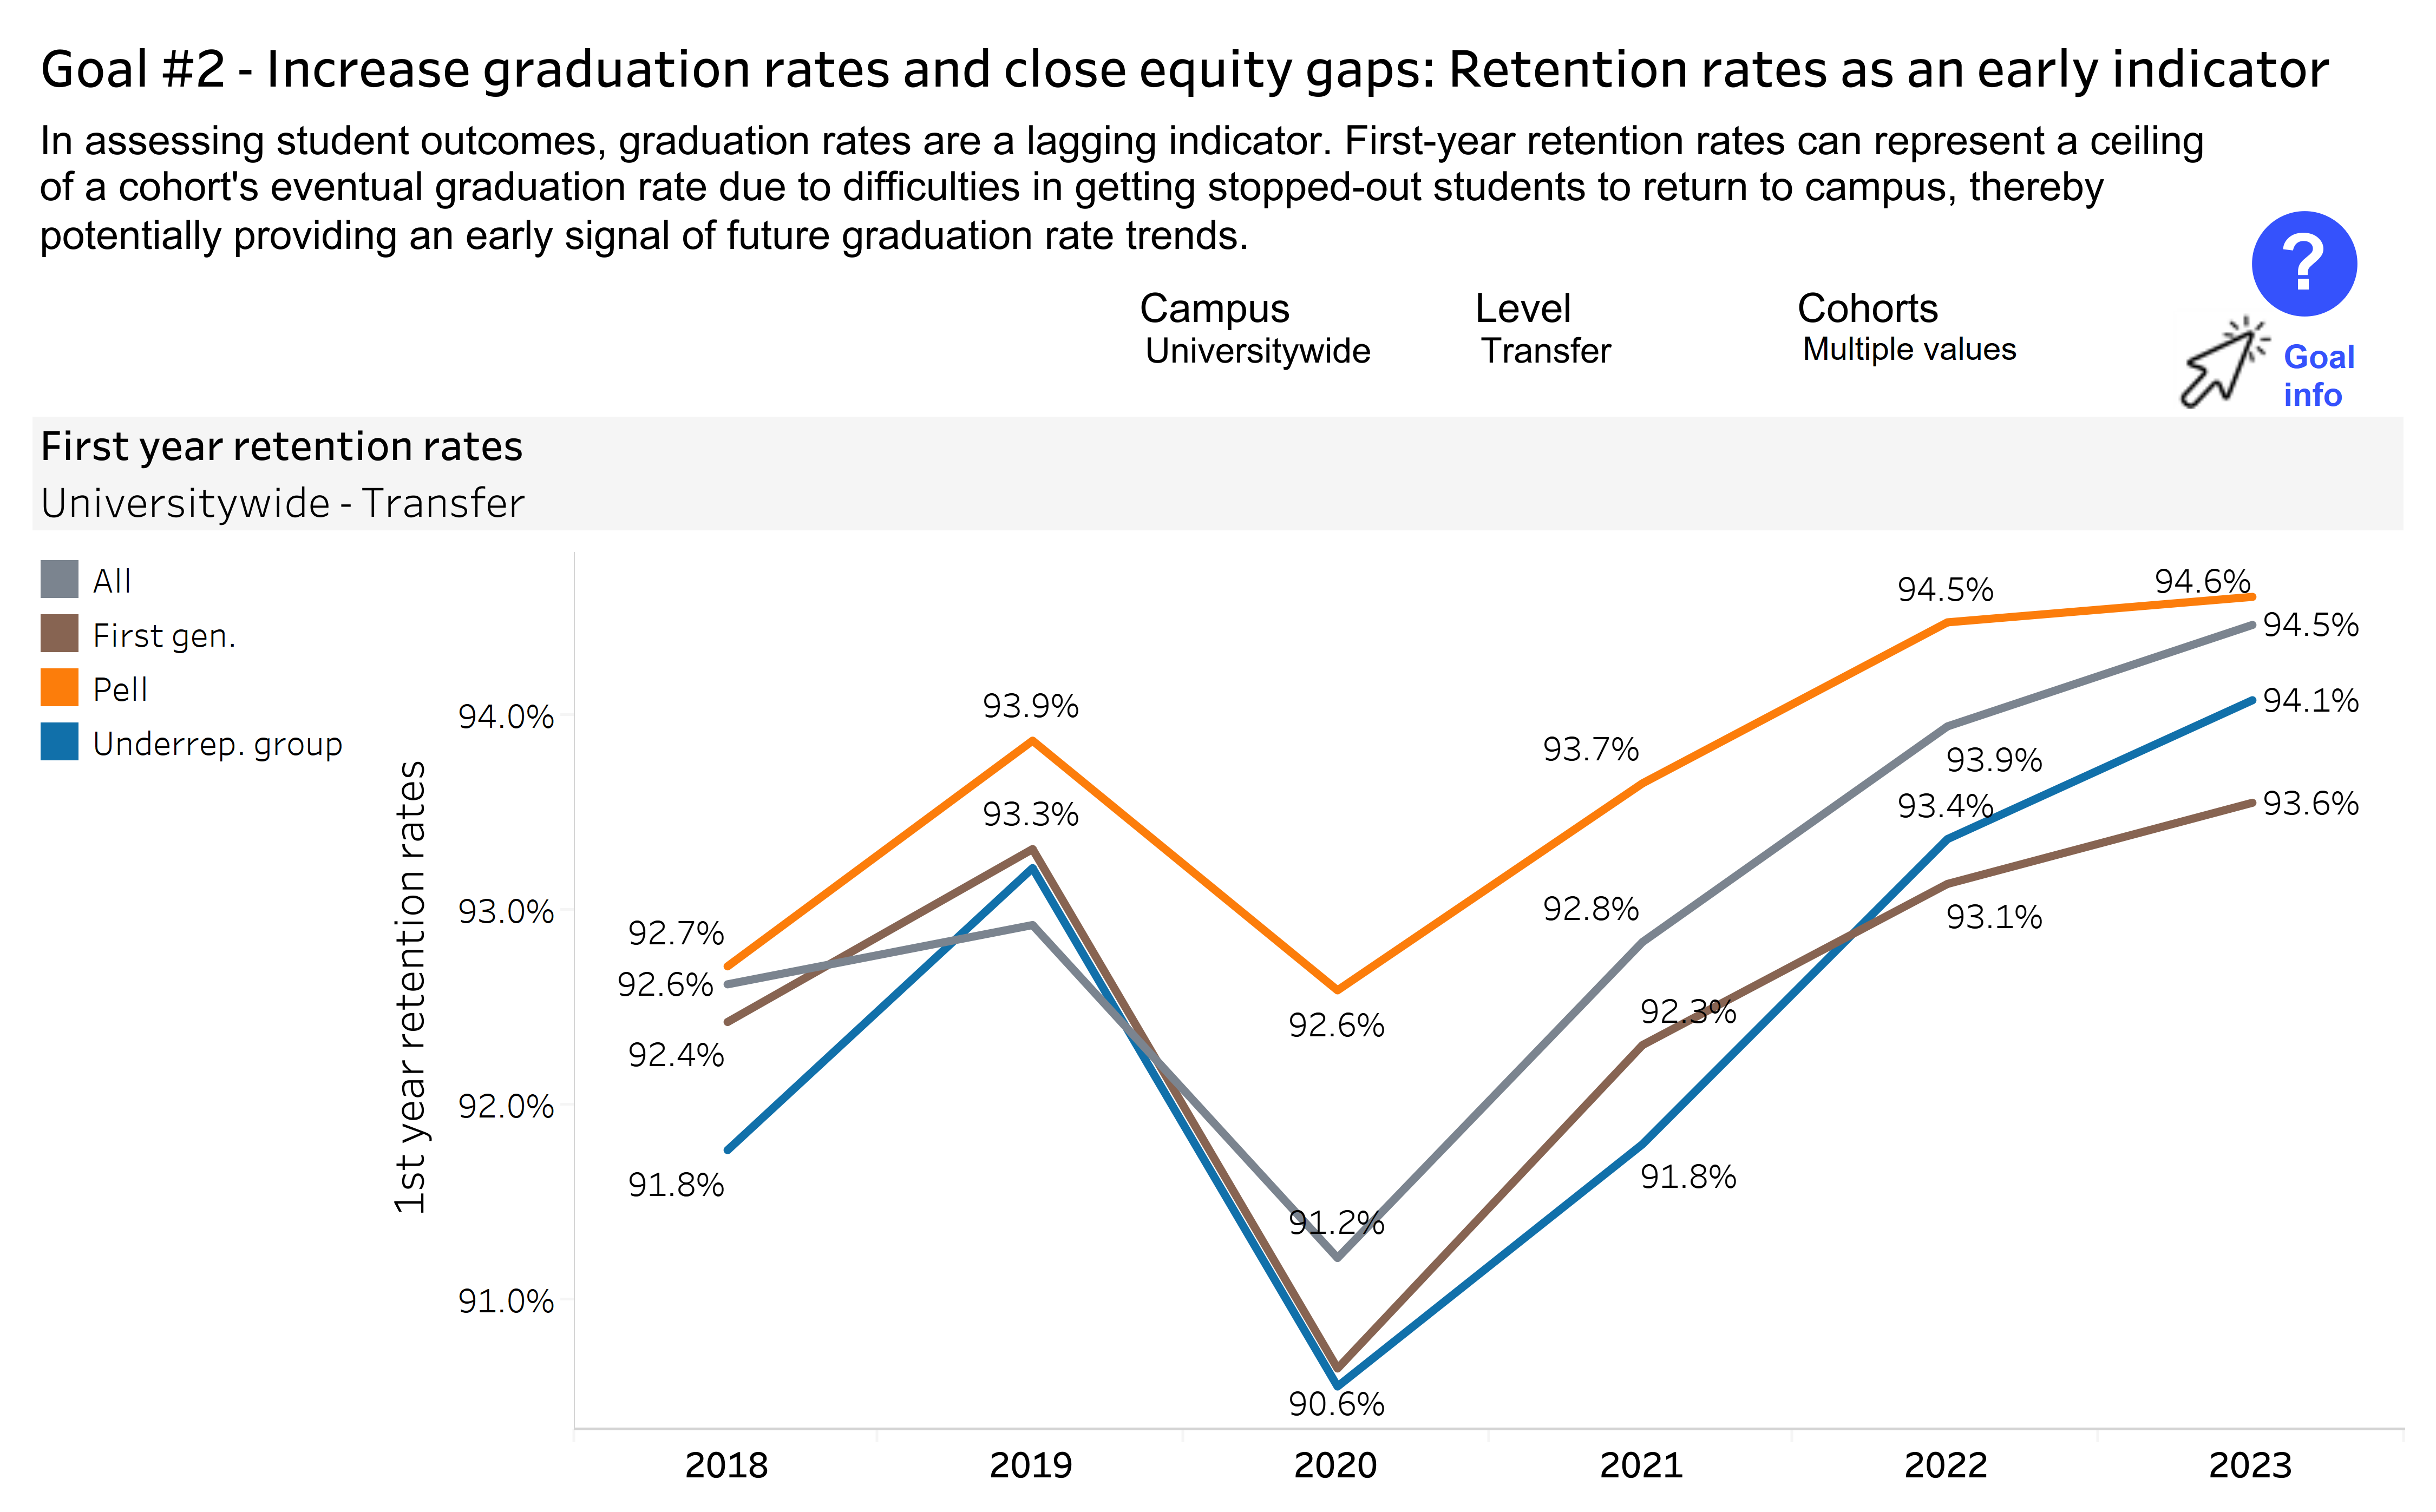
source: UC Information Center
Although the graduation rates of freshman and transfer first-generation students have not shown a significant increase (except for the two-year transfer graduation rate), the first-year retention rate of freshman and transfer students has increased in the past year after a major decrease with the 2020 cohort, likely due to the COVID-19 pandemic. This suggests a likely rebound in graduation rates for first-generation freshman and transfer students in the coming years.
3.2 RETENTION RATES
First-year freshmen retention rates at UC are about one percentage point higher than other AAU public institutions. First-year transfer retention rates are near or above 90 percent across all UC campuses.
3.2.2 First-year retention rates for students UC and comparison institutions, for cohort entering fall 2023
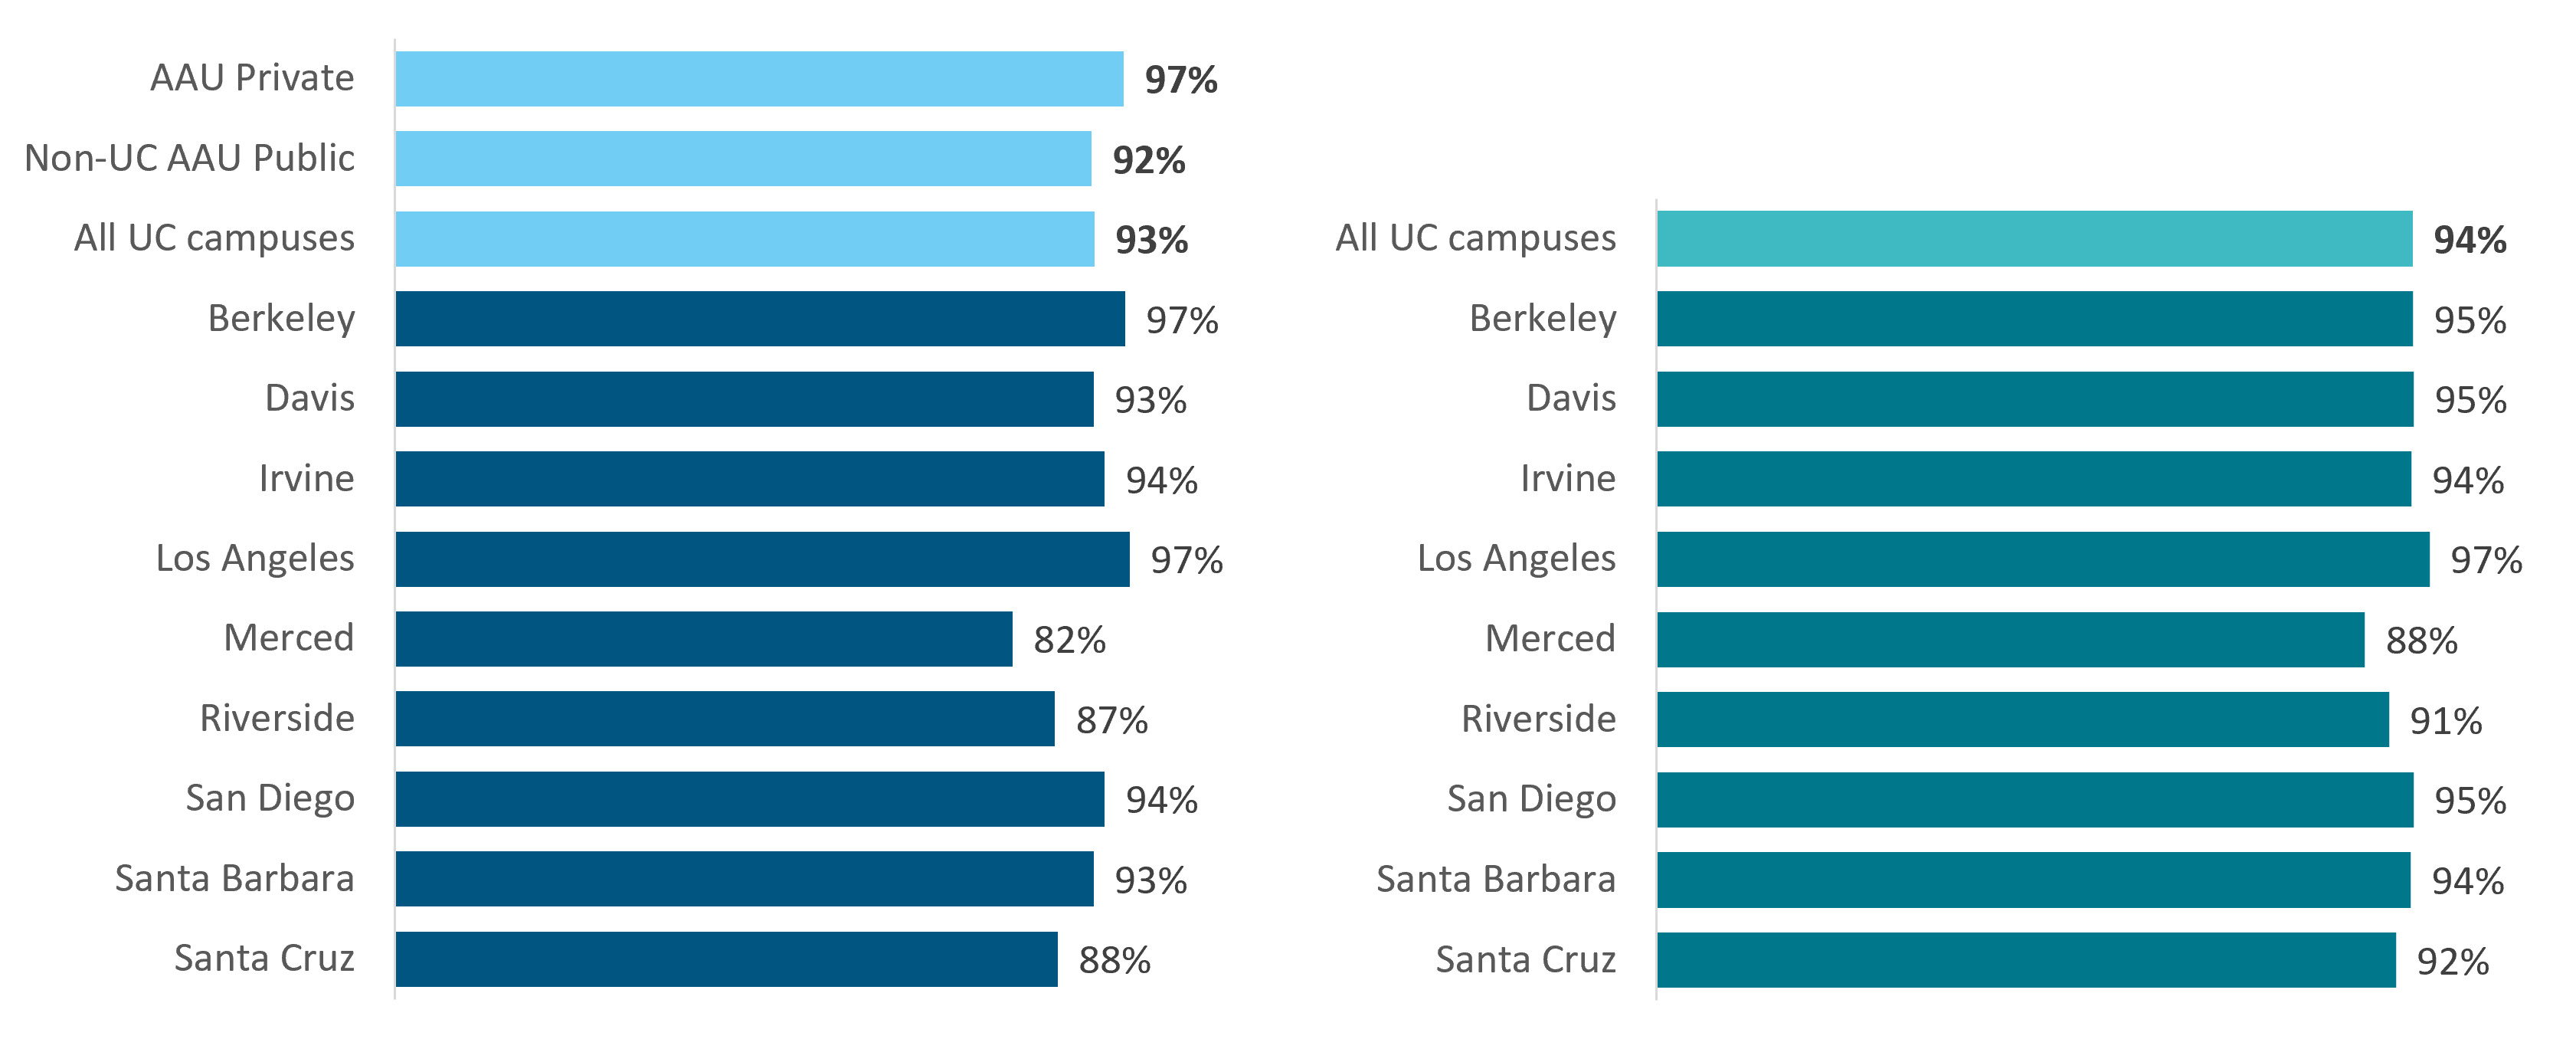
source: Freshman data from IPEDS. Transfer data from UC data warehouse. Comparison data are not available for transfers.
The current Universitywide first-year retention rate for freshmen is 93 percent, which is higher than non-UC AAU public institutions (92 percent) and lower than AAU private institutions (97 percent). The Universitywide transfer first-year retention rate is at or above 90 percent for all campuses except for UC Merced which has a first-year retention rate of 88 percent.
3.3 OUTCOMES
Social science, life sciences, and engineering and computer science are the largest segments of bachelor’s degree recipients.
3.3.1 Undergraduate degrees awarded by discipline, UC and comparison institutions, 2021-22
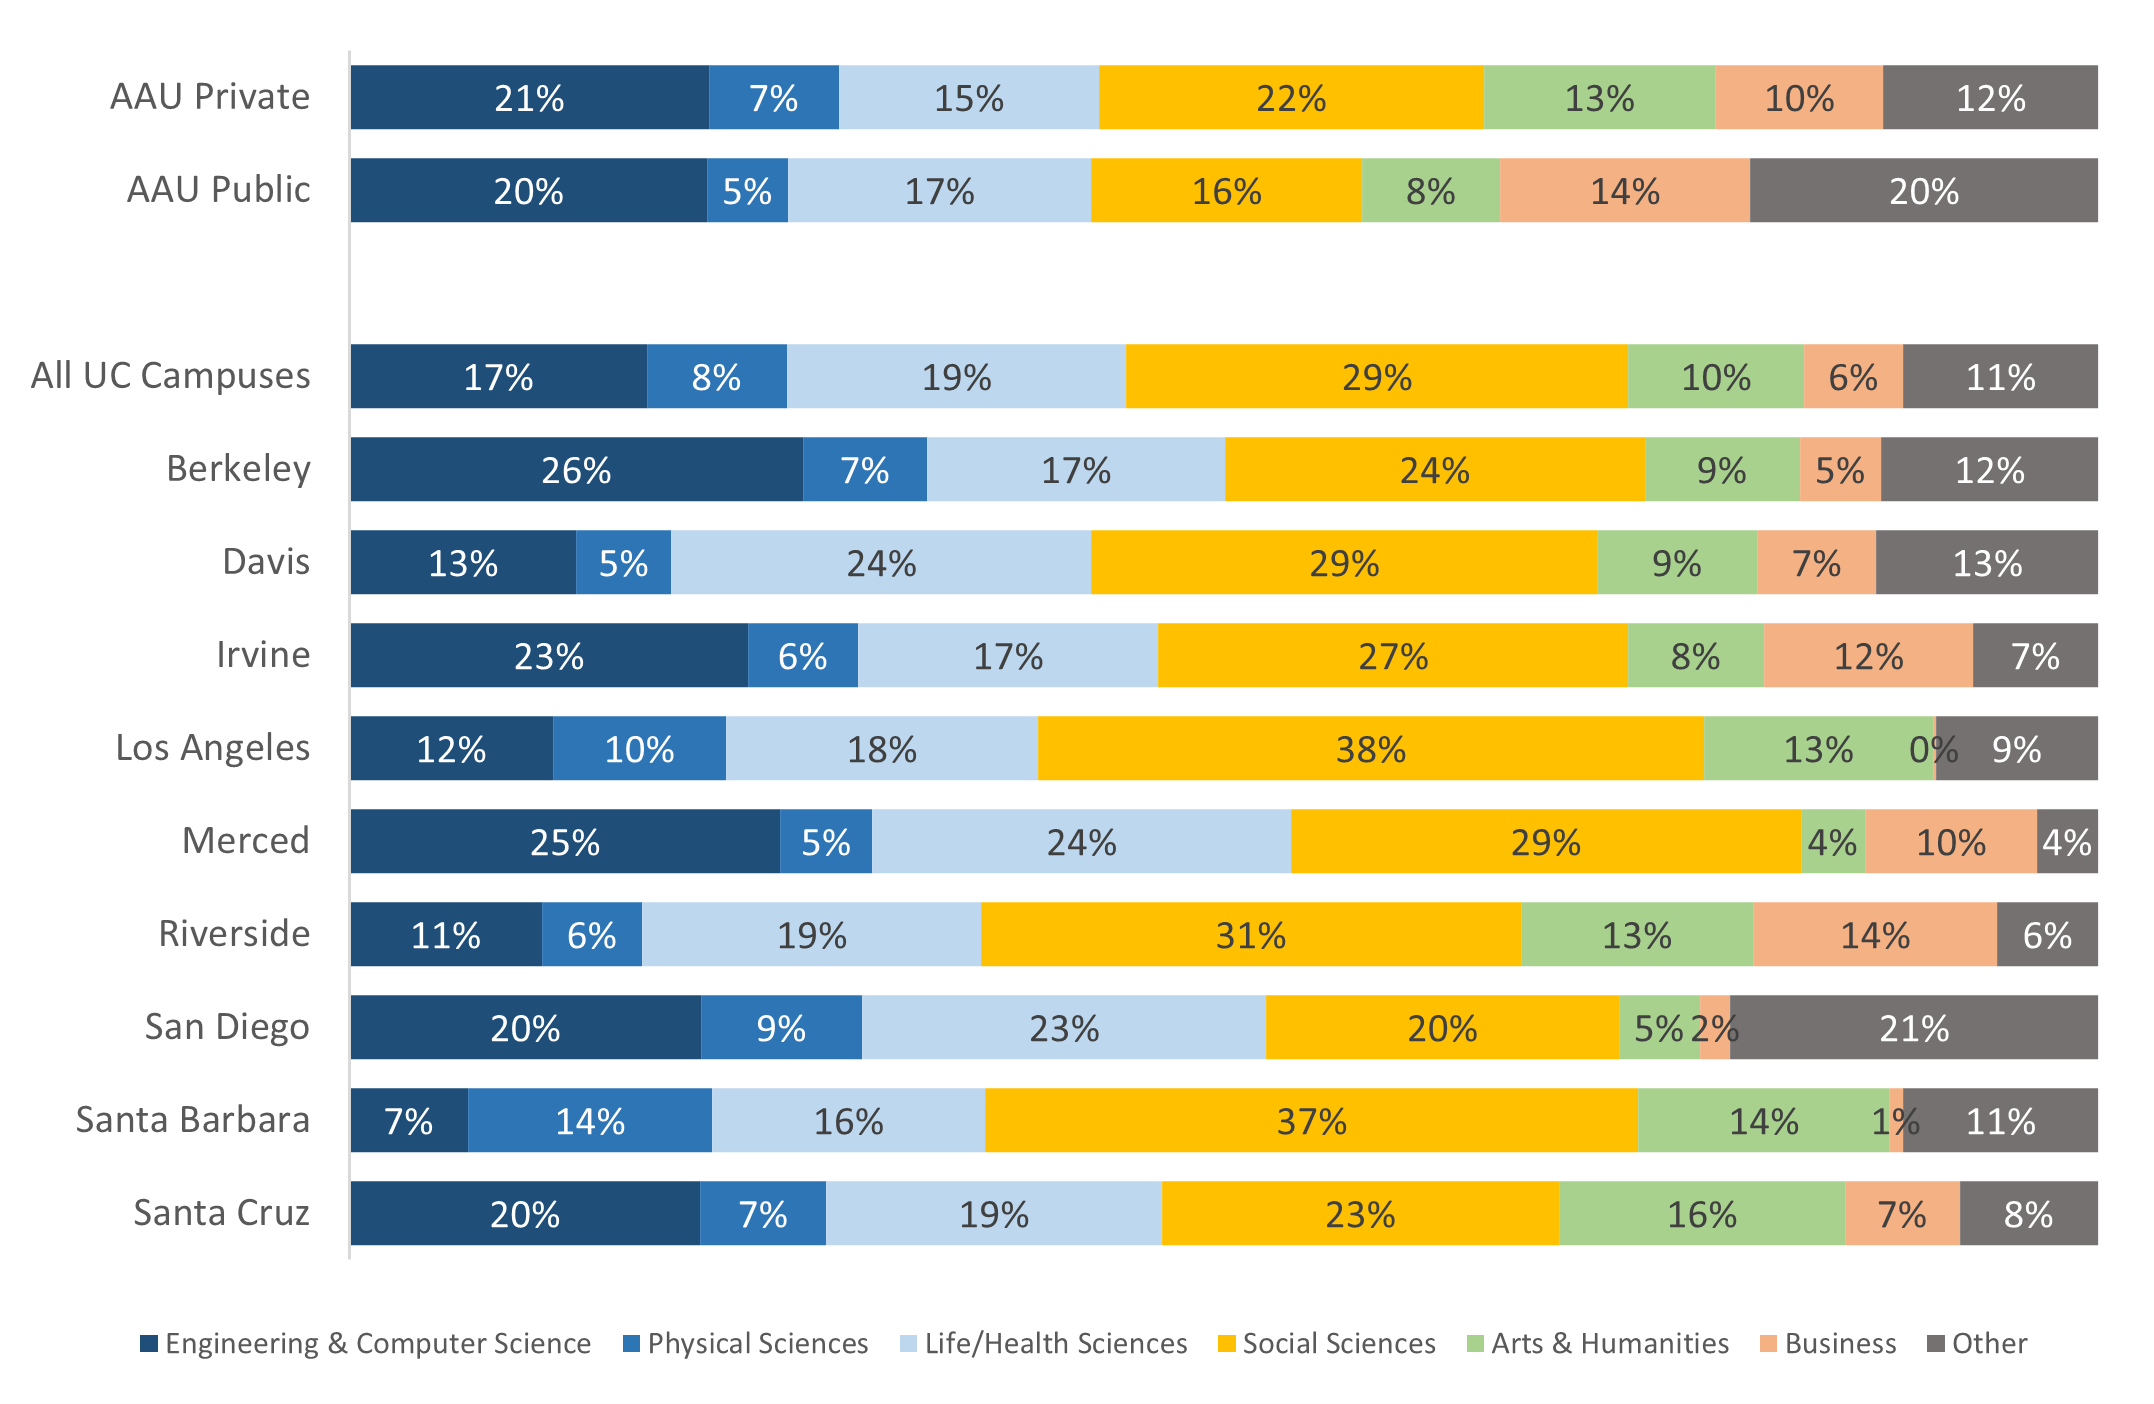
source: IPEDS
About 44 percent (27,810) of all undergraduate degrees awarded by UC in 2021–22 were in science, technology, engineering, and mathematics (STEM) fields. This is similar to the proportion at AAU public and private comparison institutions (42 and 43 percent, respectively).
More information on degrees awarded can be found at universityofcalifornia.edu/about-us/information-center/degrees-awarded-data.
Overall and across most disciplines, undergraduate degree recipients double their earnings between two and ten years after graduation.
3.3.2 Inflation-adjusted average and median alumni wages by selected majors, two, five, and ten years after graduation, Universitywide
UC undergraduate alumni outcomes in California dashboard
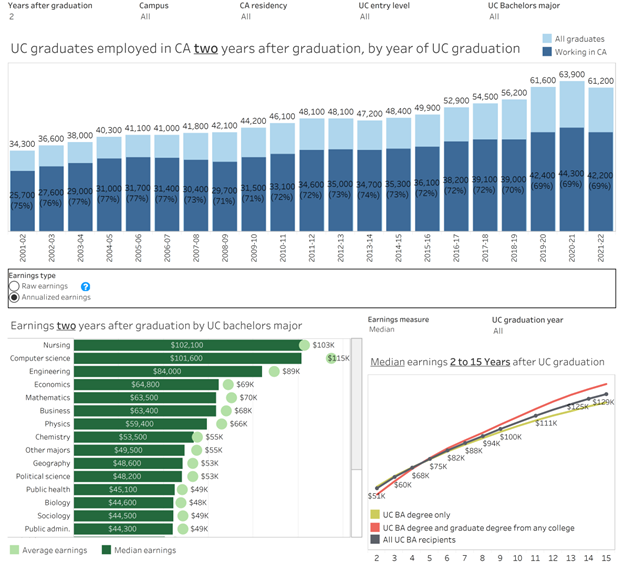
source: California Employment Development Department and UC Corporate Student System. Includes alumni employed in the state of California only. Amounts are inflation-adjusted to 2022 dollars.
Alumni employment data provide evidence of UC’s contribution to the California economy and its role as an engine of economic mobility. Overall and across most disciplines, undergraduate degree recipients double their earnings between two and ten years after graduation. In addition to the overall return of investment of a UC degree, UC Pell Grant recipients and first-generation students earn more than their families within four years of graduation – reinforcing UC’s role as an economic mobility machine.
3.3 OUTCOMES
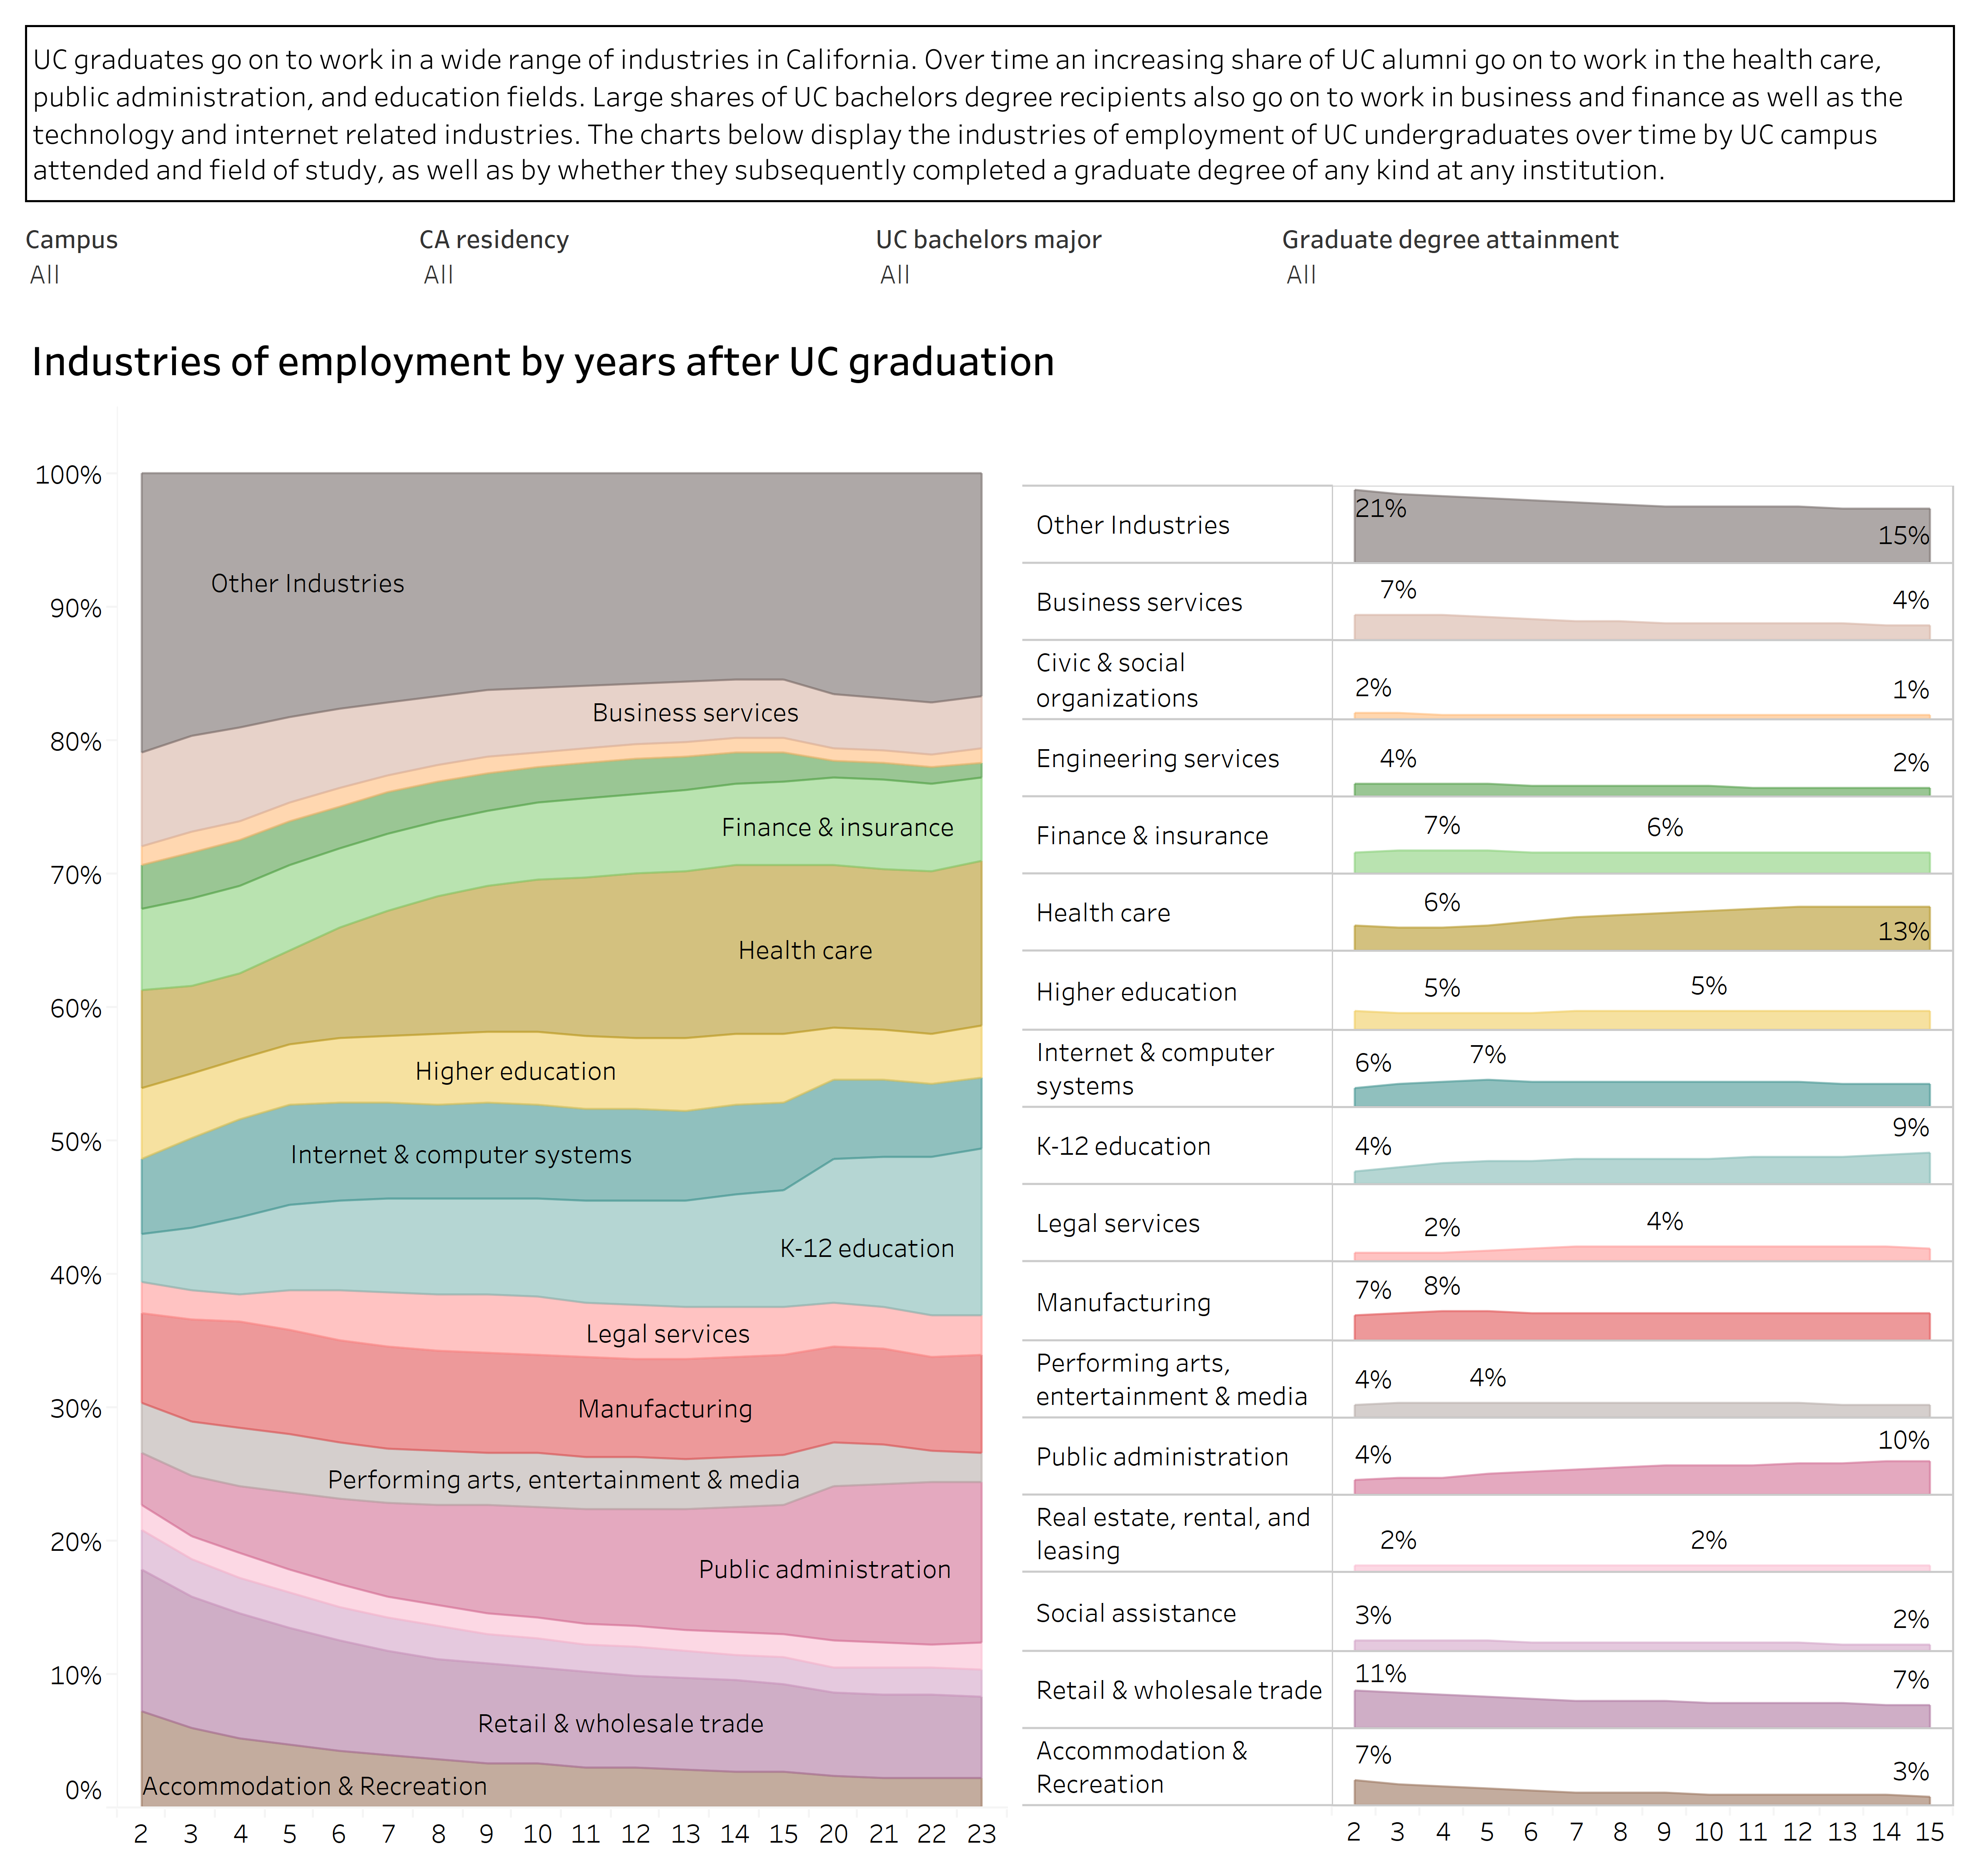
Over time, an increasing share of degree recipients go on to work across diverse California industries, particularly health care, public administration, education, and technology- and internet-related fields.
3.3.3 Industry of employment of UC bachelor’s graduates by discipline and years after graduation, Universitywide,
for 2001–02 to 2020–21 graduating cohorts (includes 2001-02 and 2000-01 graduating cohorts, combined).
UC undergraduate alumni outcomes in California dashboard
source: UC Information Center
UC graduates go on to work in a wide range of industries in California. Over time, bachelor’s degree graduates move to high-skill industries such as education, health care, public administration, engineering, and internet and computer systems.
A significant number of UC graduates go on to become educators within California’s K–-12 and higher education systems. About four percent of UC graduates work in the state’s K–12 education system right after graduation and about eight percent do so within ten years of receiving their UC degree. Seventy-five percent of California public schools have UC-educated teachers. Many UC graduates also work in the state’s health care and social assistance workforce. Ten years after graduation, about 15 percent work in health care or social assistance (40 percent among life science majors).
Thirty-seven percent of undergraduate degree recipients go on to earn a graduate degree, the majority of which are masters-level degrees.
3.3.4 UC undergraduate alumni graduate degree attainment by campus, 2000 to 2017 graduating cohorts, combined, as of spring 2023
UC alumni graduate degree outcomes dashboard
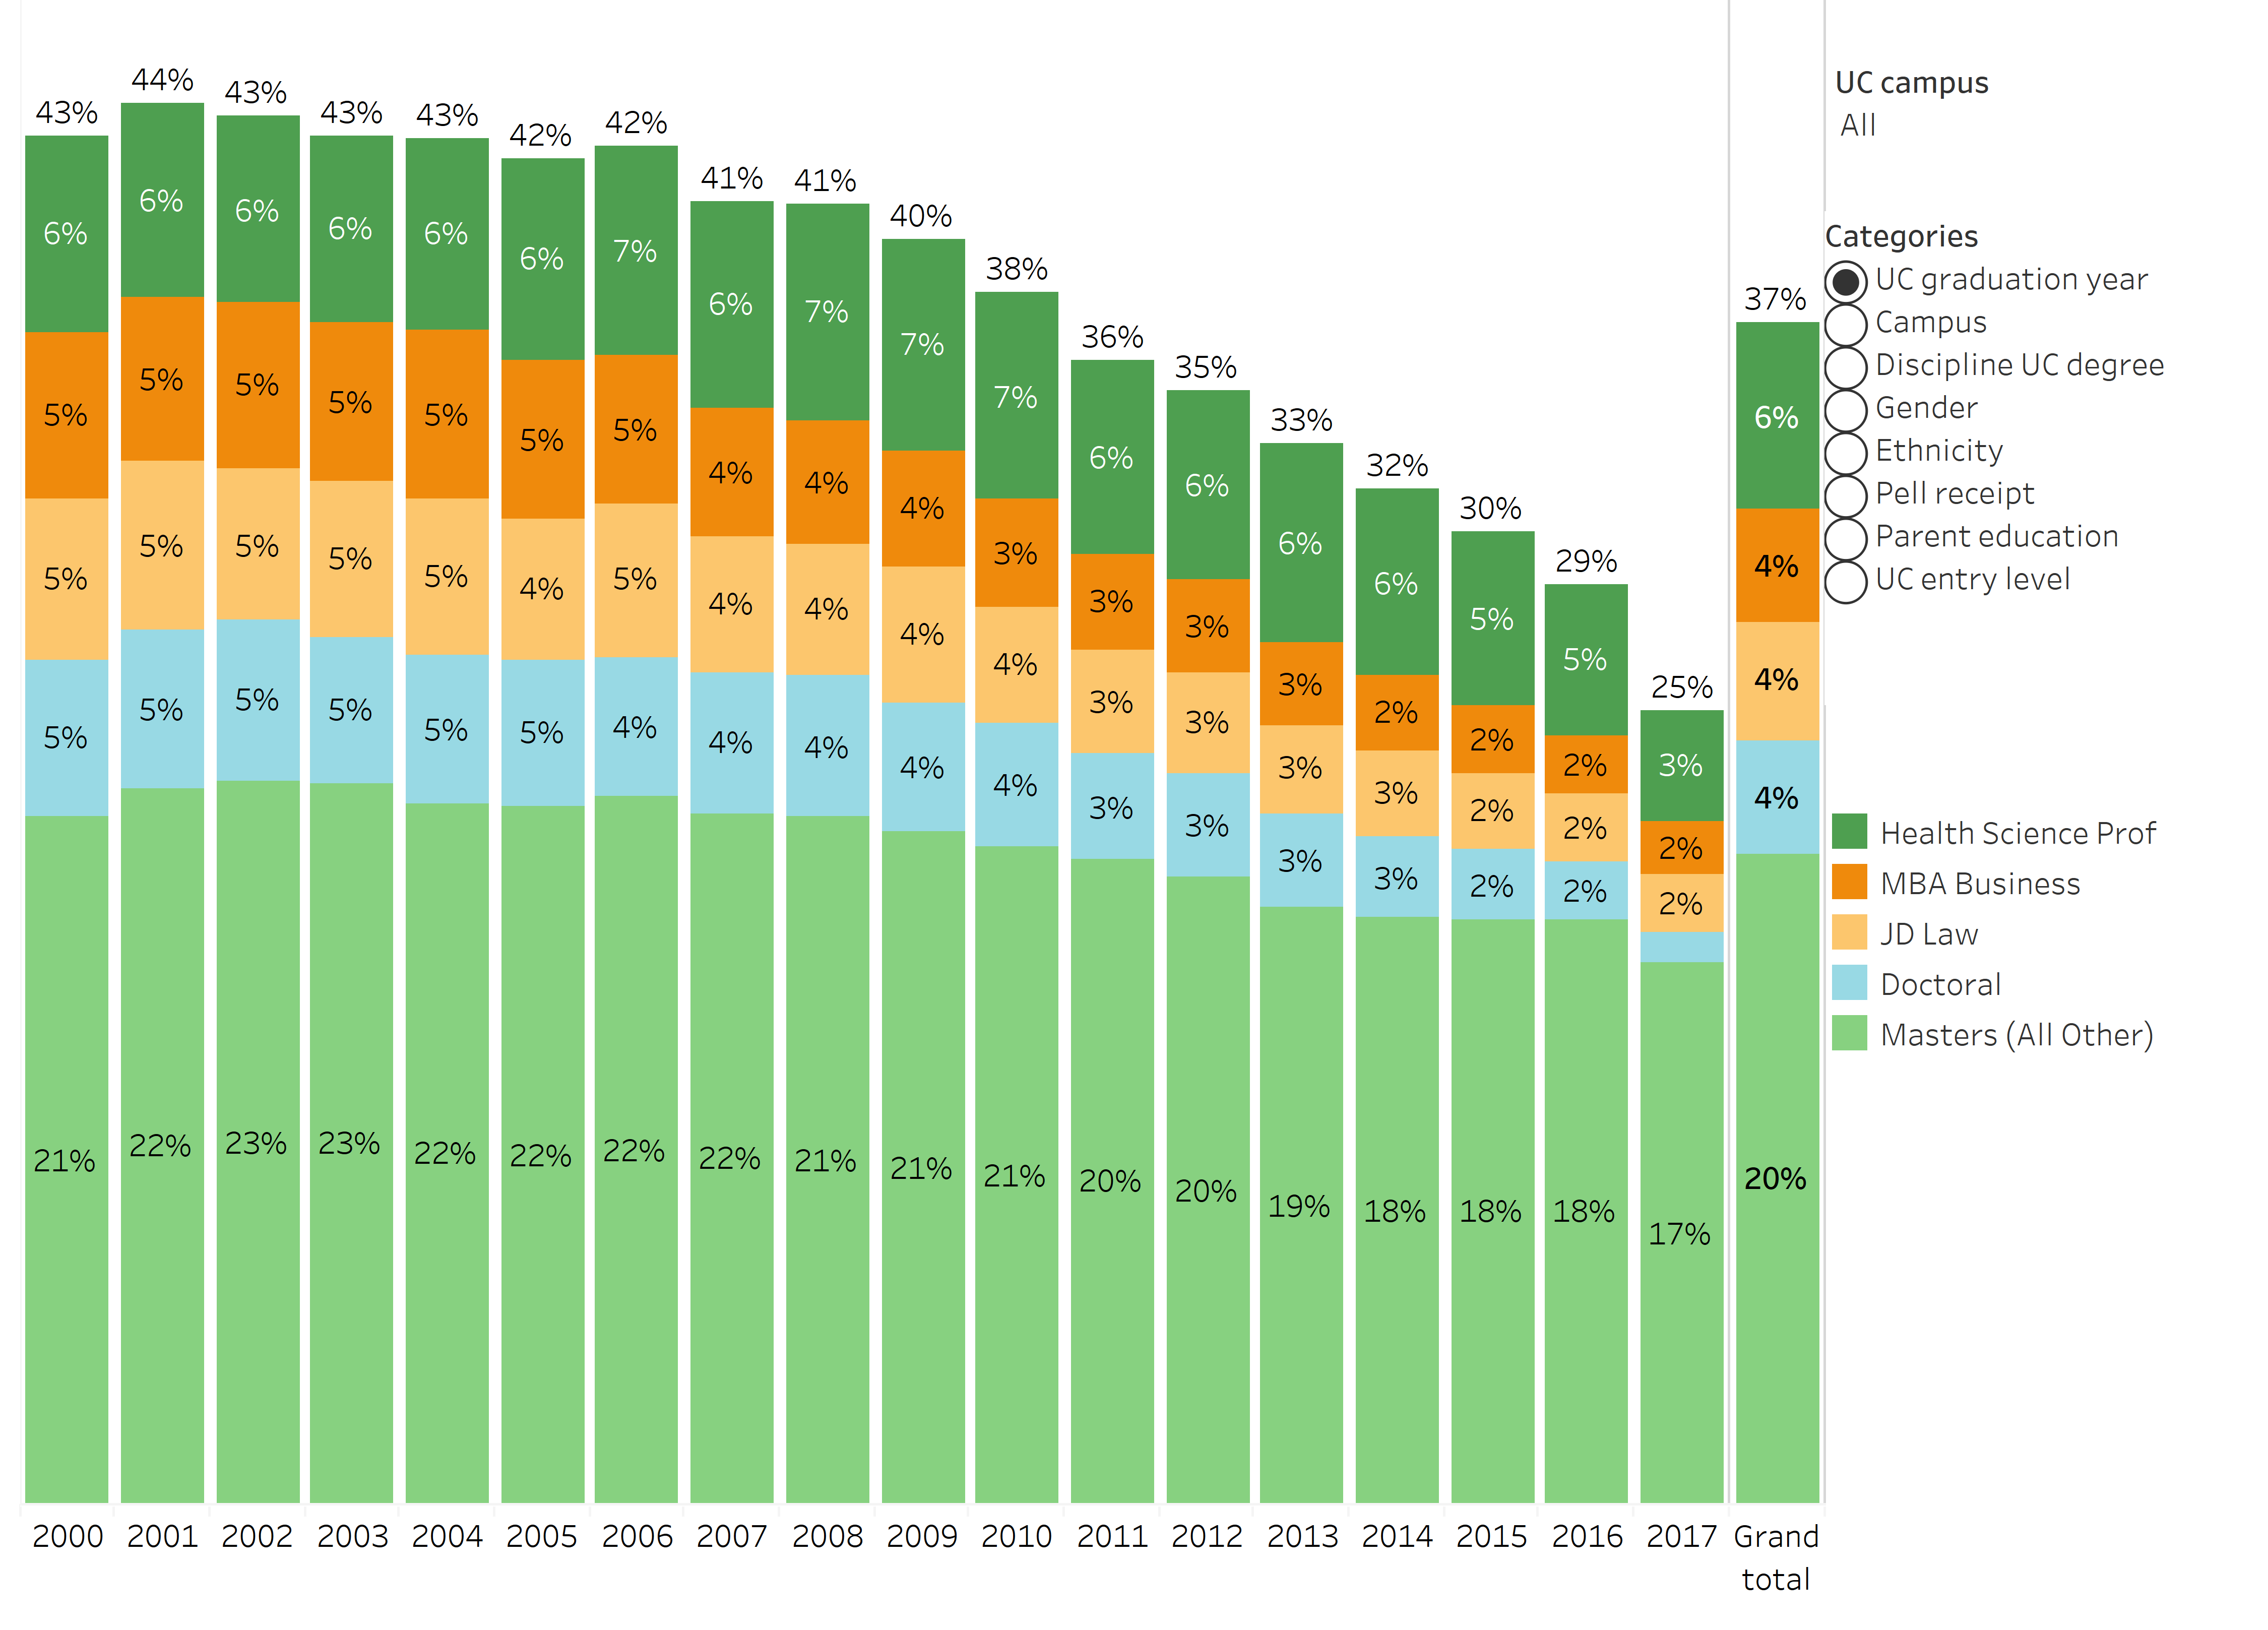
source: UC Information Center
Earning a graduate degree is a major objective of many undergraduates who attend a research university. Nearly 40 percent of undergraduate students go on to earn a graduate degree after their undergraduate studies at UC. By 2030, UC aims to increase access to graduate degrees for populations that currently are less likely to attend graduate school.
For more information
UC First-Generation Faculty Initiative (website)
UC 2030: Equity is Excellence (pdf)
Eliminating gaps in timely graduation (pdf)
UC’s report on Advising Strategies to Support Timely Graduation (pdf)
Beyond economic impact: Understanding societal impacts and public value of a UC degree (pdf)
Fiat Lux: What is the value of a UC degree? (pdf)
UC 2030 dashboard outlines systemwide and campus 2030 goals
Undergraduate graduation rates dashboard with graduation rates and goals by campus, gender, Pell, residency status, race/ethnicity, and other factors
UC undergraduate alumni outcomes in California dashboard describes UC’s undergraduate alumni outcomes, including employment industries and earnings
Degrees awarded data dashboard shows total degrees awarded by degree type, campus, gender, and race/ethnicity
CLIMB mobility analysis dashboard explains UC’s role in enabling low-income students to achieve intergenerational economic mobility
UC equity and student success goal dashboard
First-generation college students dashboard
UC undergraduate student research, internships, and service learning dashboard
UC student success dashboards
The complete UC Information Center Undergraduate outcomes subject area
The complete UC Information Center Alumni economic mobility subject area
Download data tables for chapter 3 indicators (Excel format)