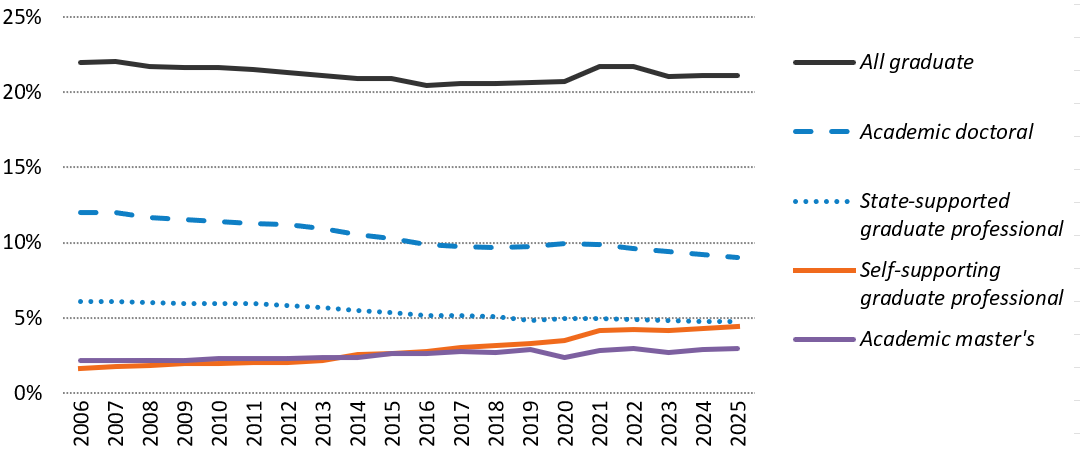
Graduate students have consistently comprised about 21 percent of UC enrollment, though the composition of graduate enrollment has shifted over time.
5.1.1 Graduate enrollment share of total, Universitywide, Fall 2006 to Fall 2025
source: UC Corporate Student System
Although graduate students have consistently represented about 21 percent of total UC enrollment since 2006, the composition of graduate enrollment has shifted over time. Academic doctoral students declined as a share of total enrollment from 12 percent in 2006 to nine percent in 2025, while self-supporting graduate professional programs increased from two percent to four percent over the same period. Academic master’s enrollment also grew modestly, increasing from two percent to three percent of total enrollment. Despite UC’s large graduate enterprise, graduate students comprised a smaller share of enrollment in 2024 compared to non-UC AAU public institutions (27 percent) and AAU private institutions (55 percent).
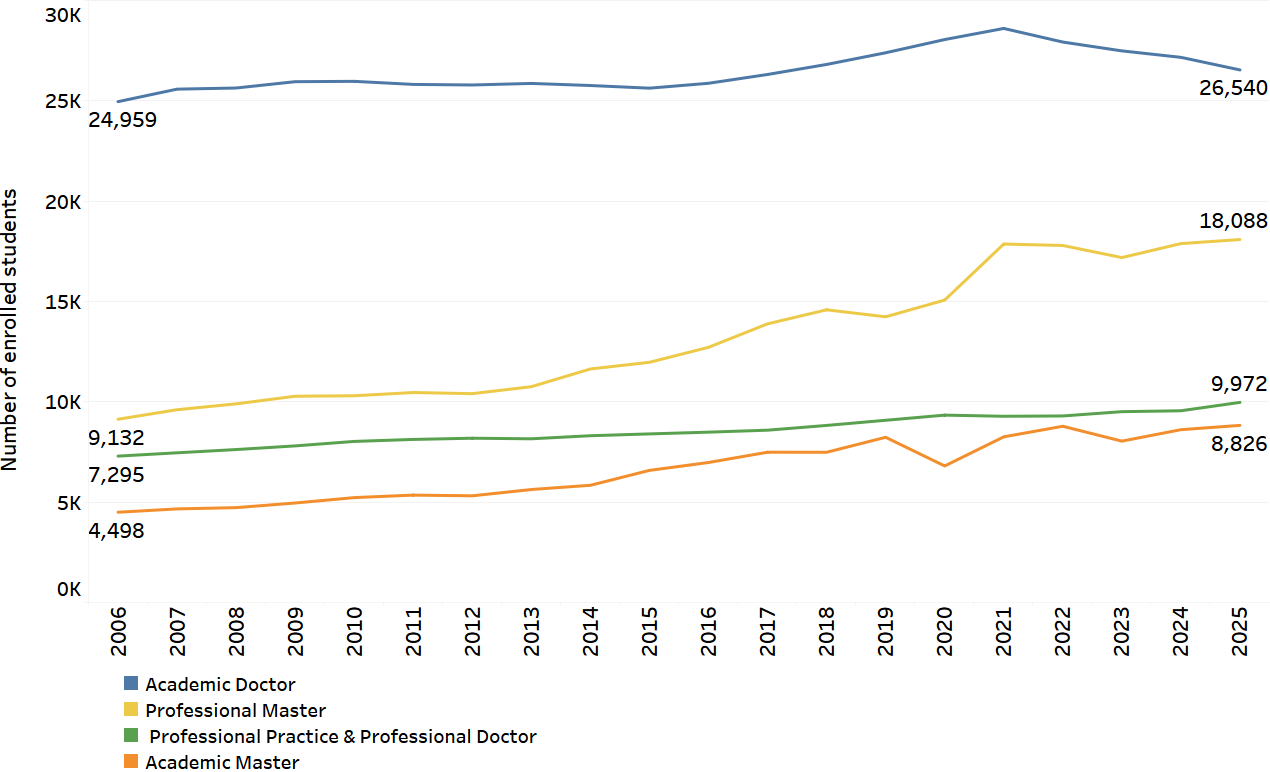
Graduate enrollment growth since 2006 has been driven primarily by increases in professional master’s and academic master’s programs.
5.1.2 All graduate enrollment over time by graduate program level, Universitywide, Fall 2016 to Fall 2025
source: UC Corporate Student System
Graduate enrollment trends varied by degree level between 2006 and 2025. Professional master’s enrollment experienced the largest growth, nearly doubling from 9,132 students in 2006 to 18,088 in 2025. Academic master’s enrollment also increased substantially, rising from 4,498 to 8,826 students over the same period. Academic doctoral enrollment remained comparatively stable, increasing modestly from 24,959 in 2006 to a peak of 28,607 in 2021 before declining to 26,540 in 2025. Professional practice and professional doctoral enrollment grew gradually from 7,295 to 9,972 students.
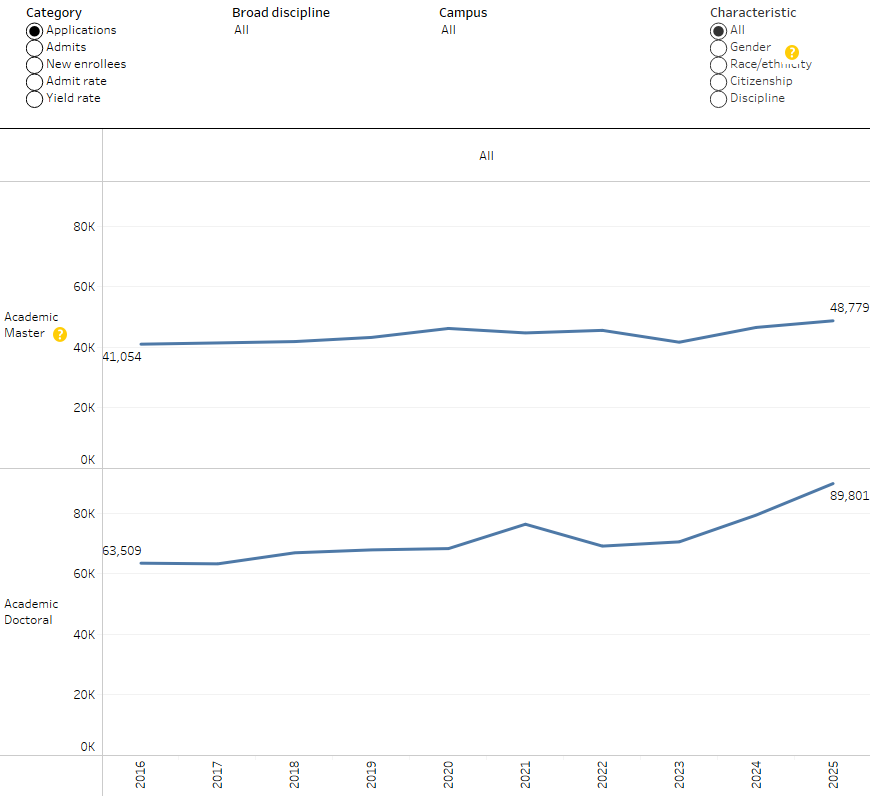
Applications to UC academic doctoral programs reached their highest level since 2016, while applications for academic master’s degrees increased slightly.
5.2.1 Graduate academic applications, admits, and new enrollees by degree program, Universitywide, Fall 2016 to Fall 2025

Graduate admissions dashboard | Admissions summary
source: UC Information Center
California’s Master Plan for Higher Education gives UC the responsibility of enrolling and preparing graduate academic and professional students to help meet the workforce needs of California and the nation, and to further the UC mission of teaching, research, and public service. Demand for UC academic master’s and doctoral programs has grown substantially over the last decade. Applications to academic doctoral programs in 2025 reached their highest level since 2016, but admits and new enrollments did not increase accordingly. Academic master’s programs experienced some growth in applications, admits, and enrollments over the same period.
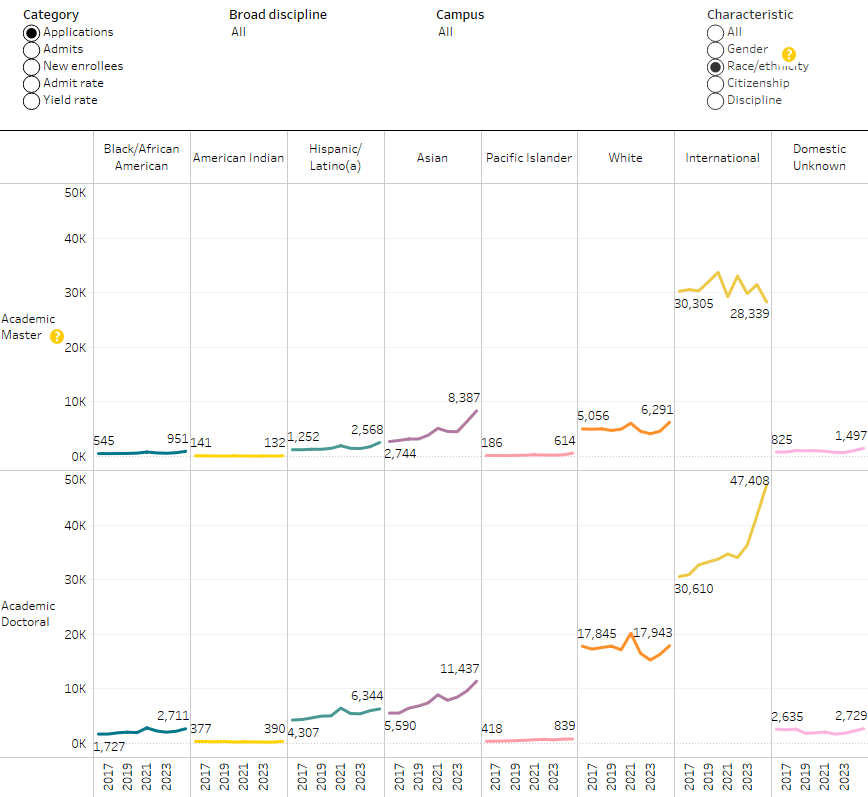
International students comprise a significant share of academic doctoral and master’s applicants, admits and enrollees.
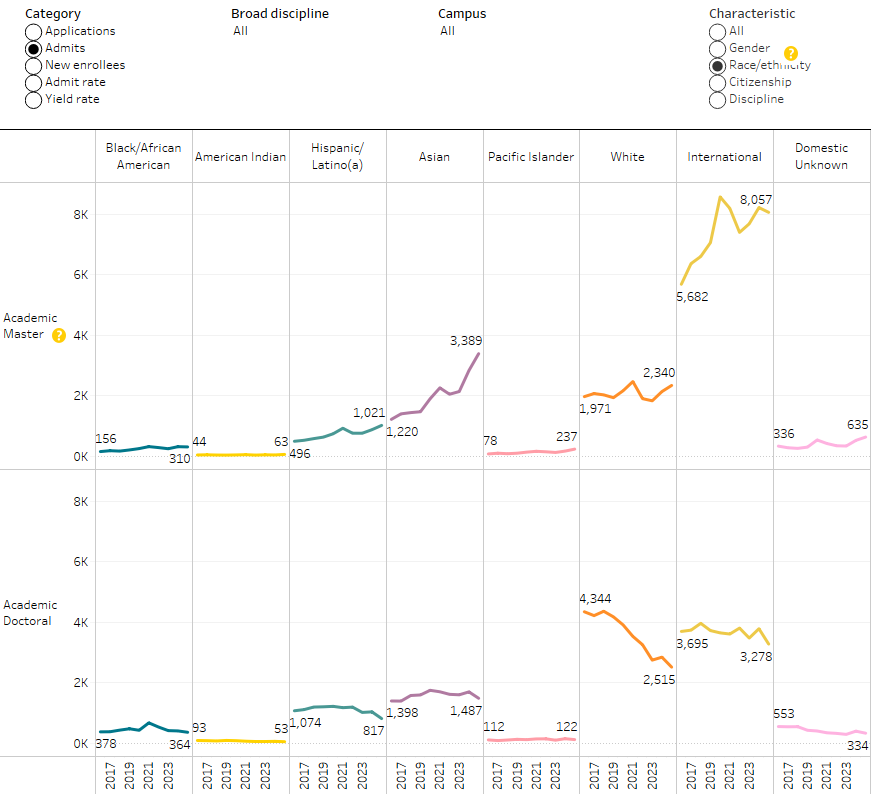
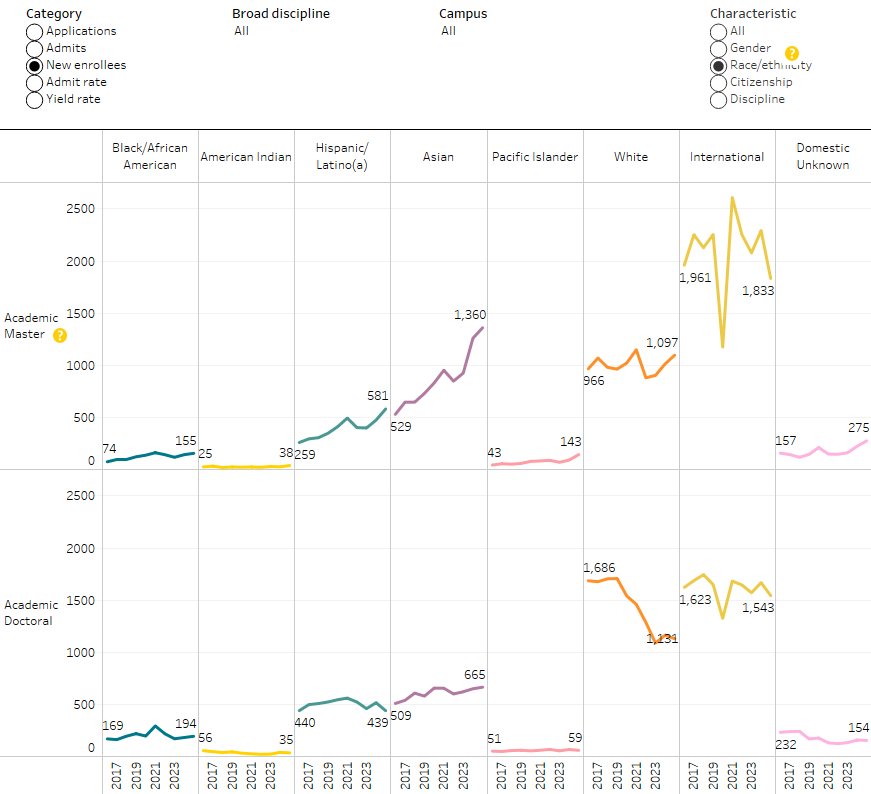
5.2.2 Graduate academic applications, admits, and new enrollees by race/ethnicity, Universitywide, Fall 2016 to Fall 2025
Graduate admissions dashboard | applicants
Graduate admissions dashboard | admits
Graduate admissions dashboard | new enrollees
source: UC Information Center
International students represent the majority of applicants and admits to graduate academic master’s programs, and a significant portion of applicants and admits to graduate academic doctoral programs. In addition, between 2016 and 2025, there has been an increase in the number of Black/African American and Hispanic/Latino(a) applicants for both graduate academic master’s and doctoral programs; however, the number of newly enrolled Black/African American and Hispanic/Latino(a) doctoral students remained about the same in 2025.
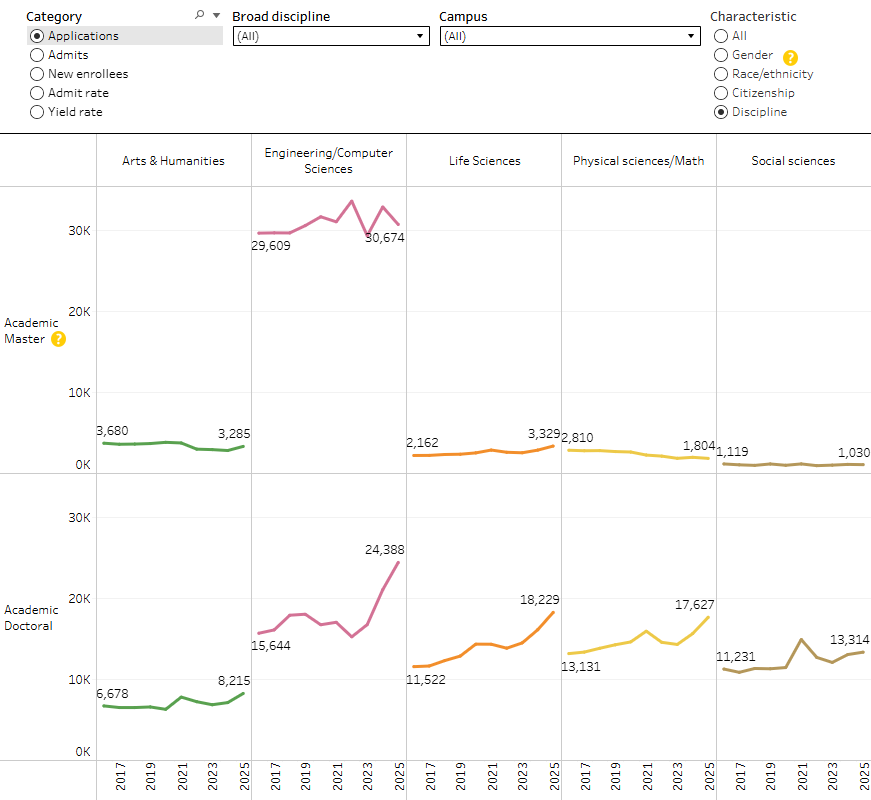
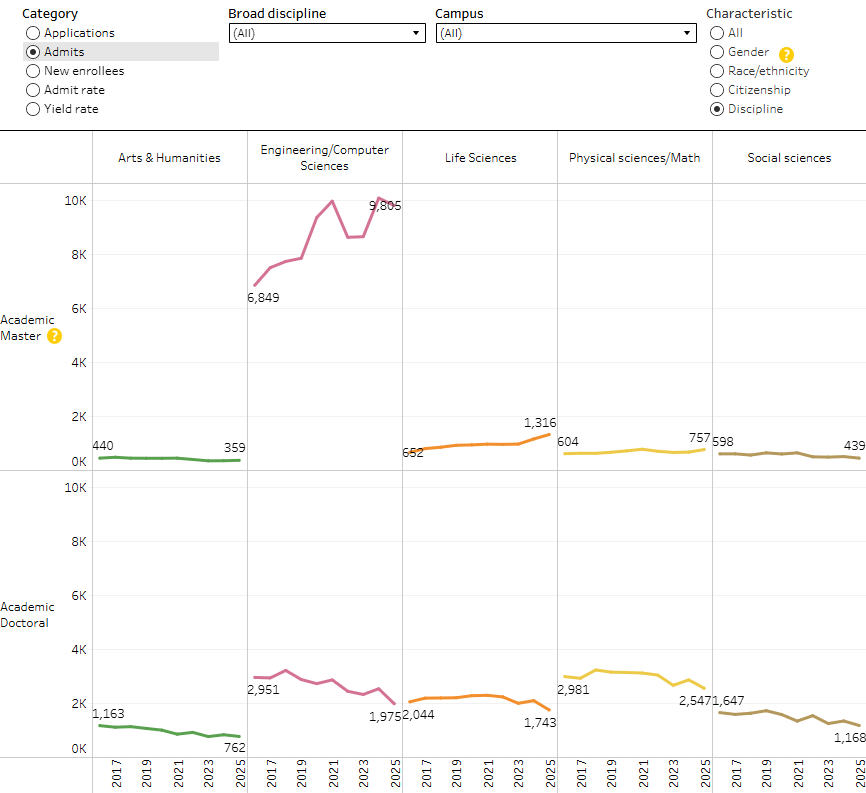
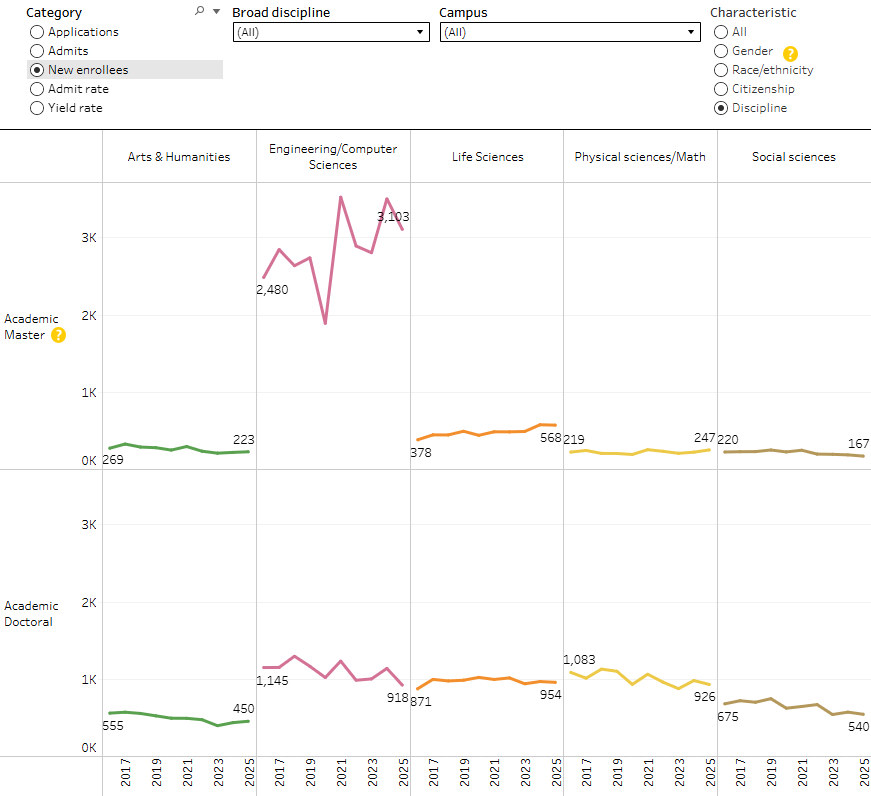
Academic master’s programs are primarily comprised of engineering and computer science majors, while all doctoral programs across primarily STEM-related disciplines are experiencing rising application demand without corresponding growth in admits or enrollments.
5.2.3 Graduate academic applications, admits, and new enrollees by discipline, Universitywide, Fall 2016 to Fall 2025
Graduate admissions dashboard | applicants
Graduate admissions dashboard | admits
Graduate admissions dashboard | new enrollees
source: UC Information Center
At the academic master’s level, applications, admits, and new enrollment growth in engineering and computer science since 2016 has been robust, even after fluctuations during the COVID-19 pandemic period. At the academic doctoral level, applications in engineering/computer science, life sciences, and physical sciences/math have increased since 2022; however, the number of admits and new enrollees in these disciplines has either decreased or remained steady.
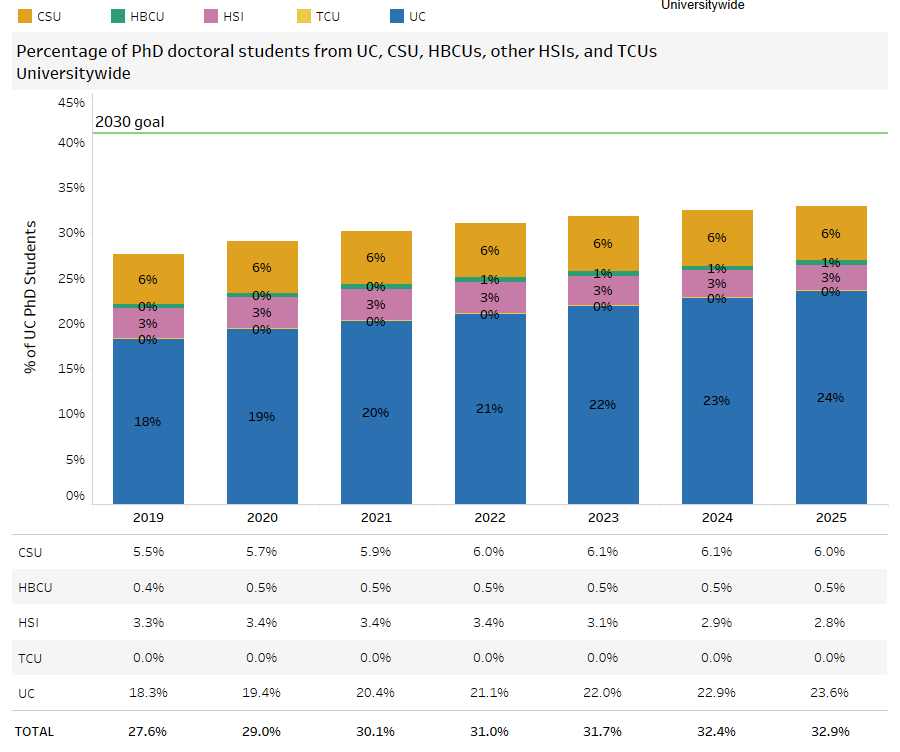
UC increased the share of academic doctoral students from UC, CSU, HBCUs, HSIs, and TCUs from 28 percent to 33 percent since 2019.
5.3.1 Share of all academic doctoral students from UC/CSU/HBCU/HSI/TCU and Growing Our Own goal
UC 2030 dashboard | Goal #3 – Growing our own initiative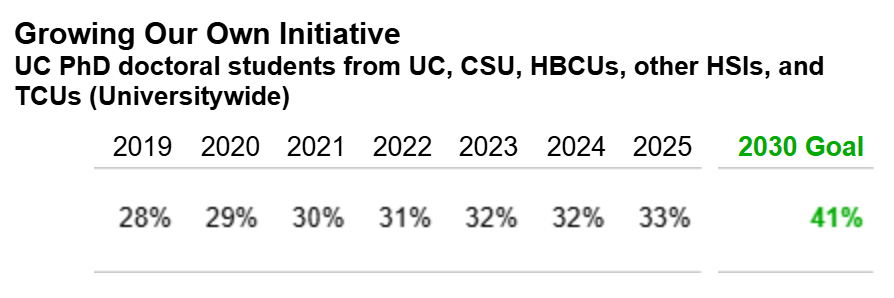
UC 2030 dashboard
source: UC Information Center
UC seeks to enroll a higher proportion of academic doctoral students from a UC, California State University (CSU), Historically Black College and Universities (HBCU), Hispanic Serving Institutions (HSI; non-UC/CSU), or Tribal Colleges and Universities (TCU), with the goal of increasing enrollments from these schools to 41 percent. The Growing Our Own initiative aims to help UC achieve its goals of diversifying both its doctoral student population and the California professoriate. Since 2019, UC moved closer to this goal by increasing the share of doctoral students from these target institutions from 28 percent to 33 percent, which has been roughly a one percent annual increase since the Initiative’s inception.
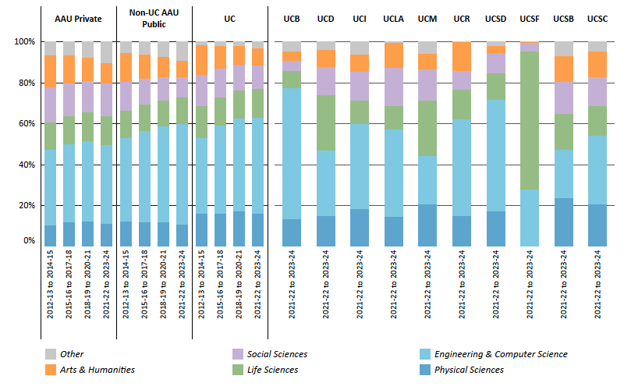
UC awarded 77 percent of its graduate academic doctoral and master’s degrees in STEM fields between 2021–22 to 2023–24.
5.4.1 Graduate academic doctoral and master’s degrees awarded by discipline, UC and AAU private and public comparison institutions, Number of degrees grouped in three-year intervals: 2012–13 to 2023–24
source: IPEDS
Between 2021–22 and 2023–24, UC awarded 77 percent of its graduate academic doctoral and master’s degrees in the fields of Life Sciences (14 percent), Engineering and Computer Sciences (47 percent), and Physical Sciences (16 percent). UC’s graduate STEM programs reflect the predominant industries in California’s economy. Between 2021–22 to 2023–24, UC awarded a higher proportion of its graduate academic doctoral and master’s degrees in STEM fields compared to AAU Private institutions (63 percent) and a similar proportion of its degrees compared to non-UC AAU public institutions (73 percent).
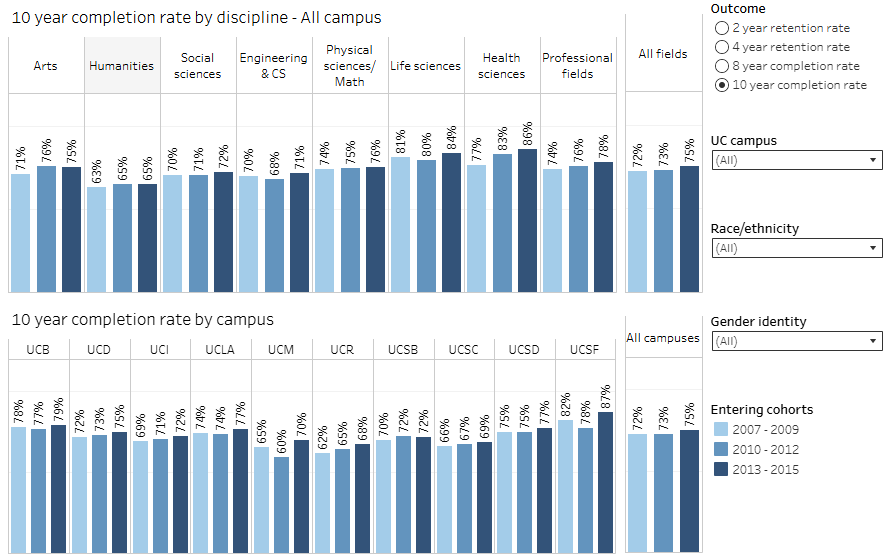
Seventy-five percent of academic doctoral students graduate within ten years, though completion rates vary by discipline and race/ethnicity.
5.4.2 Doctoral completion rates after ten years, by broad field and entry cohorts, Universitywide, Fall 2007–2009, 2010–2012, and 2013–2015 entry cohorts
Doctoral retention and completion dashboard | Campus - discipline
source: UC Information Center
For academic doctoral students that started their doctoral program between 2013–2015, 75 percent completed their doctoral degree within ten years. Ten-year completion rates varied by discipline, ranging from 65 percent to 86 percent for academic doctoral students who entered their program between 2013 and 2015. Life sciences and health sciences continue to have the highest ten-year completion rates compared to other disciplines (84 and 86 percent, respectively). Ten-year completion rates vary by race/ethnicity, with UC graduating academic doctoral students from underrepresented race/ethnicity groups (URG; i.e., American Indian/Alaska Native, Black/African American, Hispanic/Latino(a), and Pacific Islander) at lower rates compared to Domestic non-URG students and International students (68 percent compared to 72 and 80 percent respectively).
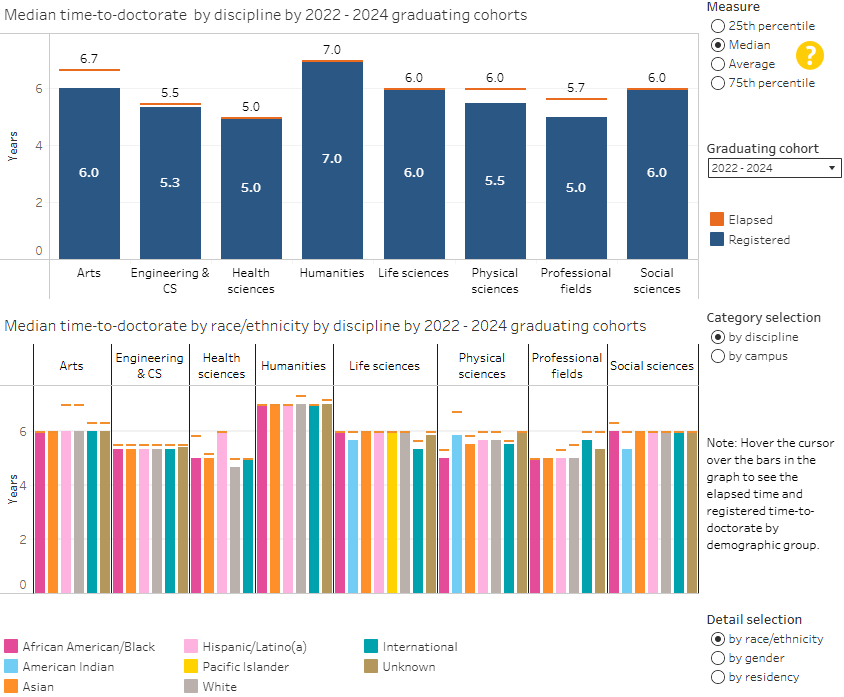
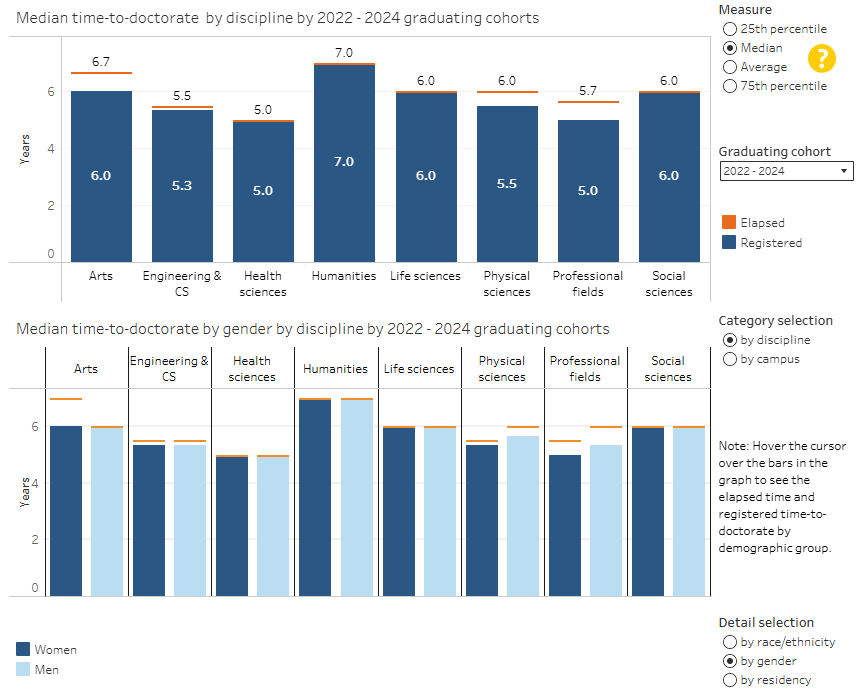
UC’s median time-to-doctorate varies by race/ethnicity, gender, and discipline, ranging from five to seven years.
5.4.3 Median time-to-doctorate, by race/ethnicity and discipline or gender and discipline, Universitywide, 2022 through 2024 graduating cohorts
Time-to-doctorate dashboard | race/ethnicity
Time-to-doctorate dashboard | gender
source: UC Information Center
Note: Elapsed time-to-doctorate (ETD) represents the total elapsed time starting from entry into a graduate program to doctoral degree completion, with leaves of absence or other enrollment lapses counting toward the ETD. Registered time-to-doctorate (RTD) is defined as the total time in which the student was formally registered in graduate study at the campus.
Registered and elapsed time-to-doctorate vary by discipline, with most students requiring about six years. International students have shorter median registered time-to-doctorate (RTD) in Life Sciences compared to their peers (5.3 years compared to 6.0 years). Among academic doctorate recipients in the health sciences, Hispanic/Latino(a) recipients in the 2022–24 graduating cohorts had a longer median RTD compared to their peers (6.0 years compared to about 5.0 years). Men and women generally have comparable time-to-doctorate by discipline.
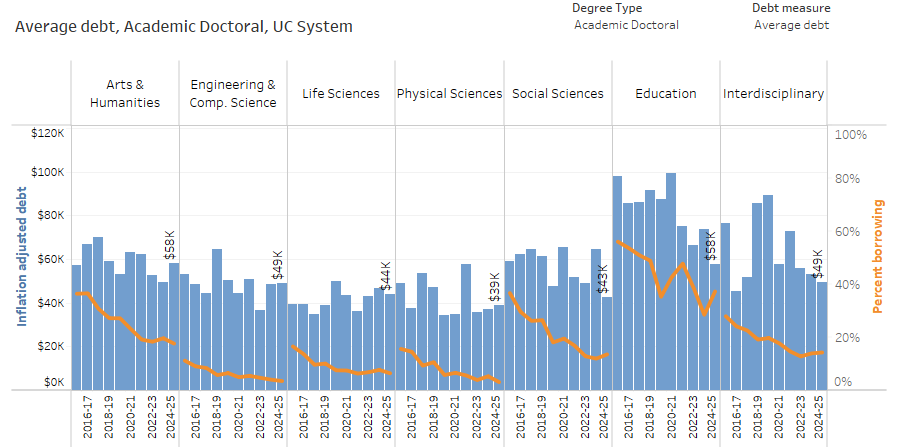
For UC academic doctoral students who graduated in 2024–25, 92 percent graduated with no debt. Academic doctoral students in engineering & computer, life, and physical sciences have lower proportions graduating with debt compared to those in the social sciences and arts and humanities.
5.4.4 Academic doctoral students’ graduate debt at graduation, by discipline, domestic students, Universitywide, Graduating classes of 2015–16 to 2024–25
Graduate student financial support and debt at graduation dashboard
source: UC Information Center
Most UC academic doctoral students graduate with no student loan debt, though borrowing varies substantially by discipline. About 60 percent or more of UC academic doctoral students graduate with no student loan debt. For academic doctoral students graduating in 2024–25, students in Education and Arts & Humanities report the highest percentage of students graduating with debt (37 percent and 18 percent, respectively) while Physical Sciences and Engineering and Computer Sciences report the lowest percentages (three percent and four percent, respectively). Several factors account for the variation in debt across the STEM fields and social sciences or humanities, including higher levels of funding through research grants available in STEM fields and longer average time to degree in social sciences and humanities.
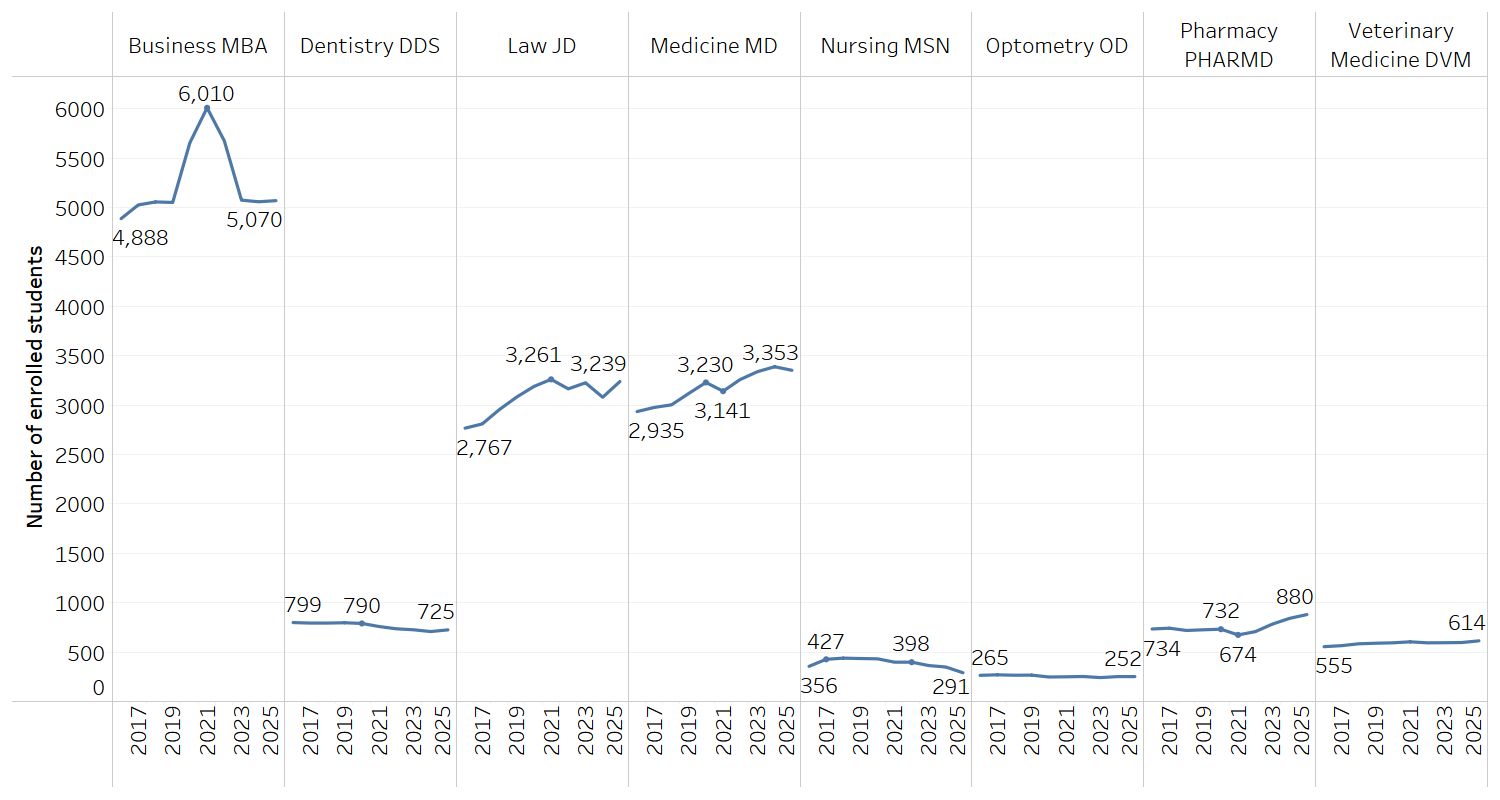
Professional degree enrollment trends varied across programs between 2016 and 2025, with growth in medicine, law, pharmacy, and veterinary medicine, and declines in several other professional programs.
5.5.1 Graduate professional student enrollment by select professional degrees over time, Universitywide, Fall 2016 and 2025
source: UC Corporate Student System
Enrollment increased in several professional degree programs between 2016 and 2025, including Medicine (2,935 to 3,353), Law (2,767 to 3,239, peaking at 3,261 in 2021), Pharmacy (734 to 880), and Veterinary Medicine (555 to 614). Business MBA program enrollment rose to a high of 6,010 in 2021 before declining to 5,070 in 2025. Dentistry (799 to 725), Nursing (356 to 291), and Optometry (265 to 252) experienced gradual declines overall.
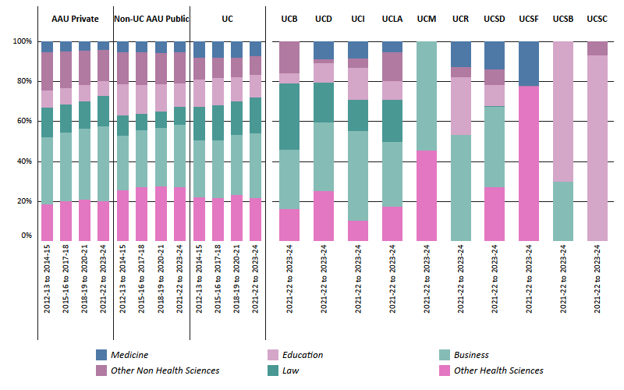
UC awarded 51 percent of its graduate professional degrees in business and law between 2021–22 to 2023–24.
5.6.1 Graduate professional degrees awarded by discipline, UC and AAU private and public comparison institutions, Number of degrees grouped in three-year intervals: 2012–13 to 2023–24
source: IPEDS
Between 2021–22 to 2023–24, UC awarded 51 percent of its graduate professional degrees in Business and Law; this proportion is comparable to AAU private colleges and universities (53 percent) and a higher proportion compared to non-UC AAU public colleges and universities (40 percent).
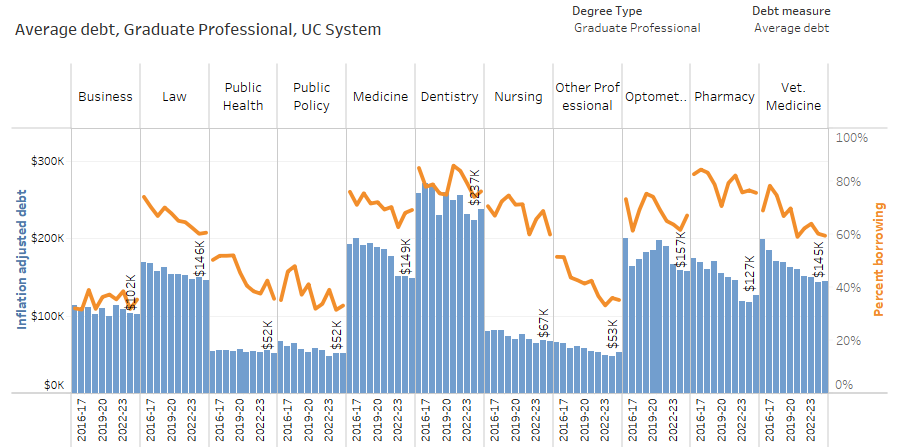
Graduate professional students carry higher debt levels than graduate academic students, though borrowing rates have generally declined over time.
5.6.2 Graduate professional degree student debt at graduation, by discipline, domestic students, Universitywide, Graduating classes of 2015–2016 to 2024–25
Graduate student financial support and debt at graduation dashboard
source: UC Information Center
Graduate professional students rely more heavily on loans than graduate academic students, reflecting differences in program funding models and tuition costs across disciplines. Although borrowing rates have generally declined over time in several professional programs, debt levels at graduation remain comparatively high for many graduate professional students. Students in Dentistry, Pharmacy, and Medicine are among the most likely to graduate with debt, while Dentistry students tend to have the highest average debt levels at graduation. Variation across disciplines reflects differences in program length, tuition levels, institutional aid, and expected labor market returns after graduation.
For more information
Explore the UC Information Center dashboards that provide downloadable data and context on graduate and professional students with this subject area-specific url:
universityofcalifornia.edu/about-us/information-center#graduate-and-professional-students
In addition to those dashboards supporting indicators in this chapter, other examples include:
Other resources
Download data tables for chapter 5 indicators (Excel format)
Chapter Five: Graduate Students
Key takeaways:
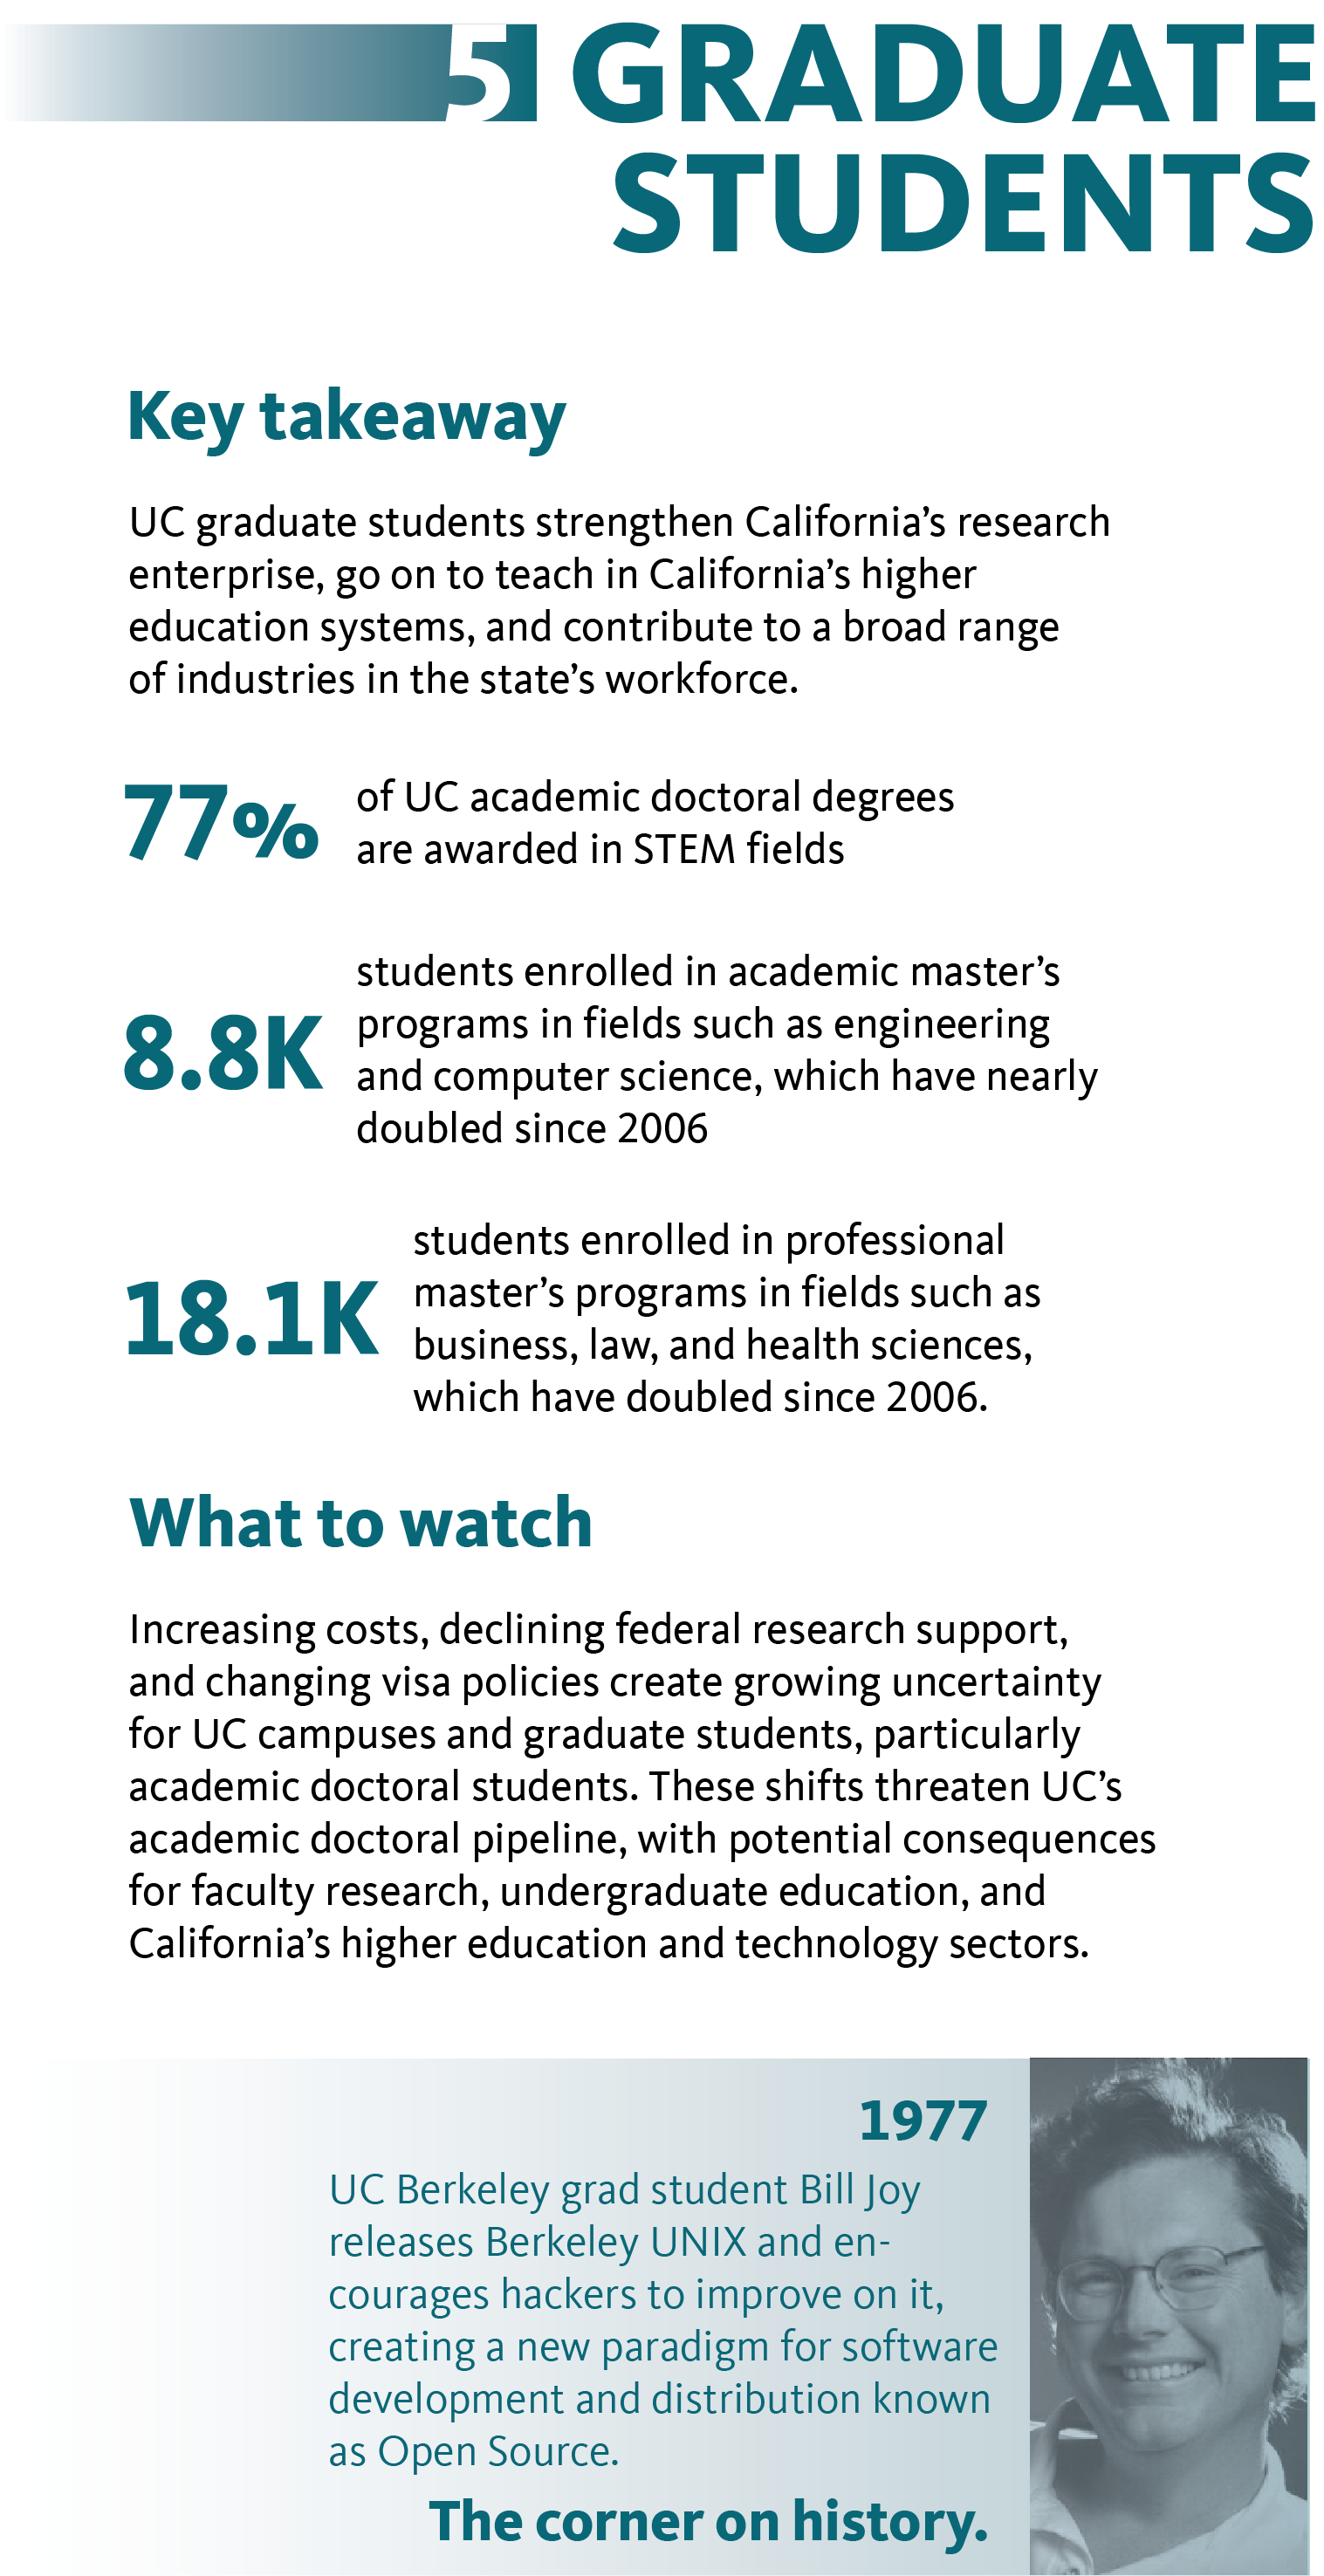
- UC graduate students strengthen California’s research enterprise, go on to teach in California’s higher education systems, and contribute to a broad range of industries in the state’s workforce.
- Seventy-seven percent of UC academic doctoral degrees are awarded in STEM fields.
- Eighty-eight hundred students are enrolled in academic master’s programs in fields such as engineering and computer science, which have nearly doubled since 2006.
- More than 18,000 students enrolled in professional master’s programs in fields such as business, law, and health sciences, which have doubled since 2006.
What to watch:
Increasing costs, declining federal research support, and changing visa policies create growing uncertainty for UC campuses and graduate students, particularly academic doctoral students. These shifts threaten UC’s academic doctoral pipeline, with potential consequences for faculty research, undergraduate education, and California’s higher education and technology sectors.
UC’s corner on history:
UC Berkeley graduate student Bill Joy releases Berkeley UNIX and encourages hackers to improve on it, creating a new paradigm for software development and distribution known as Open Source.