Accountability Report 2022

Chapter 1:
chapter one: undergraduate students: admissions and enrollment

First-year student Sariel Sandoval is a recipient of a very rare Generation Change Scholarship from UC Berkeley. The award is given to domestic non-resident students who are “game changers, trailblazers, solution seekers and revolutionaries...students with the potential to leverage a UC Berkeley education to change their world for the better.”

“It’s admirable that this 18-year-old from a very rural town in Montana that’s very isolated and not as connected to the world decided to take a challenge into her own hands,” said Whitney Williams, who ran for governor of Montana in 2020 and today is CEO of williamsworks, a social impact consultancy. “Her hustle is really remarkable,” continued Williams, People who have been through so much in their lives, particularly women and people of color, have a relentlessness that makes them successful.

Sandoval felt led to speak out in state speech and debate championships about issues affecting her community, including cultural appropriation, the disappearance and murder of Indigenous women, public commitment to high-quality Native American educational content in all K-12 classrooms, and the dismantling of privilege. Along her educational journey, Sandoval also found a passion and high aptitude for math.

Sandoval’s plan? “… I am a dedicated worker who intends to come back after college to help my people, tribe and community,”


Goals

One of the University of California’s highest priorities is to ensure that a UC education remains accessible to all Californians who meet its admissions standards. This goal is articulated in California’s Master Plan for Higher Education, which calls for UC to admit all eligible freshmen and transfers, with freshman eligibility designed to capture the top 12.5 percent of California public high school graduates.

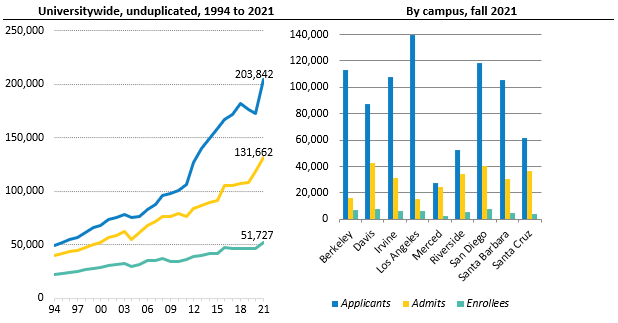
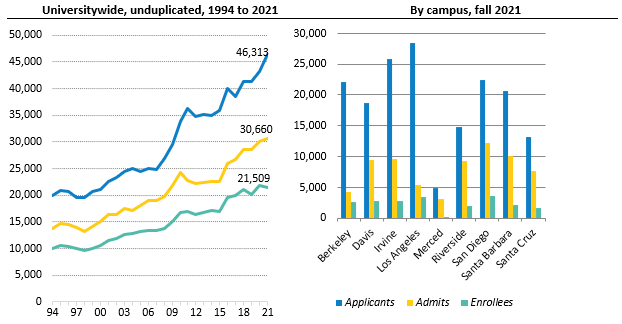
Of the over 250,000 applications for admission in fall 2021, about 204,000 students applied as freshmen and 46,000 as transfers. Campus admission decisions are based on a comprehensive review of qualifications and establish the incoming California resident class size based on State funding. UC’s total undergraduate enrollment of California residents increased by more than 1,500 in fall 2021 compared to the prior year, with a total increase of almost 21,000 since fall 2015.

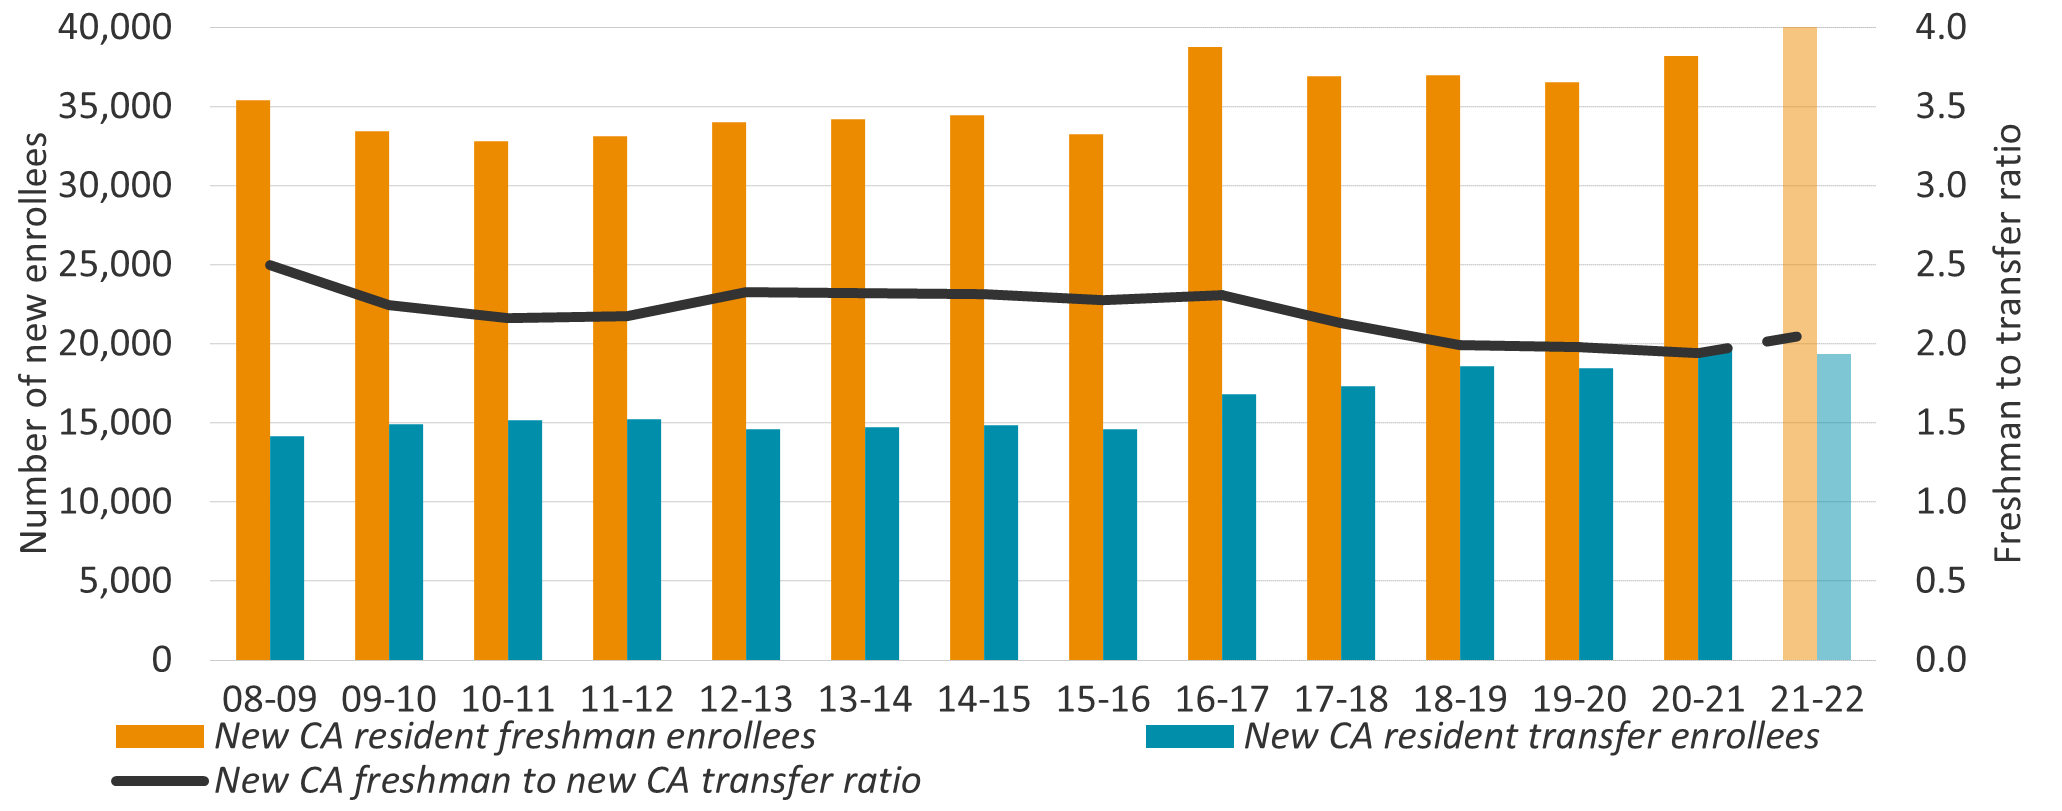
For 2021–22, UC is expected to achieve its goal to enroll two new freshman to one new transfer California resident undergraduates, excluding Merced, for the fifth year in a row. The UC Transfer Pathways support this goal by helping community college students prepare for transfer admission to the most popular majors at UC campuses. Expanding on its campus-based Transfer Admission Guarantees (TAGs), UC developed the Pathways+ option for community college students who want to both secure guaranteed admission to a TAG campus in a particular major while also preparing for admission to all campuses that offer the major. The first cohort for the Pathways+ program enrolled in fall 2021.

Admissions — freshmen

UC utilizes a comprehensive review process to make admission decisions, considering not only completion of rigorous college preparatory courses and high school GPA, but also talents, special projects, accomplishments in light of life experiences and circumstances, extracurricular activities, and community service. UC eliminated the standardized testing requirement for freshman applicants starting with the fall 2021 incoming class. The University also made temporary adjustments to its admission requirements, including suspending the grade requirement for A–G courses taken between the spring 2020 and summer 2021 terms.

The rapid growth in freshman applications to UC over the past two decades demonstrates the increased demand for a college education, the growth of California’s population, and UC’s continued popularity. UC continues to meet its Master Plan goals of guaranteeing admission to California resident applicants who are either in the top nine percent of high school graduates statewide or the top nine percent of graduates from their own high schools. Qualified freshman applicants are offered an opportunity to be admitted to another UC campus if they do not receive an offer of admission from the UC campuses where they applied.

Admissions — transfers

Almost all transfer students enter UC as upper-division juniors. Campus enrollment targets are based on State funding as well as capacity in major programs at the upper-division level.

UC’s Transfer Pathways identify a common set of lower-division courses for each of 20 of the most popular majors among transfer applicants. The Transfer Pathways present a clear roadmap for prospective transfers to prepare for their majors and be well positioned to graduate in a timely fashion from any UC campus. In fall 2021, the fourth year of the Transfer Pathways, those indicating Pathway-based preparation represented 49 percent of all CCC admits and 50 percent of all California Community College (CCC) enrollees. Many of these students also participated in other preparatory programs such as TAG and Intersegmental General Education Transfer Curriculum (IGETC).

  • Transfer Pathways Majors​
    Anthropology Computer Science Molecular Biology
    Biochemistry Economics Philosophy
    Biology Electrical Engineering Physics
    Business Administration English Political Science
    Cell Biology History Psychology
    Chemistry Mathematics Sociology
    Communication Mechanical Engineering

In April 2018, UC signed an agreement with the CCCs to guarantee a place within the UC system to students who complete one of the Transfer Pathways and achieve the requisite grade point average (GPA). The new Pathways+ program launched in August 2019.

Enrollments

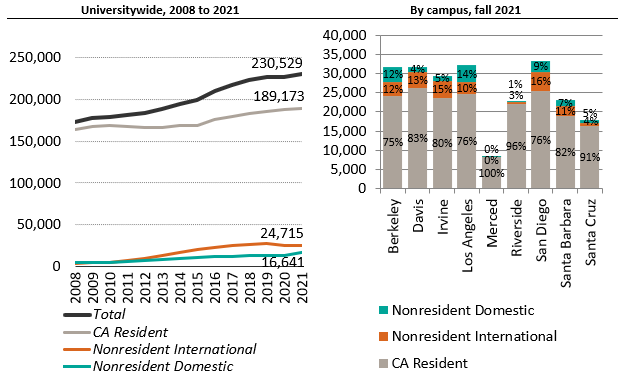
The University enrolled over 230,000 undergraduates in fall 2021. The University enrolls freshman and transfer students from almost every county of California. 

Undergraduate Enrollment, Fall 2021
New Freshmen 51,728
New Transfers/Other[1] 21,837
Continuing Students 156,964
TOTAL 230,529

Source: UC Data Warehouse

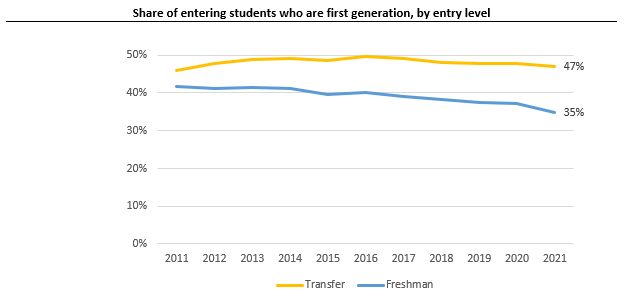
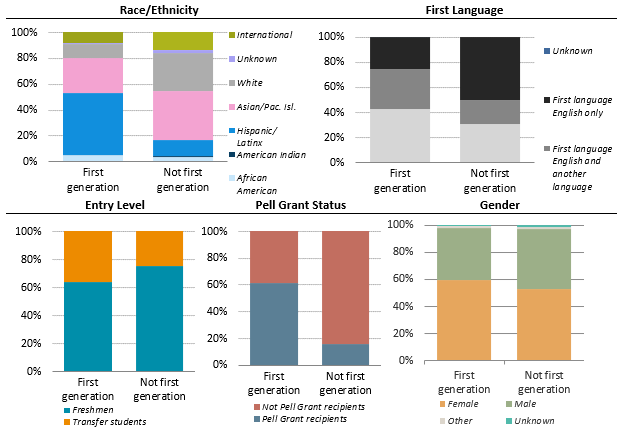
As academic qualifications have improved over the last decade, UC has maintained access for populations historically underserved by higher education. In fall 2021, 33 percent of new undergraduates received Pell Grants, a marker for low-income status. About 38 percent of UC’s entering students are first-generation, meaning neither parent graduated from a four-year college — 47 percent of transfer students and 35 percent of freshman students. The first-generation share of transfer students has been fairly steady for the past decade, but the freshman share has declined in recent years (1.2.1). First-generation students are more likely to be from an underrepresented group (URG: African American, Hispanic/Latino(a) and Native American/Alaska Native students), to have a first language other than English, to enter as a transfer student, to be female, and/or to have a lower income than students with at least one parent who graduated from a four-year college (1.2.2).

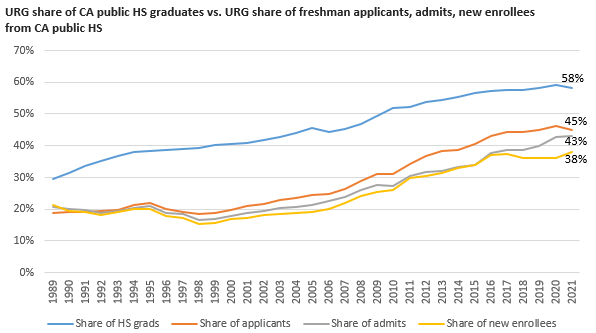
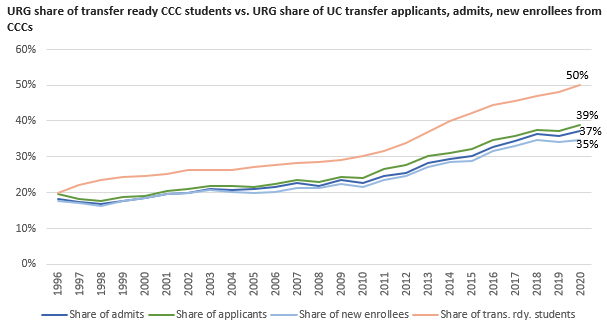
The share of freshman applicants, admits, and enrollees from underrepresented groups (URGs) has not kept pace with the share of California public high school graduates from URGs, leading to increasing equity gaps over the last two decades. In 2021, 58 percent of California public high school graduates were from underrepresented groups  while 38 percent of new freshman enrollees at UC were from these groups, for a 20-percentage point gap (down from 23 percentage points in 2020) (1.2.3). Similarly, the share of transfer applicants, admits, and enrollees from URGs does not reflect the share of transfer-ready CCC students who are from URGs. In 2020, 50 percent of CCC transfer-ready students were from URGs while 35 percent of UC transfer students from UC were from URGs, for a 15-percentage point gap (up from 12 percentage points in 2019) (1.2.4).

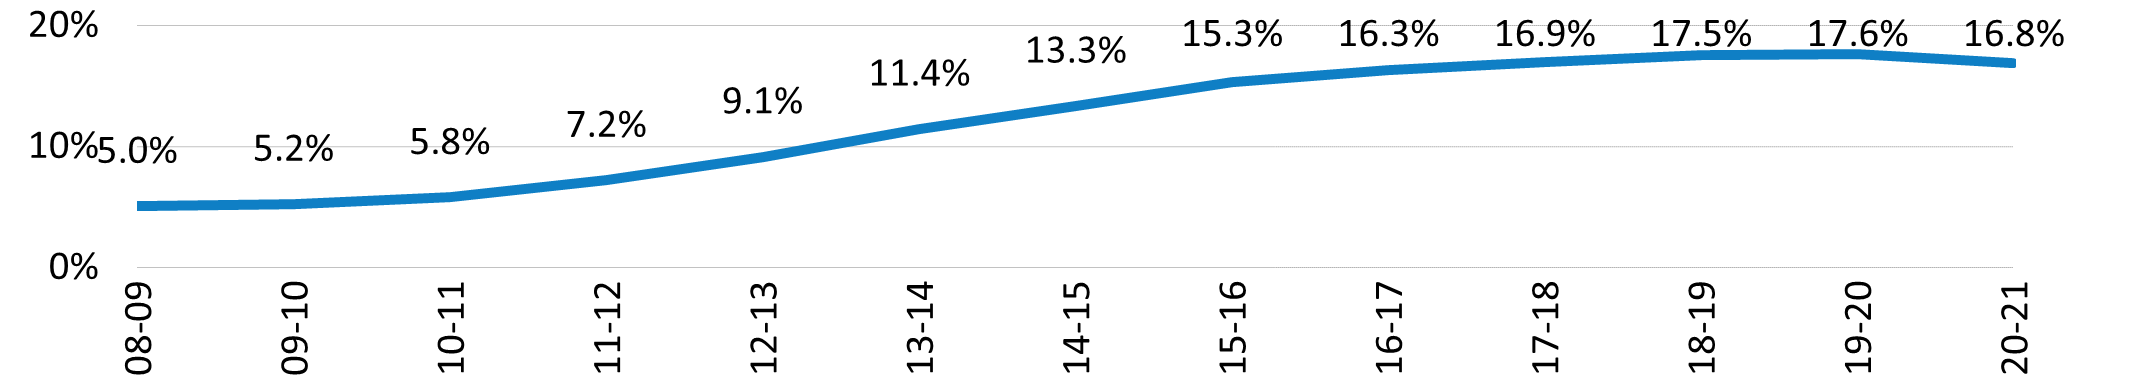
The share of all undergraduates who are nonresident domestic and international students has increased in recent years, though their proportion is still much lower than at comparable public research universities. In 2020–21, the share of all undergraduates paying nonresident tuition went down slightly (1.4.4). In May 2017, UC adopted a policy[1] affirming that nonresident undergraduates “will continue to be enrolled in addition to, rather than in place of, funded California undergraduates at each campus.” The policy also capped nonresident enrollment at 18 percent for five UC campuses (Davis, Merced, Riverside, Santa Barbara, and Santa Cruz) and, for the remaining four campuses (Berkeley, Irvine, Los Angeles, and San Diego), at the proportion each campus enrolled in 2017–18. The policy went into effect for the 2018–19 academic year.

Having California students learn and live alongside students from backgrounds and cultures different from their own is part of a world-class educational experience. California students also benefit from the extra tuition paid by nonresident undergraduates, which is about $31,000 more per year than the amount paid by residents. That tuition helps to fund faculty hires, instructional technology, student advising, and other services that directly benefit California students.

[1] Regents Policy 2109: Policy on Nonresident Student Enrollment: regents.universityofcalifornia.edu/governance/policies/2109.html.

Admissions and enrollment trends

Freshman applicants have gone up from 73,000 to 204,000 over the past two decades, averaging five percent growth per year. In fall 2021, the number of applicants increased 18 percent compared to the previous year, while the number of students admitted went up 11 percent and the number of enrollees went up 11 percent (1.1.1). The fall 2021 incoming cohort applied to UC and made choices about whether and where to attend college during the COVID-19 pandemic. Application, admit, and enrollment numbers are all up from the year before but admitted students were still deciding to come to UC at a lower rate than in recent pre-pandemic years, leading campuses to admit a higher proportion of applicants in order to meet enrollment goals. The elimination of the standardized testing requirement may have encouraged more freshman applicants in fall 2021 compared to previous years. A more comprehensive analysis will be conducted to examine the influence of this admissions policy change on student application behavior and learning outcomes.

Fall transfer applicants more than doubled over the last 20 years, with average annual growth of four percent. In fall 2021, transfer applicants increased by seven percent, and admits increased by two percent compared to the previous year, while enrollees went down one percent (1.1.2).

The Master Plan specifies that the University maintain a 60:40 ratio of upper- to lower-division students, which corresponds to a 2:1 ratio of new California resident freshmen to new California resident transfers. UC has moved from 2.3:1 in 2016–17 to an estimated 2.1:1 in 2021–22 (Universitywide). Excluding Merced, the ratio for 2021–22 is estimated to be 2.0:1, meeting the systemwide goal five years in a row. The University continues to work toward achieving this ratio for each campus each year (except Merced) (1.1.3). Overall undergraduate enrollment (new and continuing students) continued to grow in fall 2021. Total enrollment was almost 231,000 in fall 2021, up two percent from the year before. This includes an increase in California residents of over 1,500 from the year before with a total increase of almost 21,000 since fall 2015 (1.1.4).

Academic preparation

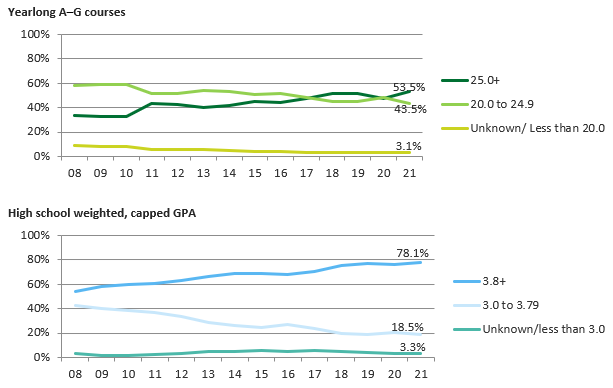
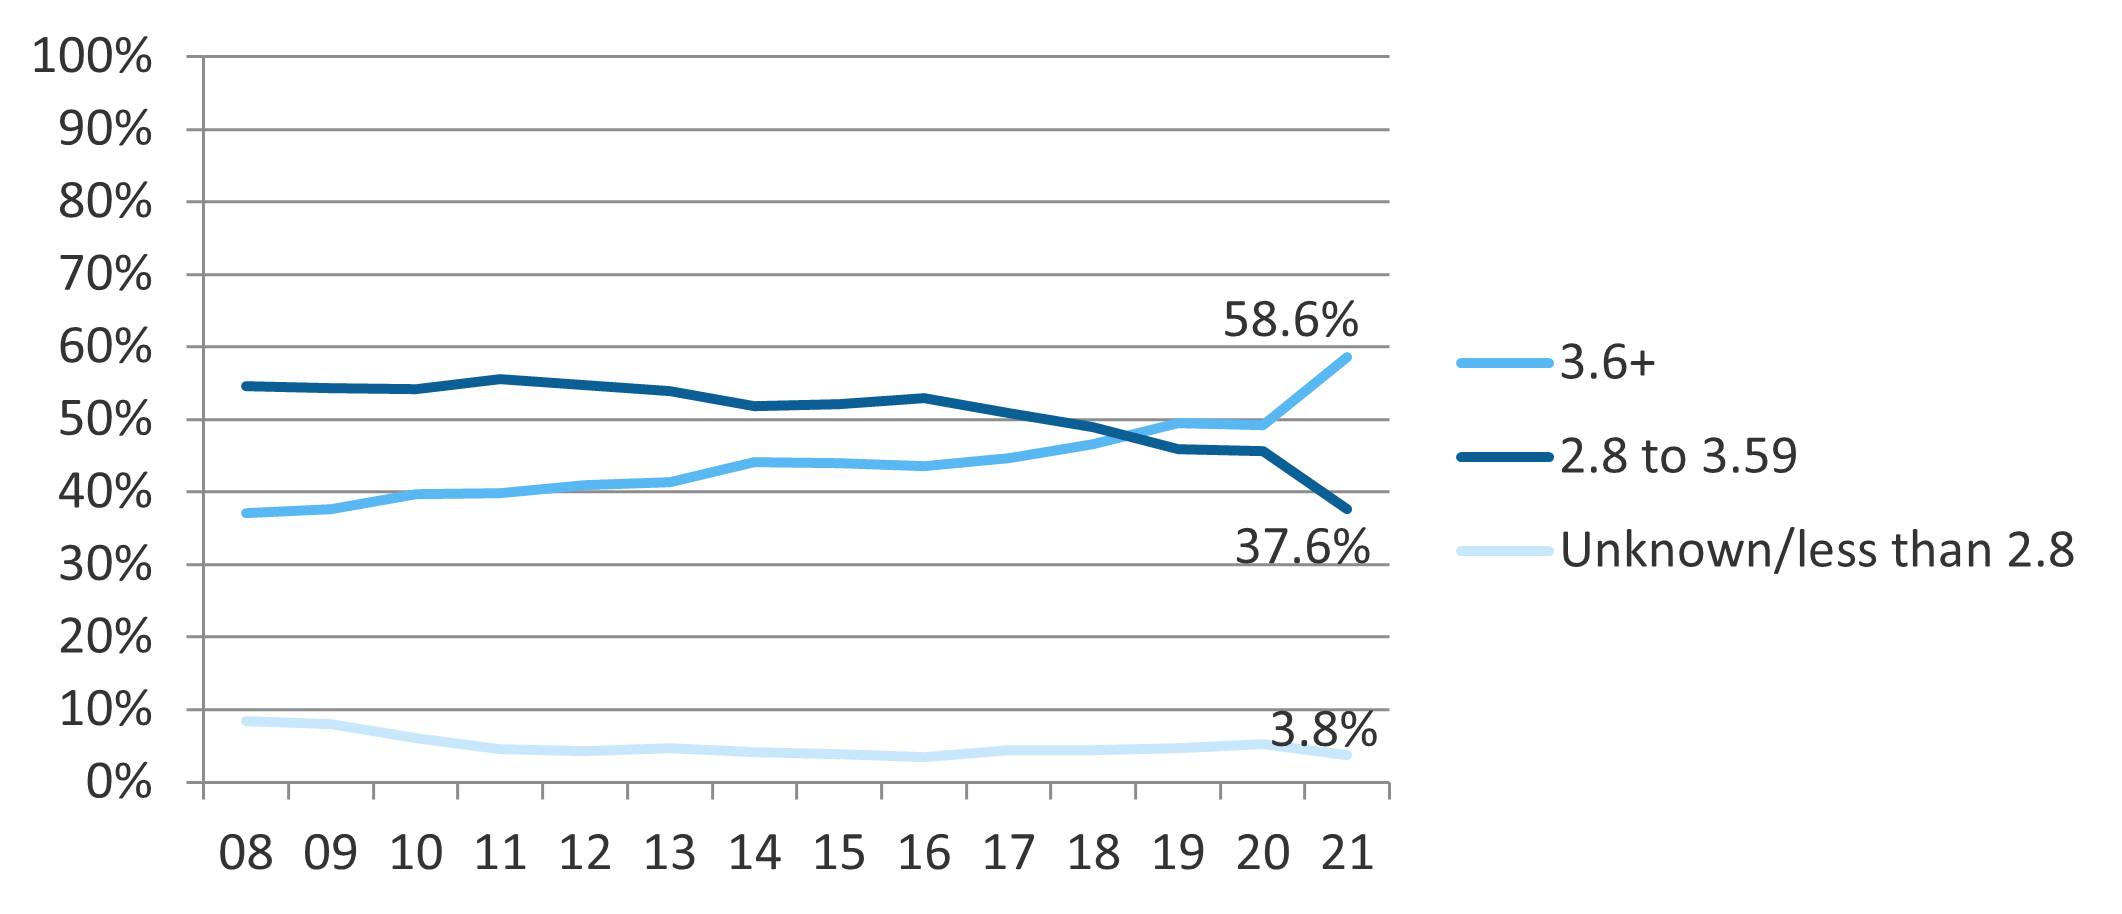
Freshmen entering UC are increasingly well prepared, as shown by changes in the number of college preparatory courses and high school GPA over time (1.3.1). Transfer students are also increasingly well prepared, as measured by college GPA over time (1.3.2).

Geographic origins and nonresidents

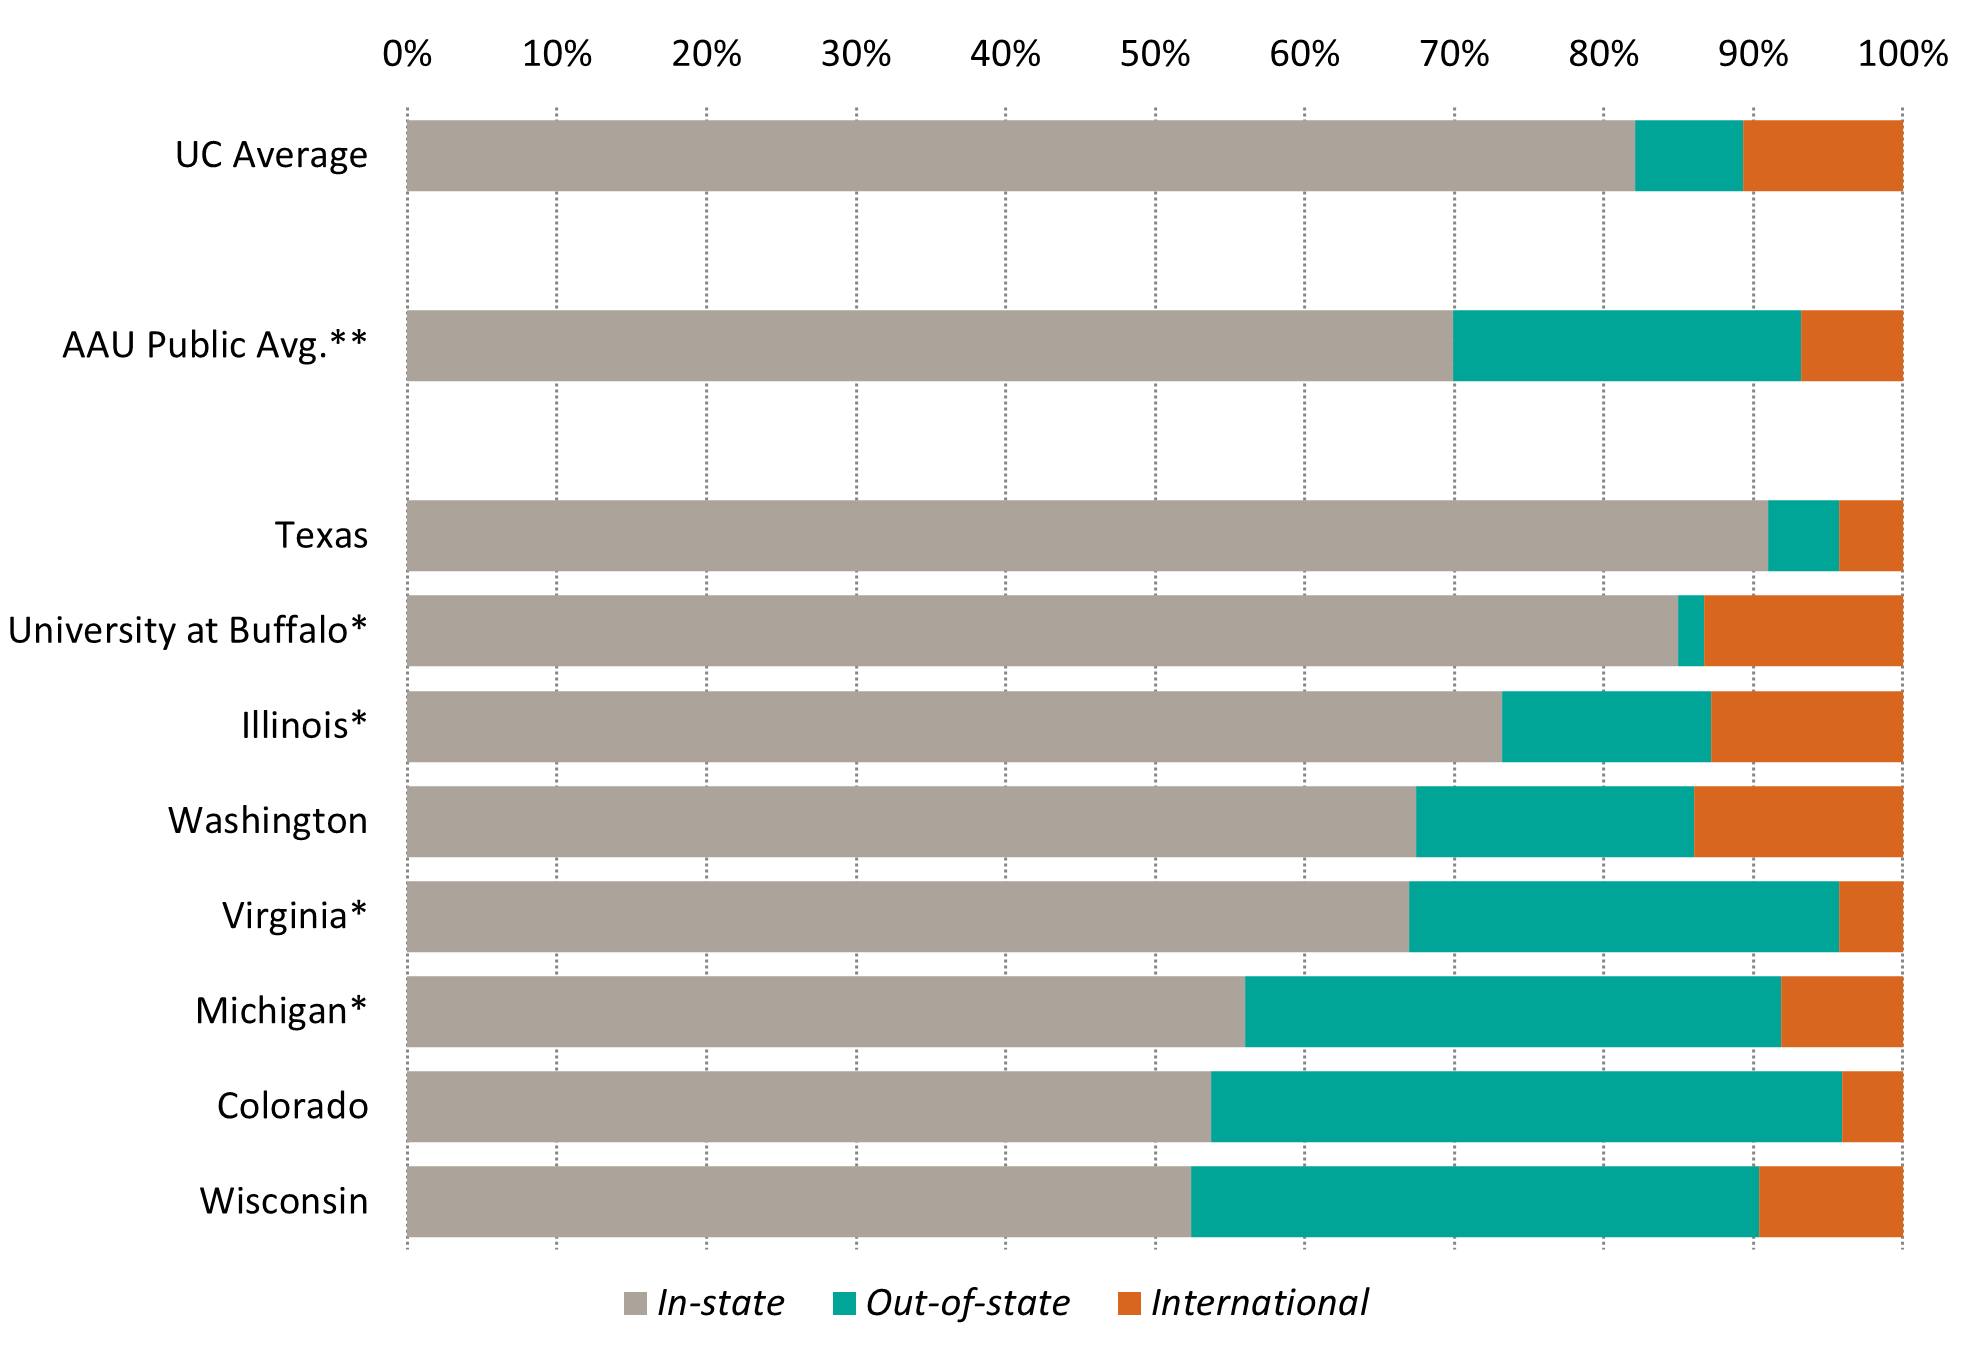
UC has a lower proportion of out-of-state undergraduates than other public AAU universities. In fall 2021, only 17.9 percent of UC’s enrollees were out-of-state or international, compared with 30.1 percent for other AAU public institutions (1.4.1).

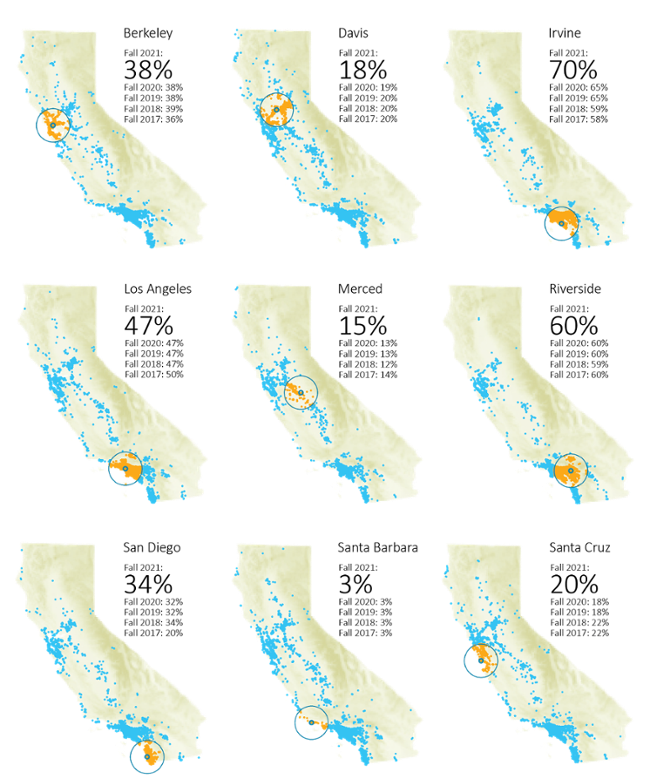
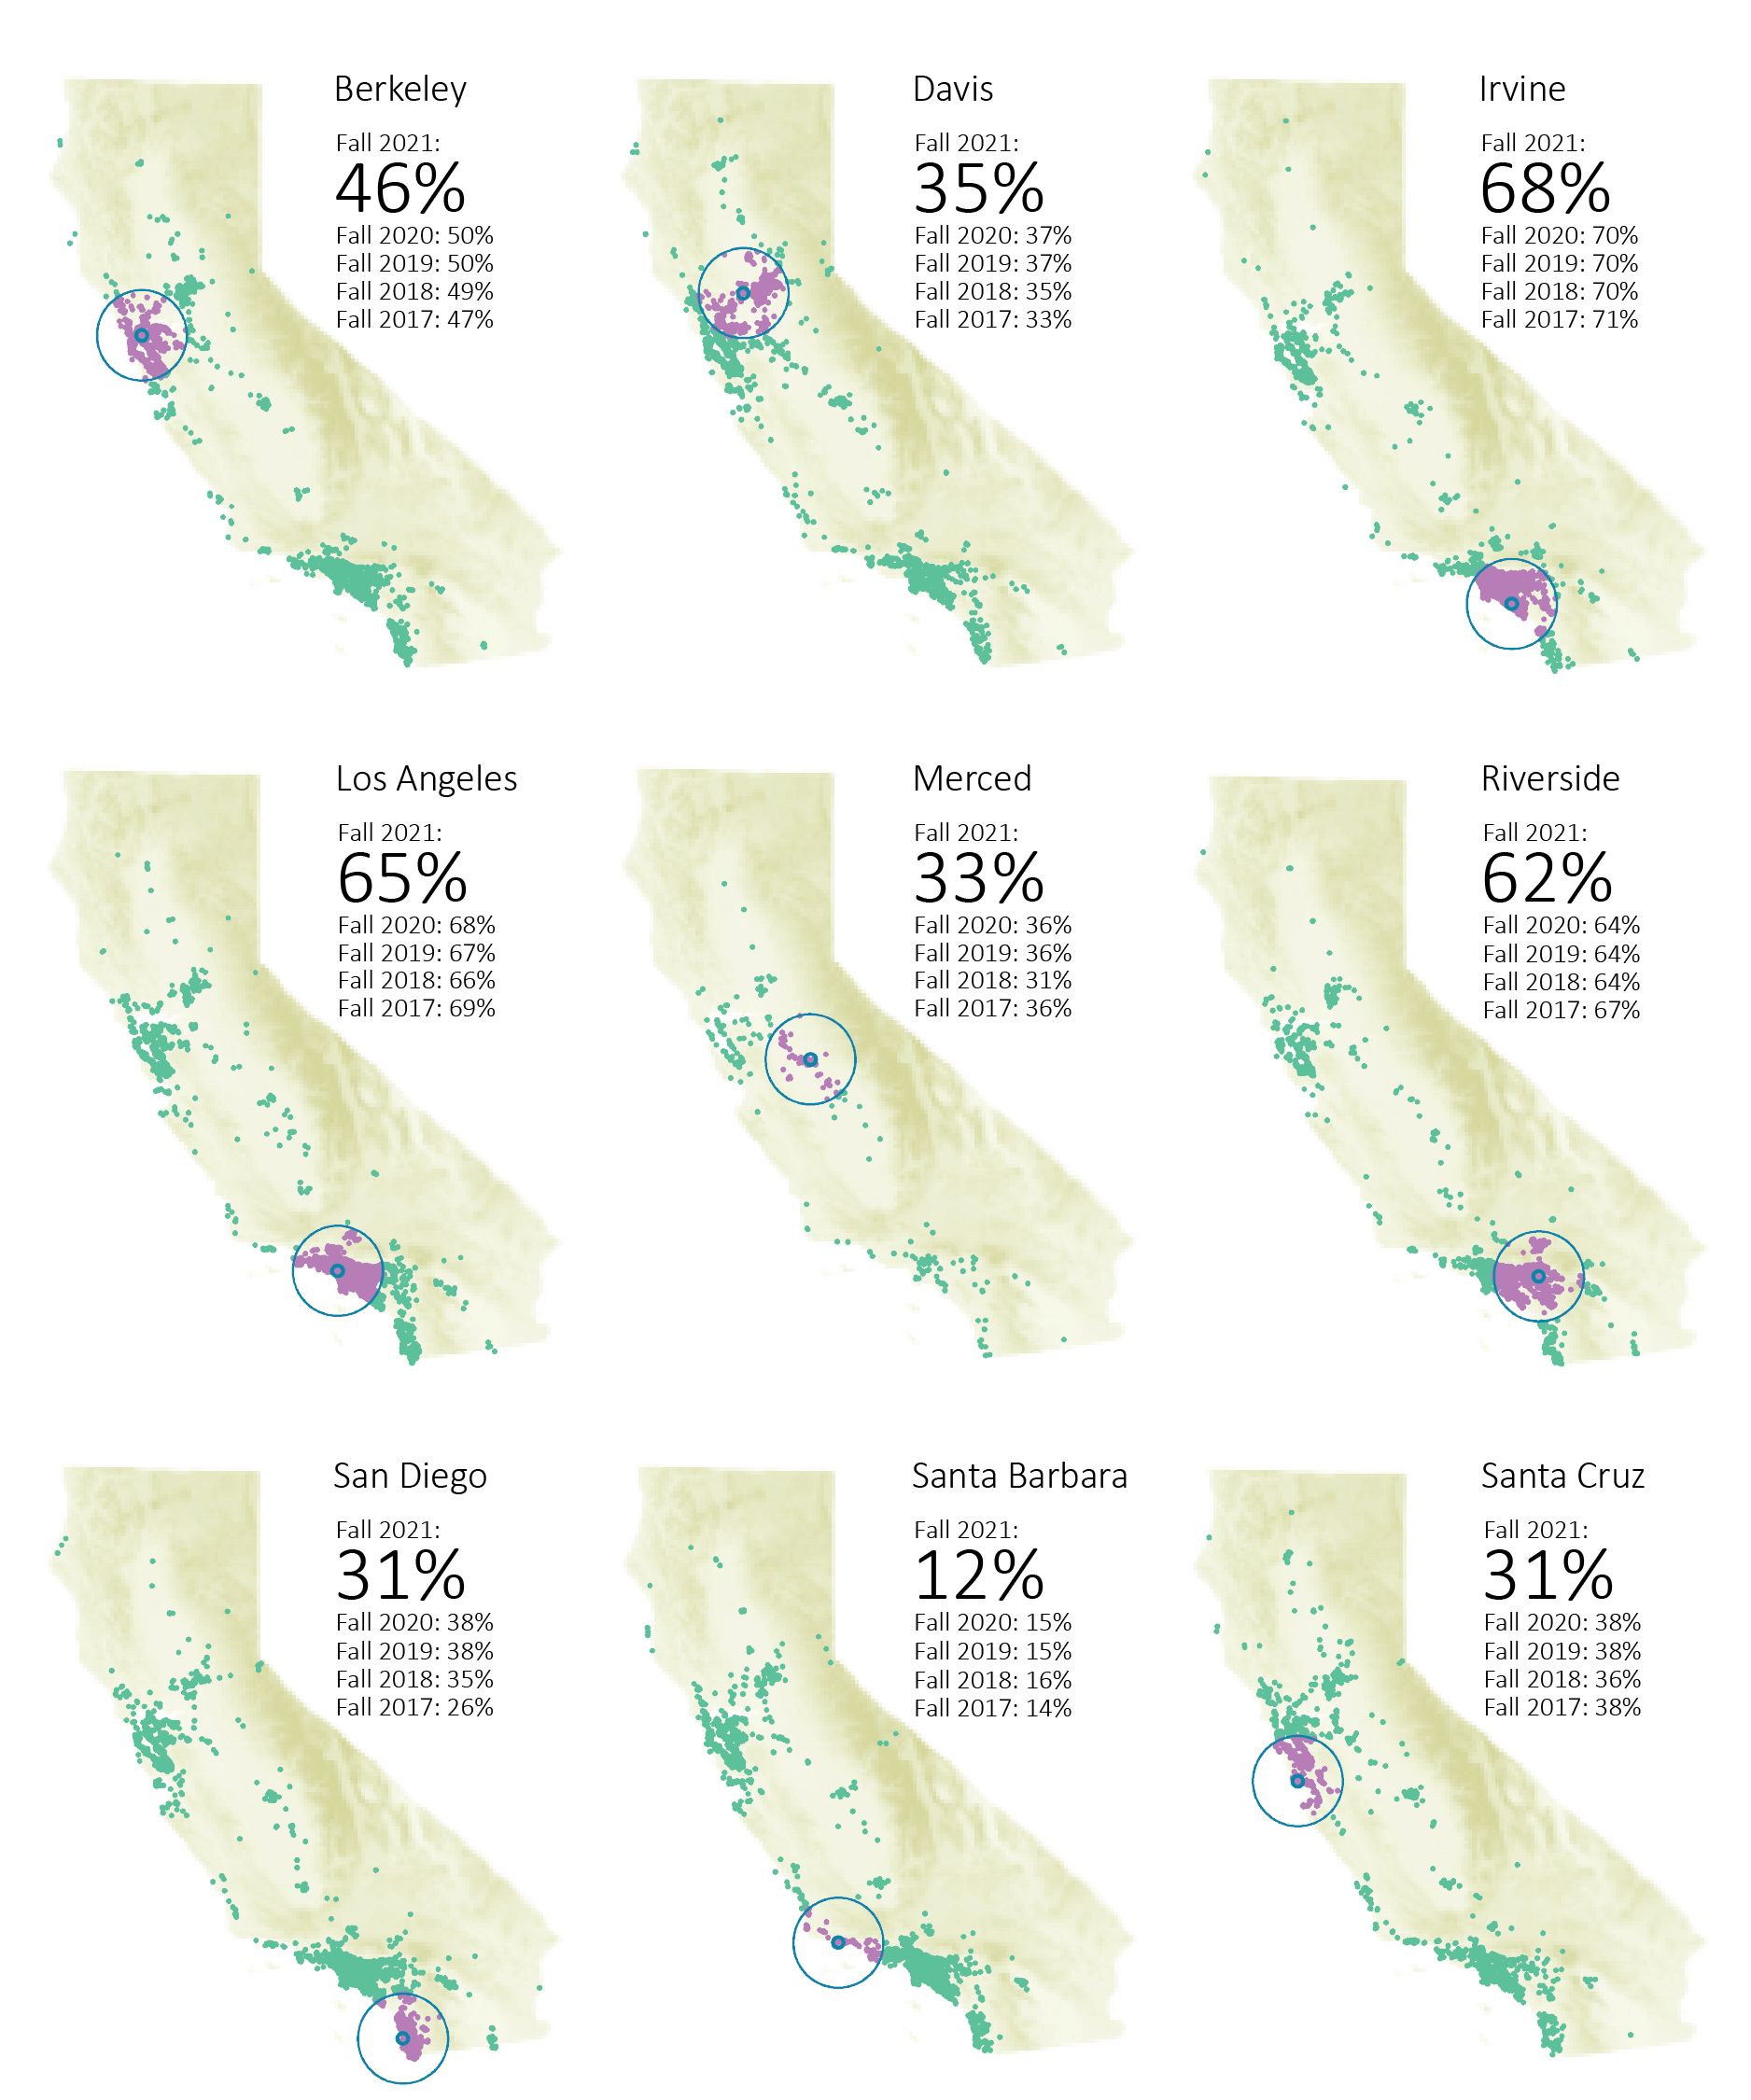
About 36 percent of freshmen and 48 percent of transfer students entering UC campuses come from within 50 miles of their campus. These numbers are relatively stable and have changed only slightly over the past few years (1.4.2, 1.4.3).

The percentage of all undergraduates paying nonresident tuition went down slightly in 2020–21 (1.4.4).

Looking ahead

Enrollment of new freshman increased in fall 2021 after being fairly steady for the last few years. Enrollment of transfer students has been fairly steady for the last few years, including fall 2021. Overall enrollment will need to grow for UC to meet its goal of awarding an additional 200,000 degrees (for a total of 1.2 million) by 2030. State funding is crucial for reaching this goal. UC also continues to work to close equity gaps.


For more information
Information on admissions (website)

Data on UC admissions:


Data on UC fall enrollment (dashboard)


Demand for UC admission from freshman applicants remains high.

1.1.1 Freshman applicants, admits, and enrollees, Universitywide and UC campuses, Fall 1994 to 2021

1.1.1

Source: UC Data Warehouse1

After two years of declines, unduplicated freshman applicants increased 18 percent from 2020 to 2021 to a record high of almost 204,000. Coming after a period of rapid growth from 2011 to 2019, this resulted in total growth of 92 percent from 2011 to 2021 (or seven percent per year). This growth over the last decade represents about 98,000 applicants, including about 43,000 California residents

Most campuses admit less than half of freshman applicants. Many applicants apply to more than one UC campus; in fall 2021, UC applicants applied to an average of 4.0 campuses. Freshman applications increased at all campuses in fall 2021. For data tables on UC freshman applicants, admits, and enrollees by campus over time, see: universityofcalifornia.edu/infocenter/admissions-residency-and-ethnicity.

1 Admits and enrollees here include applicants guaranteed admission who are not offered admission at a campus to which they applied but who are referred to and admitted by another campus. Some campuses admit fall applicants for a subsequent term (winter or spring). These “rollover” admits and enrollees are excluded in this indicator. Students who apply to multiple UC campuses are counted only once in the Universitywide indicator. A change in accounting for referral students is responsible for the apparent drop in 2011 admits. Beginning that year, UC Merced admitted only students who indicated interest in a referral offer, rather than every student who qualified for an offer.


Transfer applicants, admits, and enrollees are higher than ever.

1.1.2 Transfer applicants, admits, and enrollees, Universitywide and UC campuses, Fall 1994 to 2021

1.1.2

Source: UC Data Warehouse1

Transfer applications increased by seven percent and admits increased by two percent, while enrollees decreased by one percent in fall 2021. Over 46,000 transfer students applied, over 30,000 were admitted, and over 21,000 enrolled in fall 2021. Consistent with UC’s commitment to transfer students from California Community Colleges (CCCs), fall enrollment of new CCC California resident transfers has more than doubled since 1994, from 8,400 to 20,200. The average transfer applicant applies to 3.7 UC campuses, compared to 4.0 for the average freshman applicant.

For data tables on UC transfer applicants, admits, and enrollees by campus see:
universityofcalifornia.edu/infocenter/admissions-residency-and-ethnicity.

1 Admits and enrollees here include the referral pool. Some campuses admit fall applicants for a subsequent term (winter or spring). These “rollover” admits and enrollees are excluded in the graphs here, which only show fall data.


UC has met the systemwide goal of a 2:1 ratio of new California resident freshmen to transfer students and is on track to meet the goal at all campuses.

1.1.3 New California resident freshmen and transfer students, Universitywide, 2008–09 to 2021–22

1.1.3

Source: UC Data Warehouse and UC campuses1

The California Master Plan calls for UC to accommodate all qualified resident California Community College (CCC) transfer students. It specifies that the University maintain at least a 60:40 ratio of upper-division (junior and senior) to lower-division (freshman and sophomore) students to ensure adequate upper-division spaces for CCC transfers. To do so, UC aims to enroll one new California resident transfer student for every two new California resident freshmen, or 67 percent new resident freshmen to 33 percent new resident transfer students.2 UC has moved from 2.3:1 in 2016–17 to an estimated 2.1 in 2021–22 (Universitywide). Excluding Merced, the ratio for 2021–22 is also estimated to be 2.0:1, meeting the systemwide goal five years in a row.3 Davis and Riverside did not meet the goal in 2021–-22 primarily due to unexpectedly large freshman classes.

2021–22*

% New CA resident freshmen

% New CA resident transfers

Ratio of new CA freshmen to new CA transfers

Berkeley

67%

33%

2.0

Davis

67%

33%

2.1

Irvine

66%

34%

1.9

Los Angeles

61%

39%

1.6

Merced

88%

12%

7.2

Riverside

69%

31%

2.2

San Diego

66%

34%

2.0

Santa Barbara

66%

34%

2.0

Santa Cruz

69%

31%

2.2

Universitywide, all campuses

67%

33%

2.1


1 Full year headcount enrollment.
2 Nearly all (96 percent) of California resident transfer students in 2020–21 came from CCCs.
3 Merced is excluded from the 2:1 ratio goal that was part of the Budget Framework agreement with the State of California.


UC’s fall undergraduate headcount grew slightly between fall 2020 and fall 2021, including over 1,500 additional California residents.

1.1.4 Undergraduate headcount enrollment, Universitywide and UC campuses, Fall 2008 to 2021

1.1.4


Source: UC Data Warehouse

The University and the state share the goal of expanding access to a UC education. The University enrolled over 1,500 additional California residents in fall 2021 compared to fall 2020, with a total increase of almost 21,000 since fall 2015.


About half of UC's entering transfers and about one third of UC's entering freshmen are first-generations students.

1.2.1 Entering students by first generation status1, Universitywide, Fall 2011 to 20211.2.1

Source: UC Data Warehouse1

Almost half (47 percent) of entering transfer students were first-generation in fall 2021 compared to just over one-third (35 percent) of entering freshman students. The first generation share of transfer students has been fairly steady over the past decade, while the first generation share of freshman students has declined in recent years.

1 First-generation students are those whose parent(s) did not complete a four-year college degree. Total of first-generation students is 28,193 (38.3 percent); not-first-generation students total 43,270 (58.8 percent); and missing/unknown are 2,102 (2.9 percent).


1.2 DEMOGRAPHIC OUTCOMES

UC’s entering first-generation students are more likely to be from an underrepresented group (URG), to enter as transfer students, and/or to be Pell Grant recipients.

1.2.2 Entering students by first-generation status, race/ethnicity, first language spoken at home, entry level, Pell Grant status, and gender, Universitywide, Fall 2021

1.2.2

Source: UC Data Warehouse1

Over half (53 percent) of entering first-generation students in fall 2021 are from URGs, compared to 17 percent of not-first-generation students. Over two-fifths (43 percent) of first-generation students’ first language was not English, versus 31 percent for others. Over one-third (36 percent) of first-generation students entered as transfers, versus 25 percent for others. Over three-fifths (62 percent) of first-generation students are lower-income Pell Grant recipients, versus 16 percent for others. And nearly three-fifths (59 percent) of first-generation students are female, compared to just over half (52 percent) of others. In all cases, the gaps between first-generation and not-first-generation students grew slightly between 2020 and 2021.

1 Those with unknown first-generation status are excluded from this indicator. Pell Grant receipt is used as a proxy for low-income status. Less than .01 percent of entering students have an unknown first language. Gender is unknown for one percent of students and students in the “other” gender category make up less one percent of the total. The “other” gender category includes Different Identity, Genderqueer or Nonbinary Gender, Trans Female/Trans Woman, and Trans Male/Trans Man


1.2 DEMOGRAPHIC OUTCOMES

The gap between the share of URG high school graduates and URG freshman enrollees decreased in 2021, but still persists.

1.2.3 Underrepresented Groups (URGs) as a share of California public high school graduates vs. a share of freshman applicants, admits, and new enrollees from California public high schools, Universitywide, Fall 1989 to Fall 2021

 1.2.3

Source: UC Data Warehouse, UC Admissions Digest, California Department of Education, California Department of Finance

Before Proposition 209 took effect in 1998, the gap between the share of URGs among CA public high school graduates and the share of URGs among UC freshman enrollees from CA public high schools was in the eight to 22 percentage point range, with most years below 20 percentage points. This gap has stayed in the 20-25 percentage point range since 1998. In 2021, 58 percent of California public high school graduates were from underrepresented groups (URGs) while 38 percent of new freshman enrollees at UC were from these groups, for a 20-percentage point gap (down from 23 percentage points in 2020).

Generally, the gaps for UC freshman applicants and admits (vs. CA public high school graduates) are smaller than the gap for UC freshman new enrollees. For example, the gap for UC freshman applicants has been betwenn 13 and 21 percentage points since 1998 while the UC freshman admit gap has been between 15 and 25 percentage points. In 2021, the applicant gap was 13 percentage points and the admit gap was 15 percemtage points.


1.2 DEMOGRAPHIC OUTCOMES

The gap between the share of transfer ready CCC students who are from URGs and the share of CCC transfer new enrollees who are from URGs has grown in recent years.

1.2.4 Underrepresented Groups (URGs) as a share of transfer ready1 California Community College (CCC) students  vs. a share of UC transfer applicants, admits, and new enrollees from CCCs, Universitywide, Fall 1996 to Fall 2020

1.2.4

Source: UC Data Warehouse, California Community Colleges Chancellor’s Office

The gap between the URG share of transfer ready CCC students and the URG share of UC transfer enrollees from CCCs has gone from six percentage points in 2003 to 15 percentage points in 2020.

The gaps between the URG share of transfer ready CCC students and the URG share of UC transfer applicants and admits are generally lower than the gap for new enrollees. The applicant gap has grown from five percemtage points in 2003 to 13 percentage points in 2020. The admit gap has gone from four percentage points in 2003 to 11 percentage points in 2020.

1 Transfer ready students are those who have successfully completed a transferable English and a transferable math course and have earned 60+ transferable units with a 2.00+ GPA. These data reflect the number of students who reach this status each year. “Transfer-ready” is a proxy for students who are ready for UC admission.


Freshmen entering UC are increasingly well-prepared.

1.3.1 A–G (college preparatory)1 courses and weighted, capped high school grade point average (GPA)2 of entering freshmen, as share of class, Universitywide, Fall 2008 to Fall 2021

1.3.1


Source: ApplyUC data (A–G courses) and UC Data Warehouse (GPA)

The academic indicators of UC’s entering freshmen have improved over time, as reflected by an increase in the share of students completing 25 or more college-preparatory courses and having a 3.8 or higher high school GPA. From 2008 to 2021, the first indicator went up from 33 percent to 53 percent, while the second went up from 54 percent to 78 percent.

1 A-G courses refer to those high school courses that UC has reviewed and approved as college preparatory. The minimum number of required A-G courses is 15.
2 Weighted, capped GPA means that students may receive a maximum of eight semesters of honors credit. More information is available at admission.universityofcalifornia.edu/freshman/california-residents/admissions-index/index.html.


UC transfer students in fall 2021 were better prepared academically than their counterparts a decade ago, as measured by their grades.

1.3.2 College grade point average (GPA)1 of entering transfer students, as share of class, Fall 2008 to Fall 2021, Universitywide

1.3.2

Source: UC Data Warehouse and UC Corporate Student System

The academic qualifications of transfer students entering UC have improved over time, as reflected by an increase in the share of students having a 3.6 or higher college GPA, from 37 percent in fall 2008 to 59 percent in fall 2021. The notable increase in high GPAs in fall 2021 may be partially due to the increase in Pass/No Pass grading during the COVID era.

1 The transfer GPA is based on grades for college-level academic courses from the college(s) where students were previously enrolled.


UC has consistently had a substantially lower proportion of out-of-state undergraduates than other AAU universities in recent years. In fall 2021, only 17.9 percent of UC’s enrollees were out-of-state or international, compared with 30.1 percent for other AAU Public institutions.

1.4.1 Residency of undergraduate students, Universitywide and comparison institutions, Fall 2021

1.4.1

Source: UC Data Warehouse (UC numbers) and Common Data Set (comparator numbers)
*UC’s four comparison public institutions. **AAU public average excludes UC; also excludes University of Missouri Columbia,
University of Florida because data not available

UC’s priority is to enroll California residents. Campuses enroll nonresident students based on available physical and instructional capacity and the campus’ ability to attract qualified nonresident students.

Nonresidents provide geographic and cultural diversity to the student body. They also pay the full cost of their education. In 2021–22, systemwide tuition and fees for a nonresident undergraduate were $41,196, compared to $11,442 for California resident students.

Nonresident applicants must meet higher criteria to be considered for admission. The minimum high school GPA for nonresident freshmen is 3.4, compared to 3.0 for California freshmen. The minimum college GPA for nonresident transfer students is 2.8, compared to 2.4 for California residents.


The proportion of undergraduate students paying nonresident tuition declined slightly in 2020–21.

1.4.2 Percentage of undergraduate enrollees paying nonresident tuition by academic year1, Universitywide, 2008–09 to 2020–21

1.4.2 

Source: UC Data Warehouse

Systemwide, the share of all undergraduates paying nonresident tuition declined slightly from 17.6 percent in 2019-20 to 16.8 percent in 2020-21. Over the last decade, this share rose from 5.8 percent in 2010-11 to 16.8 percent in 2020-21. From 2009–10 to 2015–16, the proportion of undergraduates paying nonresident tuition went up from 5.2 percent to 15.3 percent. This increase coincided with a period of reductions in State funding for UC due to the Great Recession. Starting in 2016–17 as enrollment of new California residents increased, the proportion of undergraduates paying nonresident tuition leveled off in the 16-18 percent range.During the COVID-19 pandemic, the percentage dropped to 16.8 in 2020–21.


The proportion of nonresident students at individual campuses varies depending on a campus’ capacity, and its ability to attract nonresident students, as well as its nonresident cap under a policy approved in May 2017, which applies to total undergraduate numbers. Under the policy, effective in 2018–19, nonresident enrollment was limited to 18 percent at five UC campuses. At the other four campuses where the proportion of nonresidents already exceeded 18 percent — UC Berkeley, UC Irvine, UCLA, and UC San Diego — nonresident enrollment is capped at the proportion that each campus enrolled in 2017–18.

1 This chart uses year average headcount enrollment, the average headcount across all terms in the academic year (three quarters or two semesters). Not all nonresident students pay nonresident tuition. Some have statutory exemptions, such as AB 540 students, children of UC employees, and others designated by the State. AB 540 students are considered California residents for tuition purposes as established by Assembly Bill 540, passed in 2001.


UC campuses attract freshmen from nearby regions and the major urban areas of California, with a systemwide local attendance rate of 36 percent.

1.4.3 Percentage of new CA resident freshman enrollees whose home is within a 50-mile radius of their campus, UC campuses1, Fall 2021

1.4.3

Source: UC Data Warehouse and UC Corporate Student System.

1California residents are defined here as those with permanent addresses in California.


Local enrollment rates for transfers are higher than for freshmen, with 48 percent enrolling at a UC campus within 50 miles of their homes.

1.4.4 Percentage of new CA resident transfer enrollees whose home is within a 50-mile radius of their campus, UC campuses1, Fall 2021

1.4.4

Source: UC Data Warehouse and UC Corporate Student System.
[1] California residents are defined here as those with permanent addresses in California.