Chapter 3:
Undergraduate success

Aspiring novelist Woody Brown is going to have quite the author’s bio on a future dust jacket.
“I grew up a mighty weird autistic kid who was presumed to be retarded because I couldn’t speak,” he says. “My intelligence was not fully acknowledged until I went to Pasadena City College, where they accepted me and my upward trajectory began.” Three years later Woody graduated with a 4.0 and honors, and got accepted to UCLA.
Now in his senior year, Brown celebrates the “intellectual revelation” he’s experienced at UCLA as an English major. His accomplishments became evident when the English department honored him with the 2020-2021 Christopher Zyda Creative Writing Award.
“I am so happy that people are interested in my story,” Brown says. “Not only am I acting as a tour guide to my world for those who are unfamiliar with it, but I also have a larger mission. I want to act as a role model for others like me, to show that the door to success in the mainstream world is not locked against us.”
Filling California’s gap in degree recipients
The Public Policy Institute of California projects the state in 2030 will face a shortfall of 1.1 million workers who have at least a bachelor’s degree. UC has committed to adding more than 160,000 bachelor’s degree recipients by 2029–30, by increasing graduation rates and improving timely graduation. By 2030, UC’s goal is to have nine of ten undergraduates leave with a degree, and to improve four-year freshmen graduation rates to 76 percent, and two-year transfer graduation rates to 70 percent. In addition, UC’s goal is to eliminate gaps in timely graduation for California’s Pell Grant recipients, first-generation students, and underrepresented groups (URG). UC seeks to partner with the State by receiving financial support to scale up promising programs and strategies that will help campuses achieve these goals. To date, UC has not received this financial support. Below is a progress report on these critical goals and other undergraduate alumni outcomes.
UC’s four-year graduation rates for freshmen have risen significantly over the past 21 years — from 46 percent for the 1997 entering cohort to 73 percent for the 2017 cohort. The most recent six-year graduation rate, for the 2015 entering cohort, is 86 percent (3.1.1), which has increased by seven percentage points since 1996. The six-year graduation rate is 89 percent when this measure includes students who transfer to non-UC institutions (3.1.2) and still graduate within six years. In addition, time to degree has steadily improved. The most recent freshman entrants are taking an average of 4.12 years (3.1.12) to graduate, an improvement on the 2000 cohort, which took 4.33 years.
Transfer entrants have made similar gains, with two-year graduation rates increasing from 37 percent for the 1997 entering cohort to 63 percent for the 2019 cohort (3.1.3). The most recent four-year graduation rate for transfers (2017 entering cohort) is 89 percent, an increase of about ten percentage points since 1997. The average time to degree is 2.4 years for the 2014 cohort, an improvement from 2.6 years for the 1996 cohort (3.1.12).
Although the overall freshman and transfer graduation rates have increased and are showing good progress toward UC 2030 goals, there are still gaps in rates between subgroups (3.1.4, 3.1.5, 3.1.6, 3.1.7, 3.1.8, 3.1.9, and 3.1.10). Low-income students, first-generation students, URG students, and less academically prepared students have lower average graduation rates, especially four-year graduation rates for freshmen, and two-year graduation rates for transfers. Additionally, academic preparedness seems to explain more of the difference in graduation rates than the other aforementioned student characteristics.
Improving graduation rates and eliminating gaps
The UC Office of the President and campuses have employed predictive analytics to obtain a better understanding of factors that influence graduation rates. Findings indicate that pre-college factors such as academic preparedness measured by high school GPA, the rigor of students’ high school or transfer courses, and demographics are related to, but only explain a small portion of, variance in time to degree and graduation rates. Campus climate, access to courses, student sense of belonging, student engagement in academic and civic activities, basic needs, and success in the first year at college, among many other factors, are important to college completion and timely graduation.
To address challenges facing students and campuses, and reach UC’s goal of improving graduation rates, UC campuses have identified, and where possible are expanding, a wide range of programs to promote the academic success of undergraduates and eliminate gaps in graduation rates, particularly for new generation students (which includes URG, Pell Grant recipients, and first-generation students). These include expanding orientation, advising, and counseling services; increasing on-campus multicultural activities and work opportunities; redesigning and removing achievement gaps in entry courses with large enrollments; streamlining course prerequisites, course sequences, and degree requirements; summer research and summer bridge programs; increasing access to summer session courses; developing pedagogical strategies for the diversification of classrooms and instruction; and conducting learning analytics to assist students who might need additional support. Increased State support would help campuses scale up these programs, particularly those that seek to eliminate equity gaps.
Students who take longer to graduate leave with more debt, have lower lifetime earnings, and are less likely to go on to graduate school. Recognizing the importance of early student success for on-time graduation, UC campuses are specifically making efforts to improve first-year student success. Many campuses offer summer bridge, transfer edge, extended orientation, and/or first-year seminars to assist students with the transition to UC. Campuses are also making advising mandatory for first-year students. Many UC campuses offer first-year students the opportunity to work on a research project with a faculty member. UC recently launched the systemwide First-Generation Faculty Initiative, which connects first-generation students to both faculty and staff mentors.
Undergraduate outcomes
The number of undergraduate degrees awarded by UC grew from about 32,900 degrees in 2000–01 to about 49,400 degrees in 2014–15, and 62,700 degrees in 2020–21 (3.3.1). Increases in the size of the entering freshman class and improving graduation rates contributed to this growth. As mentioned earlier, UC has proposed to improve degree attainment and produce 200,000 more degrees in addition to the projected baseline of one million degrees over the next 15 years, between 2015–16 and 2029–30. About 80 percent of these additional degrees (160,000) would be at the undergraduate level. UC is making progress to achieve that goal.
UC undergraduate alumni enroll at graduate schools or work in various industries. Four years after graduation, more than one-quarter of bachelor’s degree recipients have enrolled in graduate or professional programs. More than half are working in key industries such as health care, K–12 education, finance & insurance, public administration, social assistance, higher education, engineering, and internet and computer systems. Many alumni work in industries that closely align with the majors they chose. By ten years after graduation, 56 percent of engineering & computer science majors work in engineering, manufacturing, or internet and computer systems; 30 percent of life science majors work in health care; and 34 percent of arts & humanities majors are working in K–12, higher education, or performing arts and entertainment.
UC alumni working in California surpass the typical earnings of other California bachelor’s degree recipients (aged 25 and over) by six years after graduation. Additionally, on average, UC graduates break even on their educational investment between four to six years after graduation. The earnings trajectory of UC alumni increases rapidly; ten years after graduation they double what they were earning two years after graduation, on average (3.3.2). Economic success is prevalent for all socioeconomic groups, including students whose families qualified for federal Pell Grants. Within five years of graduation, the majority of Pell Grant recipients earn an average income higher than their parents’ combined incomes during the time those students attended UC (approximately $50,000).
Looking forward
UC campuses have identified promising strategies that, if increased in scale, could help achieve ambitious UC 2030 goals. The University has not yet received State funding to expand these programs and strategies. The current data available indicate some effects from the shift to remote instruction on student retention. However, the long-term impact of the COVID-19 pandemic on student success and retention is unclear. UC will continue to track these measures, including for UC’s future freshman and transfer entrants coming from California high schools and community colleges, who may have widely varying experiences during the period of remote instruction and returning to the classroom fulltime.
For more information
UC 2030 systemwide and campus (dashboard)
Graduation rates and goals by campus, gender, Pell, residency status, race/ethnicity, and other factors (dashboard)
Eliminating gaps in timely graduation (pdf)
UC’s report on Advising Strategies to Support Timely Graduation (pdf)
UC’s undergraduate alumni outcomes, including employment industries and earnings (dashboard)
Beyond economic impact: Understanding societal impacts and public value of a UC degree (pdf)
Fiat Lux: What is the value of a UC degree? (pdf)
Total degrees awarded by degree type, campus, gender, and race/ethnicity (dashboard)
UC’s role in enabling low-income students to achieve intergenerational economic mobility (dashboard)
First-generation college students (dashboard)
UC First-Generation Faculty Initiative (website)
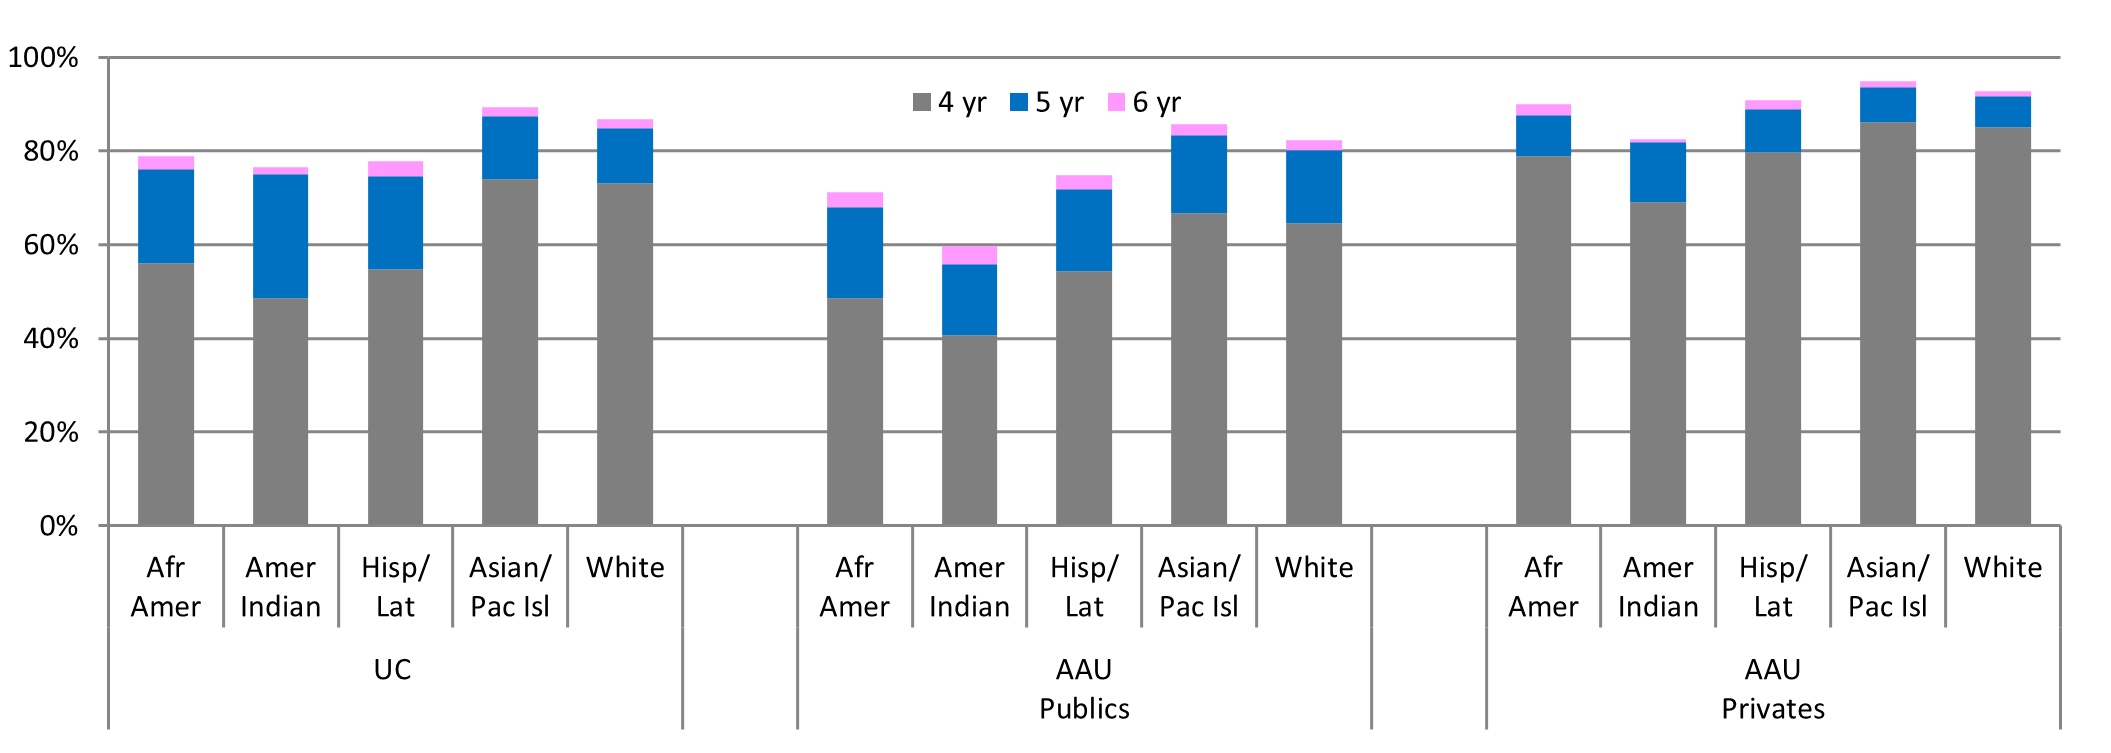
Over 85 percent of UC freshmen graduate within six years, a higher rate than comparable AAU public universities.
3.1.1 Freshman graduation rates, UC and comparison institutions, Cohorts entering fall 2015, 2016, and 2017; fall 2014 cohort for AAU comparison
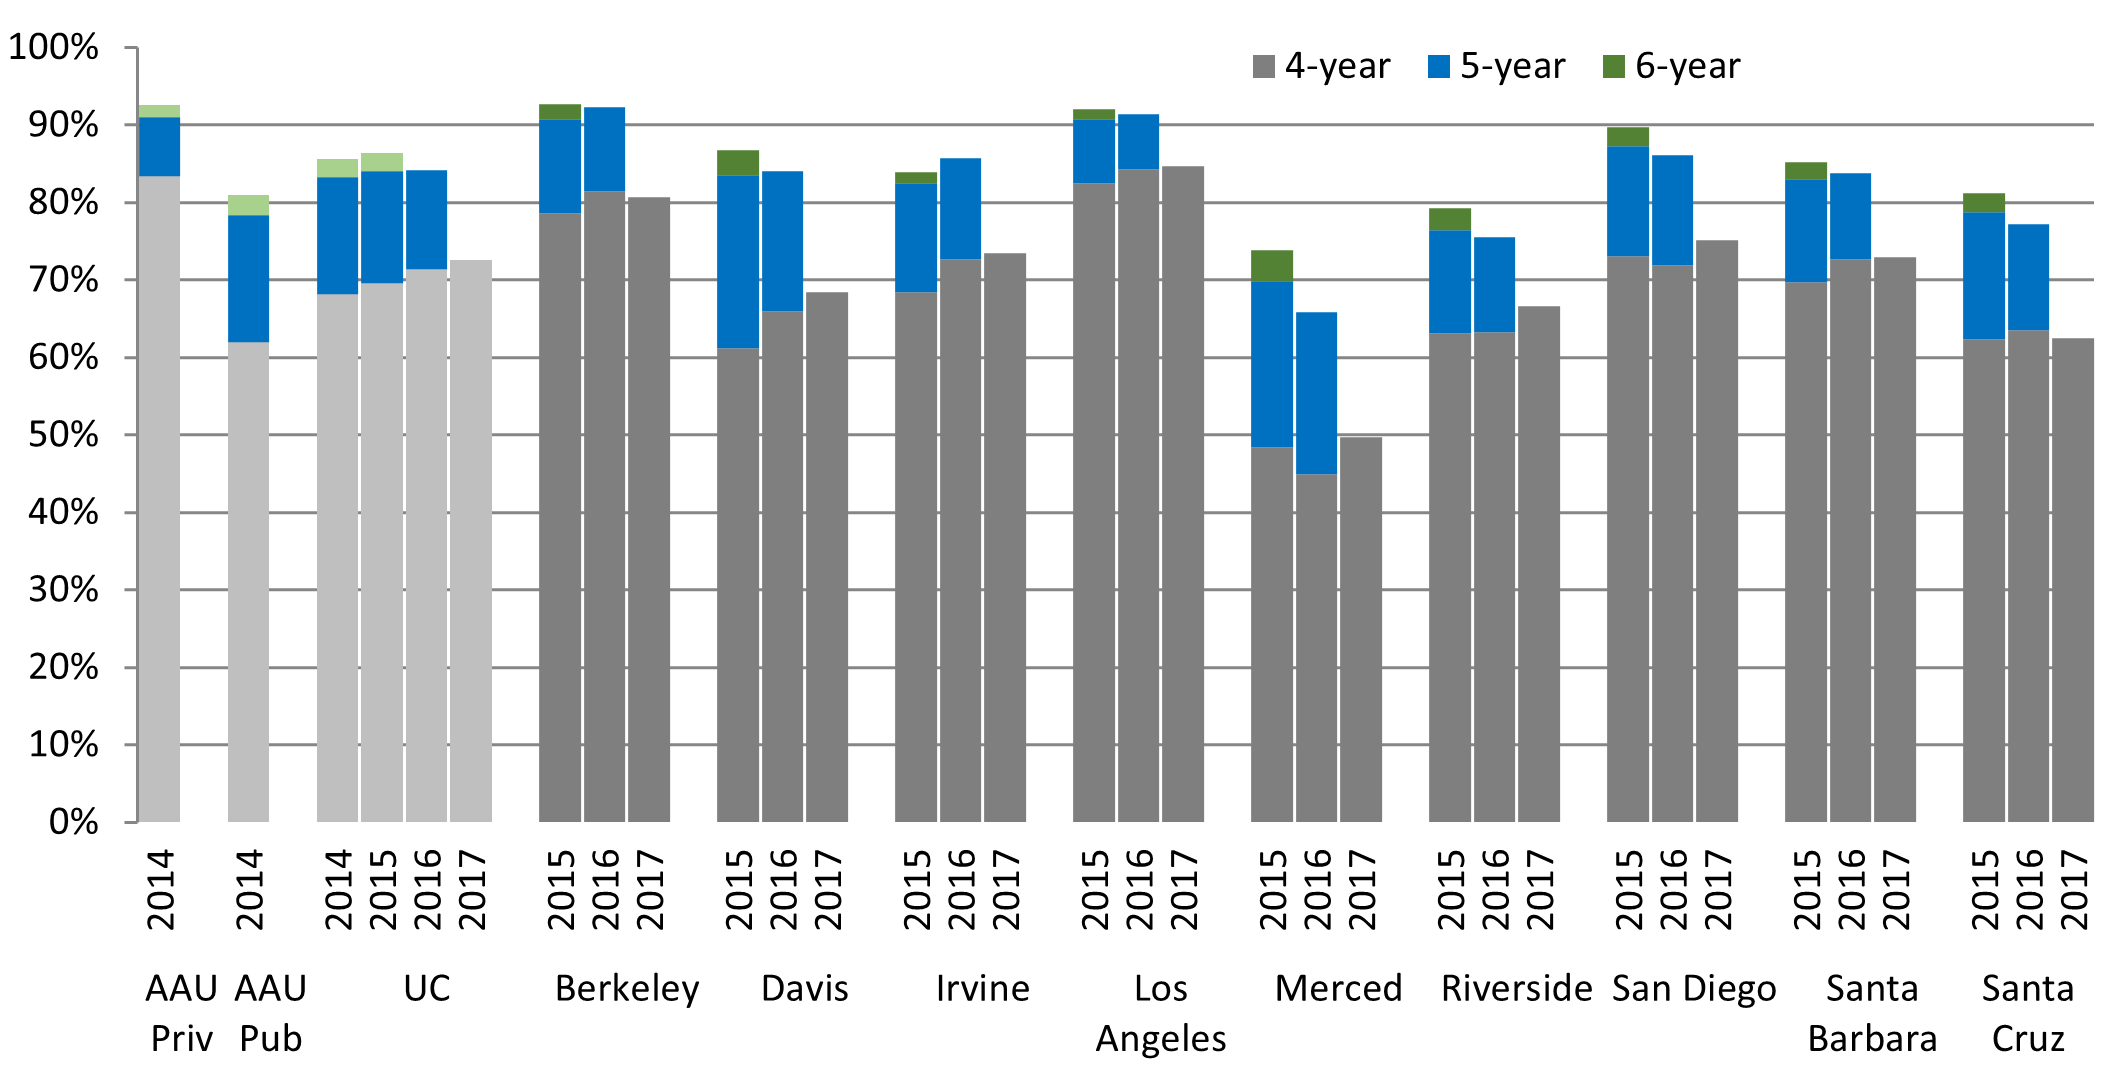
Source: UC Data Warehouse and IPEDS1
UC’s six-year graduation rate is higher than that of comparable AAU public institutions. UC’s four-year graduation rates for freshmen have risen significantly since 1997, from 46 percent for the 1997 entering cohort to 73 percent for the 2017 cohort. Since 2010, UC has improved four-year graduation rates by about ten percentage points; UC Riverside, UC San Diego, and UC Davis have improved four-year graduation rates by about 19, 16, and 13 percentage points, respectively. These improvements are due to factors including campus programs supporting four-year completion, improvements in academic preparation of incoming students, and the current cost of a UC education, all of which motivate students to complete their degrees in a timely fashion.
UC’s latest freshman six-year graduation rate is 86 percent, which is a five-percentage point increase over the past twenty years.
By 2030, UC is striving to raise four-year completion to 76 percent and six-year completion to 90 percent. UC is seeking financial support from the State to achieve these goals.
More information on trends in UC freshman graduation rates can be found at: universityofcalifornia.edu/infocenter/ug-outcomes and progress in achieving UC 2030 goals can be found at: universityofcalifornia.edu/infocenter/uc-2030-dashboard.
The six-year graduation rate of UC freshmen is close to 90 percent when students who finished their degrees at a non-UC institution are included.
3.1.2 Freshman graduation rates, including those who graduated from a non-UC institution, Universitywide and UC campuses, Cohort entering fall 2015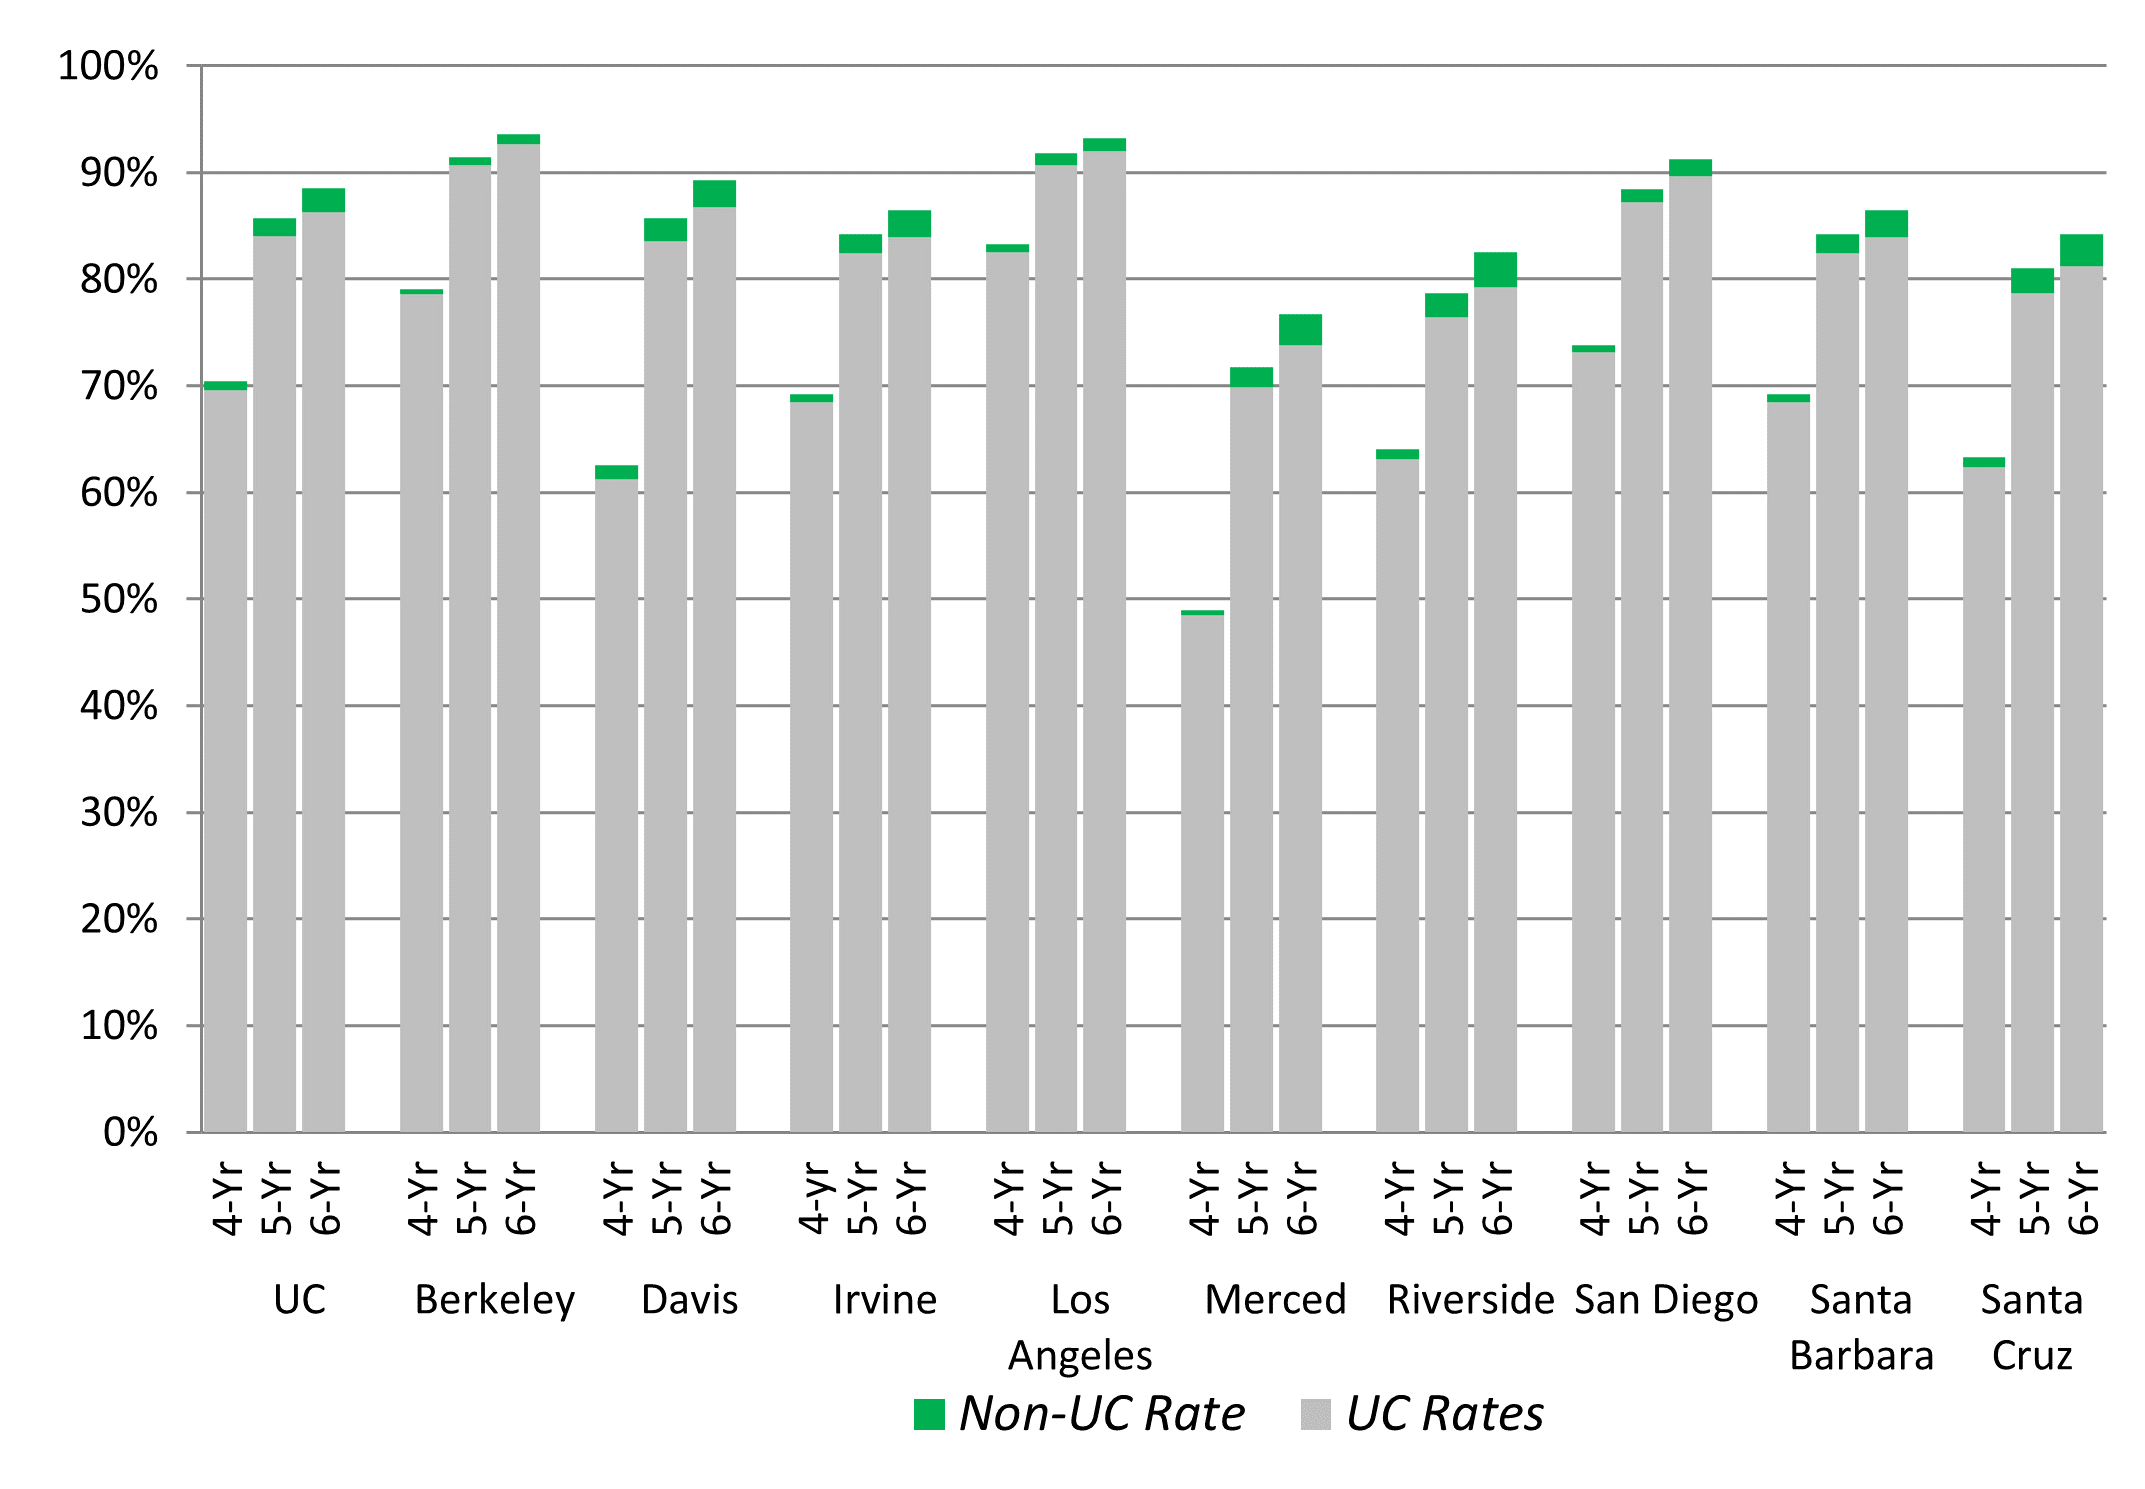
Source: UC Data Warehouse and the National Student Clearinghouse1
The extended graduation rate of students who begin their studies as freshmen at UC includes those who transfer to a non-UC institution and complete their bachelor’s degree within four, five, or six years.
By this measure, UC’s overall six-year graduation rate is about 89 percent. The effect of the extended
graduation rate varies by UC campus, with Berkeley having fewer students who earn a degree outside of the UC system, while the six-year rates at Merced, Riverside, and Santa Cruz improve by as much as three percentage points when students who complete their degree at a non-UC school are included.
More than 60 percent of transfer students graduate within two years and close to 90 percent in four years.
3.1.3 Transfer graduation rates, Universitywide and UC campuses, Cohorts entering fall 2017, 2018, and 2019
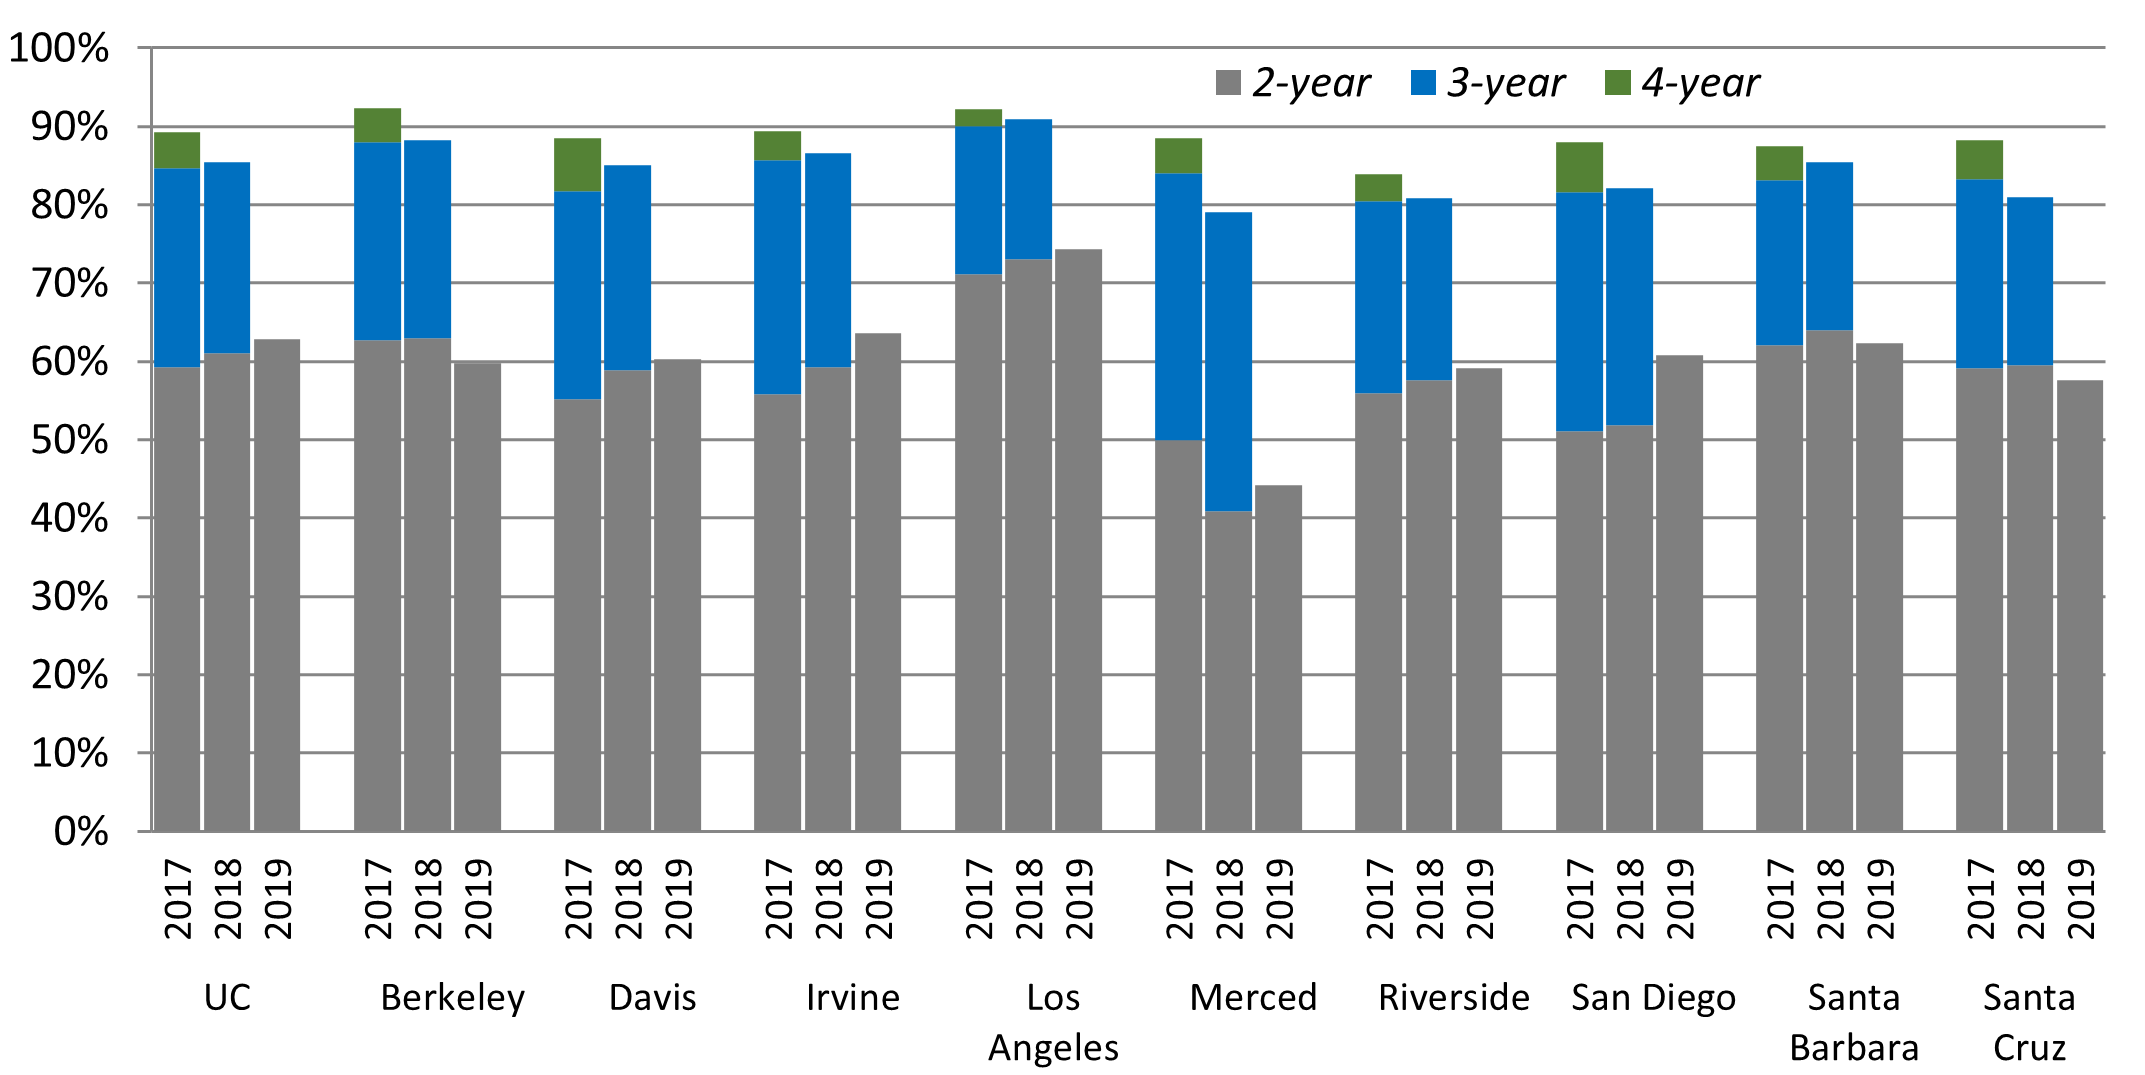
Source: UC Data Warehouse1
The two-year graduation rate for transfers is currently at 63 percent, the highest since 1995. The four-year rate is 89 percent. The two-year graduation rate varies across campuses and for the most recent year, UC Berkeley, UC Santa Barbara, and UC Santa Cruz have seen slight decreases of two to three percentage points from the previous year’s rate. Campuses attribute the decreased graduation rates to challenges related to the COVID-19 pandemic. More information on trends in UC transfer graduation rates can be found at: universityofcalifornia.edu/infocenter/ug-outcomes.
UC is striving to improve two-year graduation rates to 70 percent by 2030. UC is seeking financial support from the State to expand programs and services to achieve these ambitious goals. Progress in achieving UC 2030 goals can be found at: universityofcalifornia.edu/infocenter/uc-2030-dashboard.
Underrepresented group (URG) students at UC graduate at higher rates when compared to URG students at other AAU public institutions, but gaps exist with other UC peers.
3.1.4 Freshman graduation rates by race/ethnicity, Universitywide, AAU public, and AAU private, Cohorts entering fall 2015, 2016, and 2017
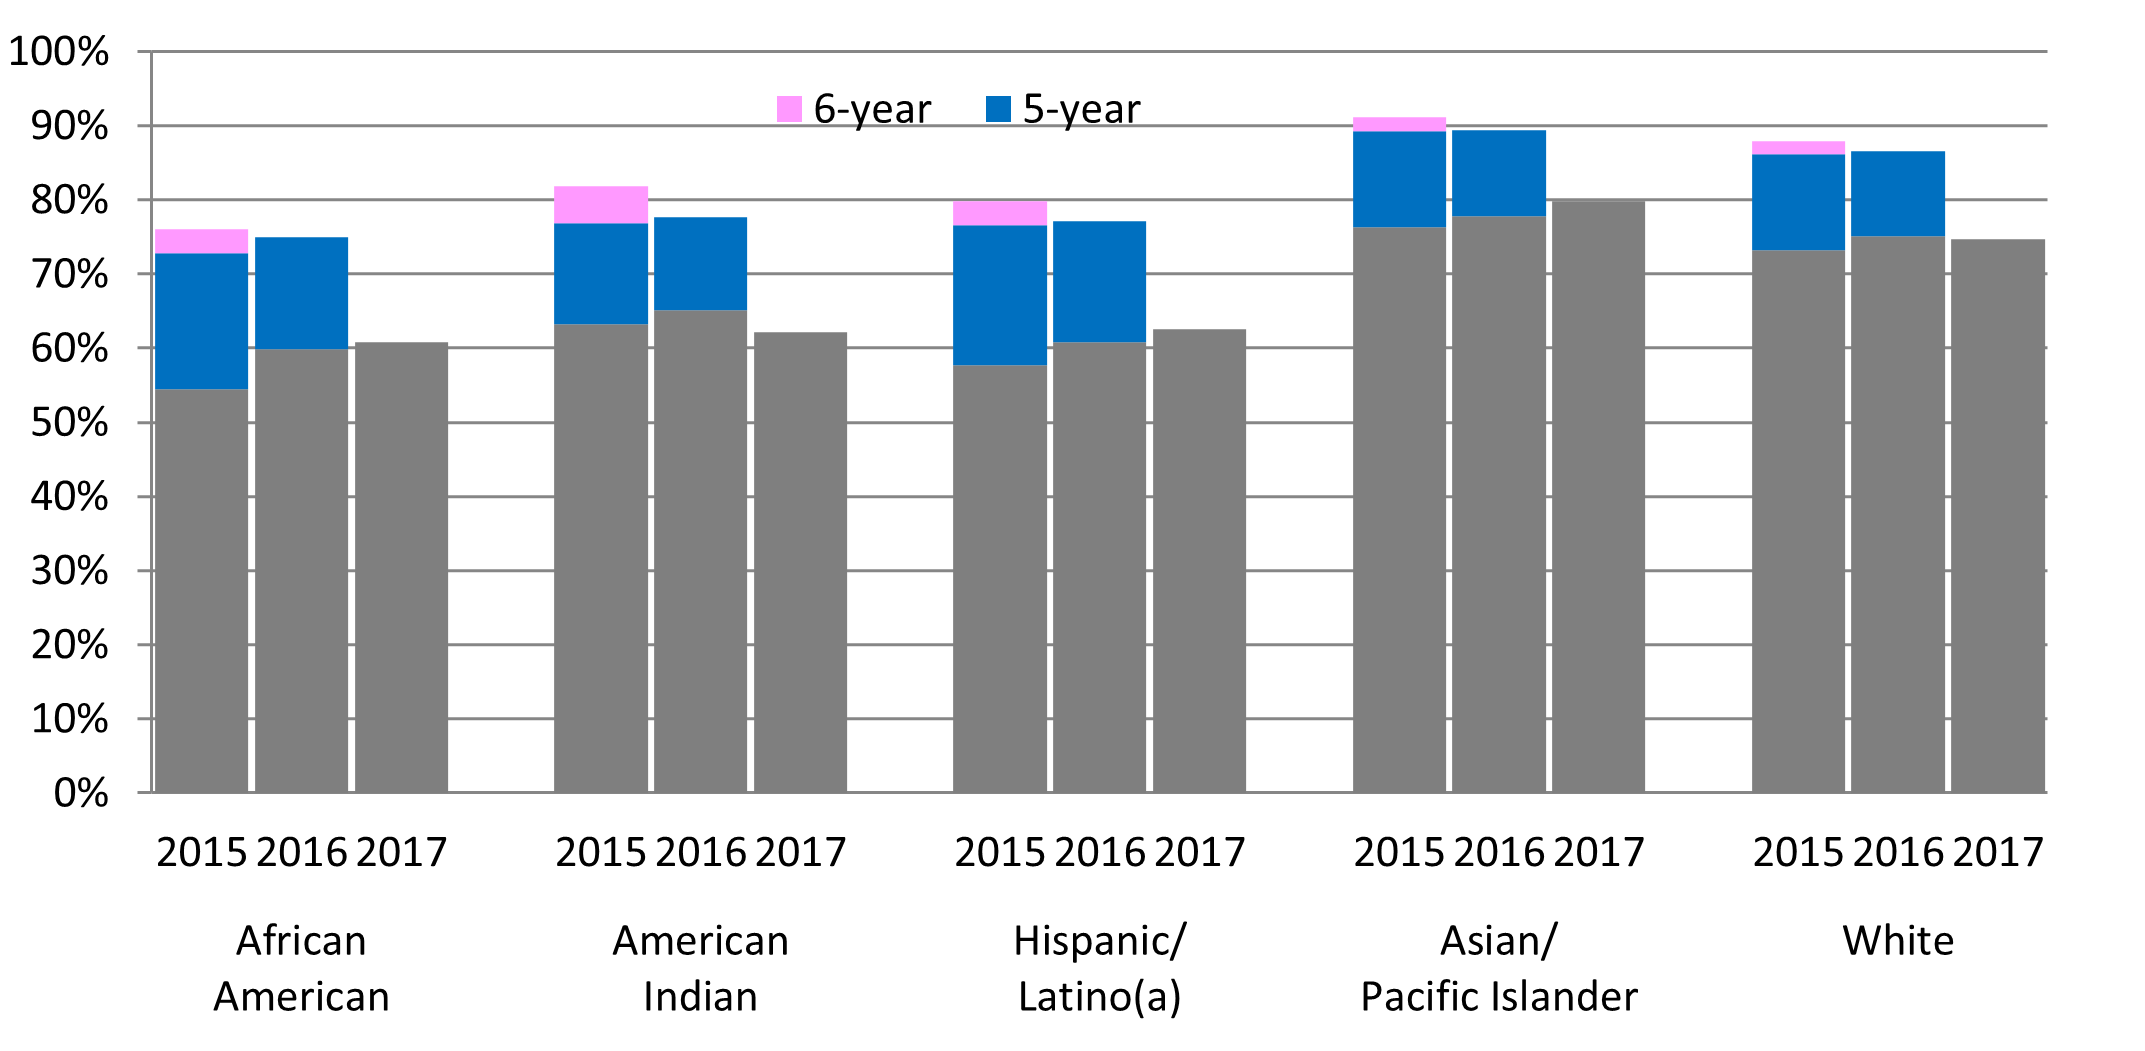
Source: UC Data Warehouse and IPEDS
By 2030, UC is looking to eliminate graduation gaps for underrepresented groups. All racial/ethnical groups except American Indian students have improved their four-year graduation rates from that of the previous cohort. Compared to the overall four-year rate of 70 percent, however, African
American students have a 61 percent rate, American Indian a 62 percent rate, and Hispanic/Latino(a) a 63 percent rate.
More information on trends in UC freshman graduation rates by campuses and demographic detail can be found at: universityofcalifornia.edu/infocenter/ug-outcomes.
UC and comparison institutions, cohort entering fall 2014
Source: UC Data Warehouse and IPEDS
Regardless of race/ethnicity, transfer students graduate at a high rate, and the rate for two-year graduates of all racial/ethnic groups is rising.
3.1.5 Transfer graduation rates by race/ethnicity, Universitywide, Cohorts entering fall 2017, 2018, and 2019
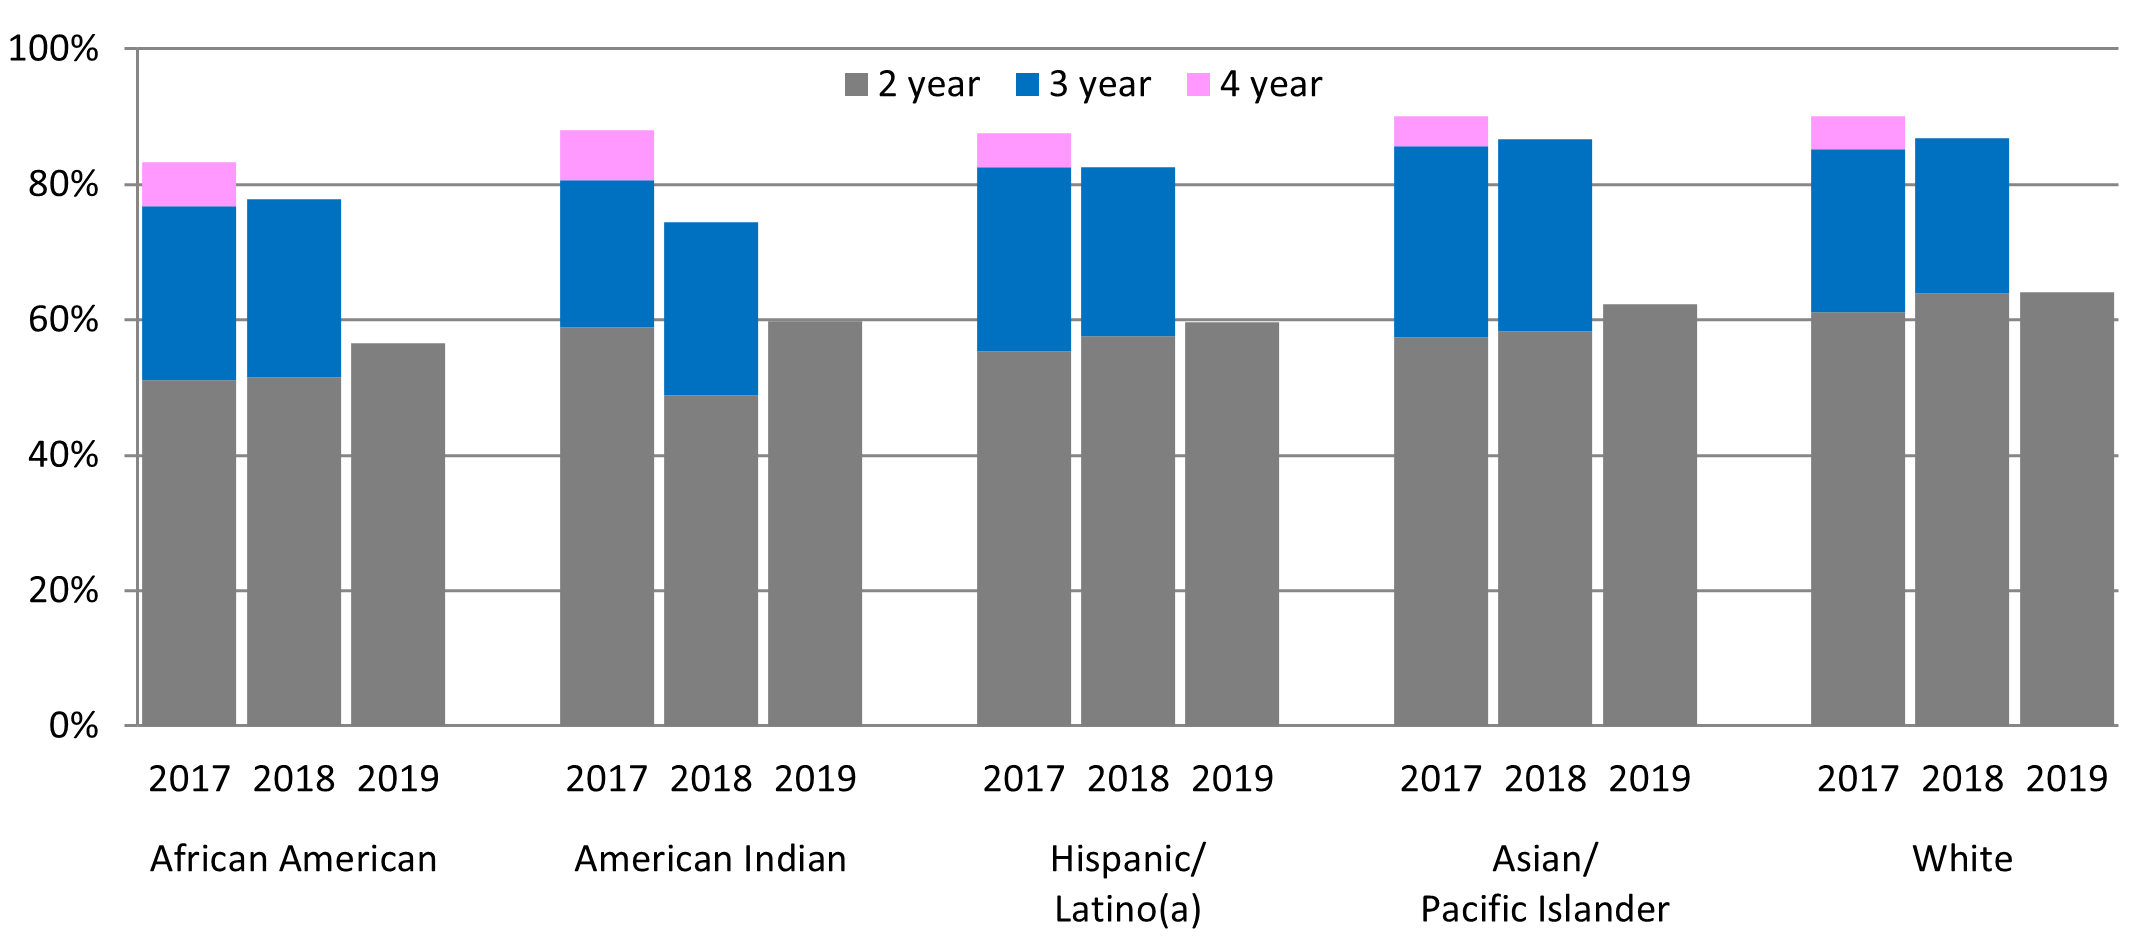
Source: UC Data Warehouse
The rate for two-year graduates of all racial/ethnic groups is rising. While graduation gaps are smaller for transfer students than for students who enter as freshmen, gaps still remain. By 2030, UC is looking to eliminate graduation gaps for underrepresented groups and raise the overall on-time graduation rate.
More information on trends in UC transfer graduation rates by campus and demographic detail can be found at: universityofcalifornia.edu/infocenter/ug-outcomes.
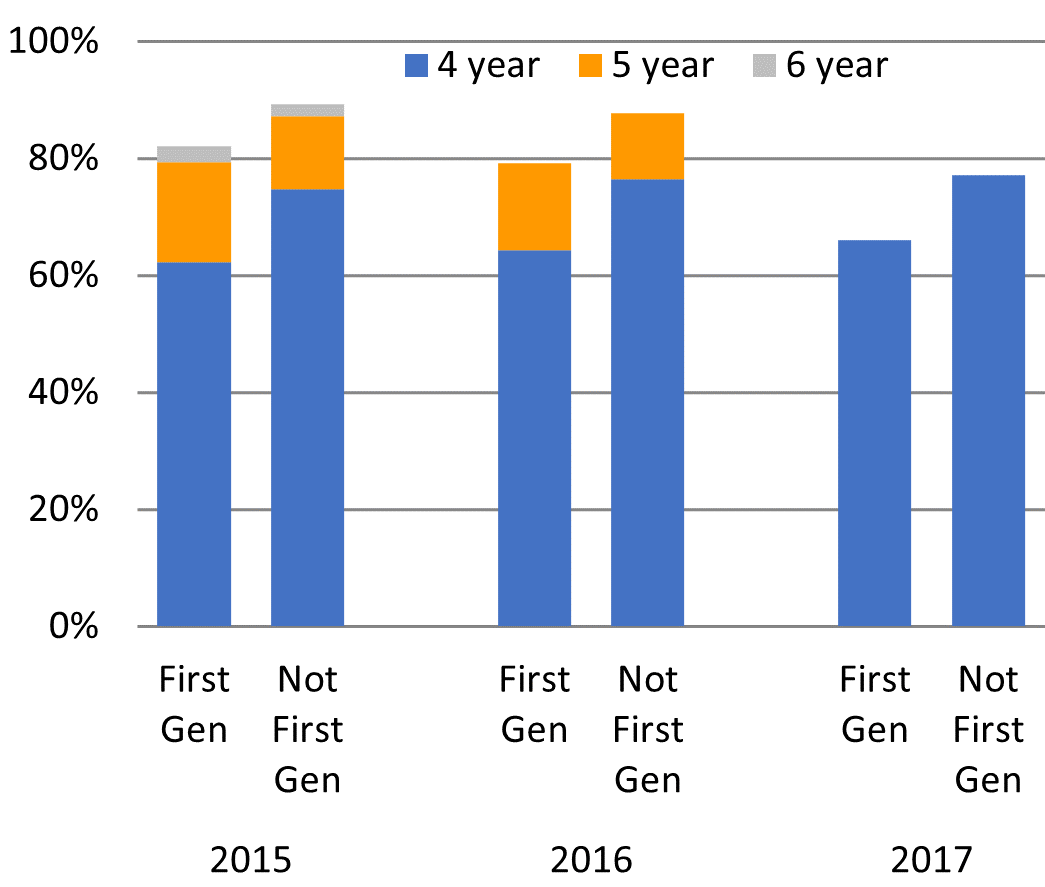
Over 84 percent of freshman Pell Grant students graduate within six years.
3.1.6 Freshman graduation rates by Pell Grant recipient status, Universitywide, Cohorts entering fall 2015, 2016, and 2017
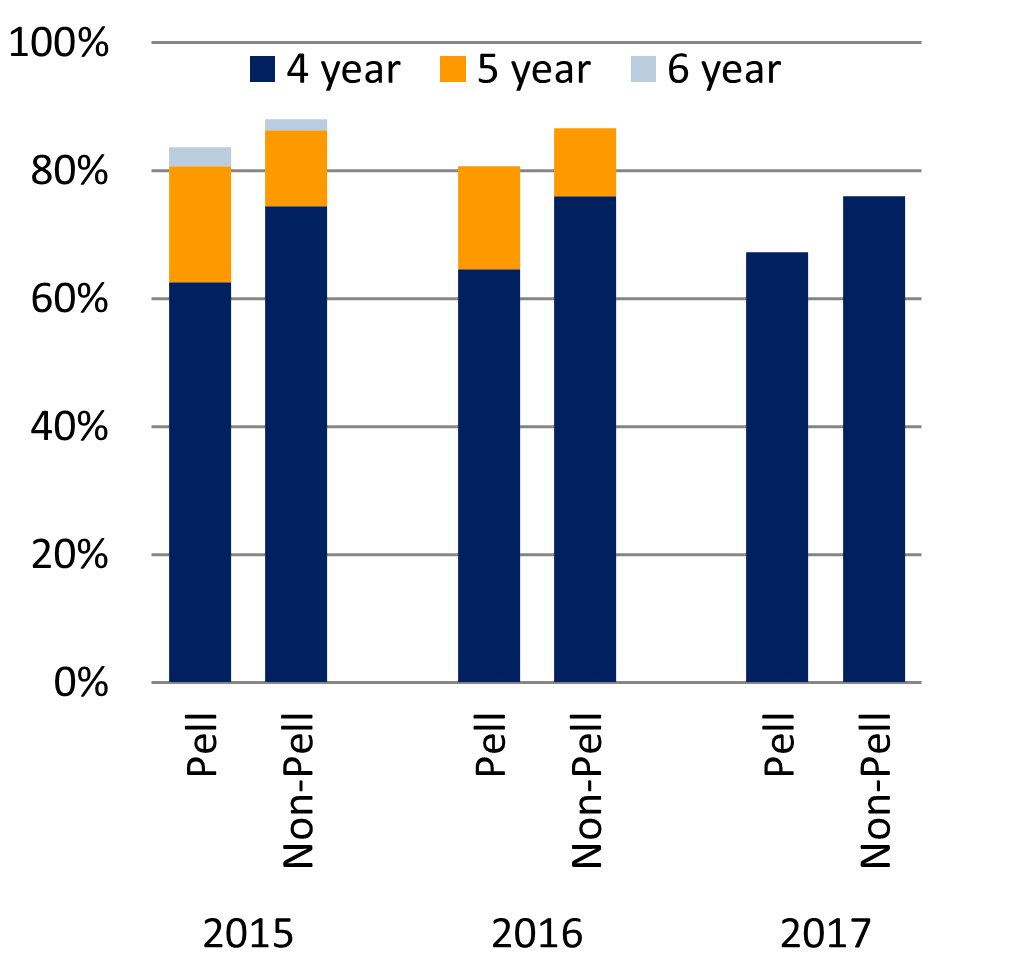
Source: UC Data Warehouse. Pell Grant recipients are those who received a Pell Grant at any time during their time at UC.
Freshman Pell Grant recipients graduate at rates comparable to non-Pell recipients: 84 percent and 88 percent, respectively. Although there is a nine-percentage point gap at the four-year mark between freshman Pell recipients (67 percent) and non-Pell recipients (76 percent), this gap is reduced to four percentage points at the six-year mark.
88 percent of transfer Pell Grant students graduate within four years.
3.1.7 Transfer graduation rates by Pell Grant recipient status,Universitywide,Cohorts entering fall 2017, 2018, and 2019
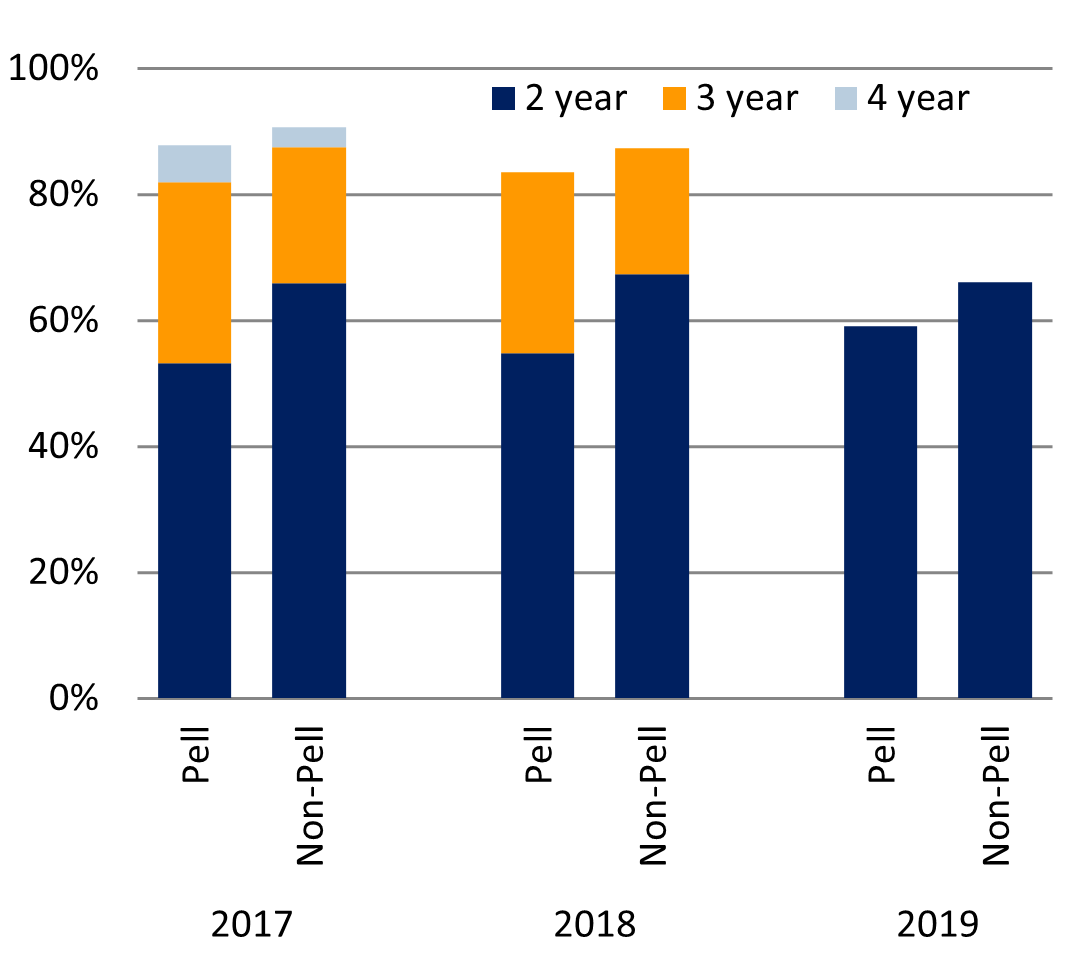
Source: UC Data Warehouse. Pell Grant recipients are those who received a Pell Grant at any point during their time at UC
For the transfer 2017 cohort, Pell and non-Pell Grant recipients graduated at comparable rates of 88 percent and 91 percent, respectively, within four years. However, the two-year graduation rate gap between Pell and non-Pell Grant recipient transfer students is seven percentage points, down by five percentage points from the 2018 cohort.
More information on trends in graduation rates can be found at universityofcalifornia.edu/infocenter/ug-outcomes.
.
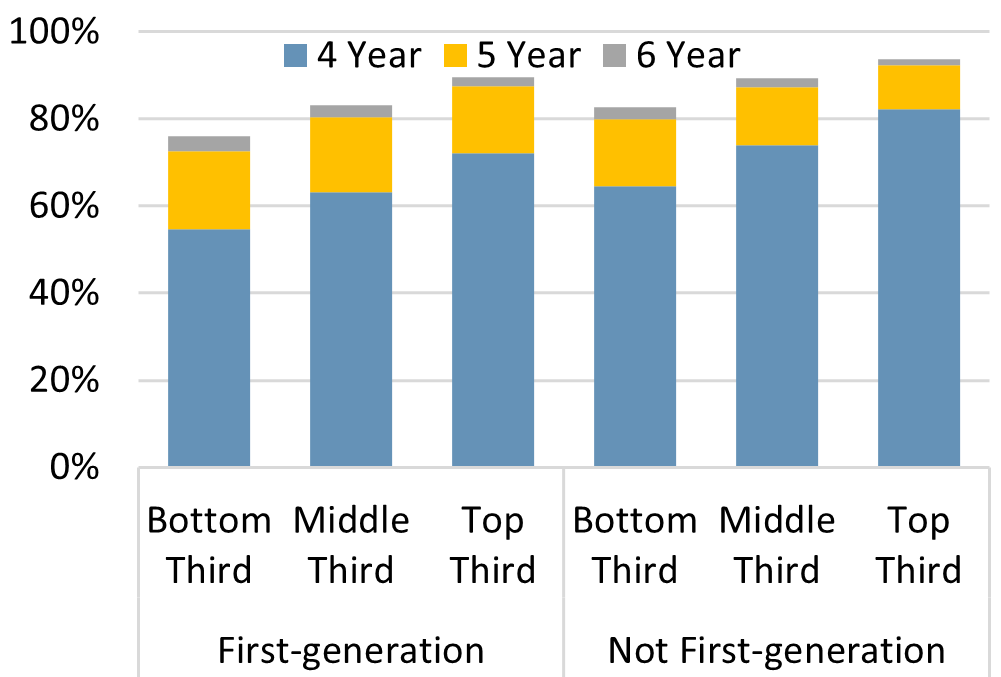
Over 82 percent of freshman first-generation students graduate within six years.
3.1.8 Freshman graduation rates by first-generation status, Universitywide, Cohorts entering fall 2015, 2016, and 2017
Freshman first-generation students have improved their four-year graduation rate from that of the previous cohort. Although there is an 11-percentage point gap at the four-year mark between freshman first-generation students (66 percent) and students who are not first-generation (77 percent), this gap is reduced to eight percentage points at the six-year mark.
88 percent of transfer first-generation students graduate within four years.
3.1.9 Transfer graduation rates by first-generation status, Universitywide, Cohorts entering fall 2017, 2018, and 2019
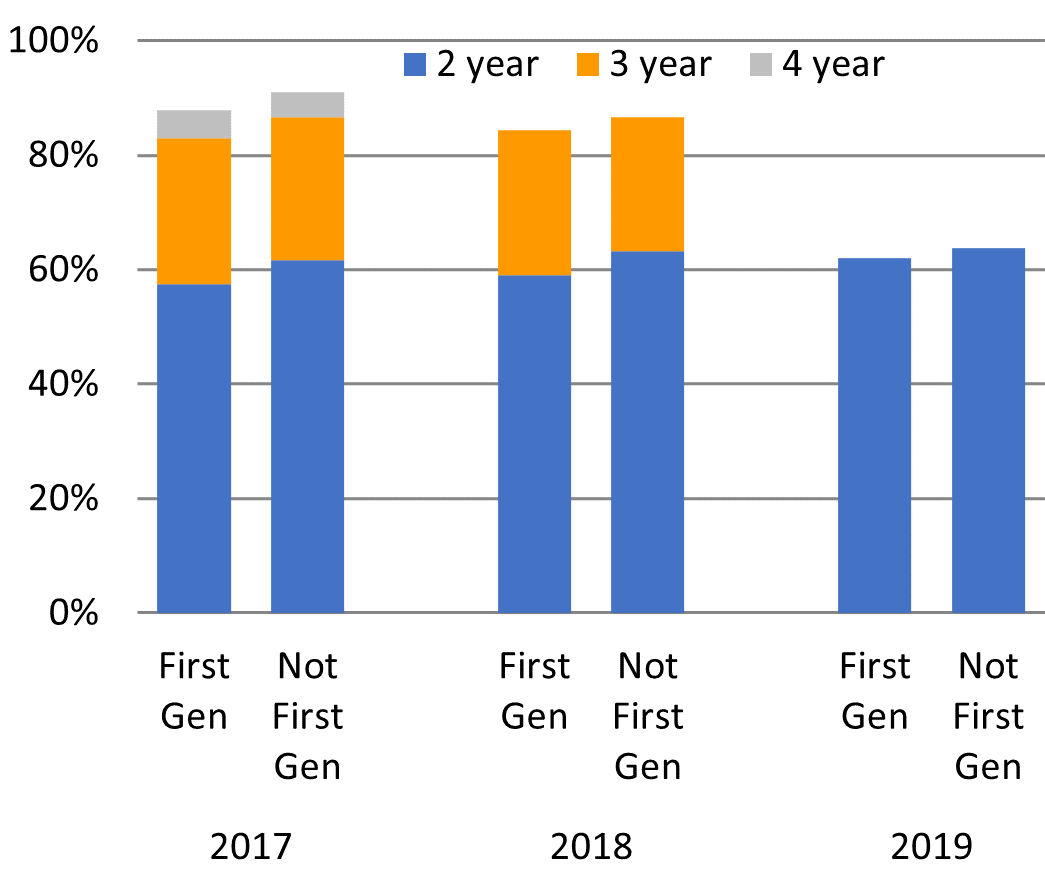
Source: UC Data Warehouse
For the transfer 2017 cohort, first-generation and non-first-generation students graduated at comparable rates of 88 percent and 91 percent, respectively, within four years. The two-year graduation rates of first-generation and non-first-generation transfer students are also comparable at 62 percent and 64 percent, respectively. The two-year graduation rate gap has decreased by two percentage points from the 2018 cohort.
More information on trends in graduation rates can be found at universityofcalifornia.edu/infocenter/ug-outcomes.
3.1 GRADUATION RATES
Academic preparation explains more of the difference in freshman graduation rates than race/ethnicity, Pell recipient status, or first-generation status alone.
3.1.10 Freshman graduation rates by HS GPA (top, middle, and bottom thirds) and race/ethnicity, Pell Grant recipient status, and first-generation status, Universitywide, Cohorts entering fall 2015
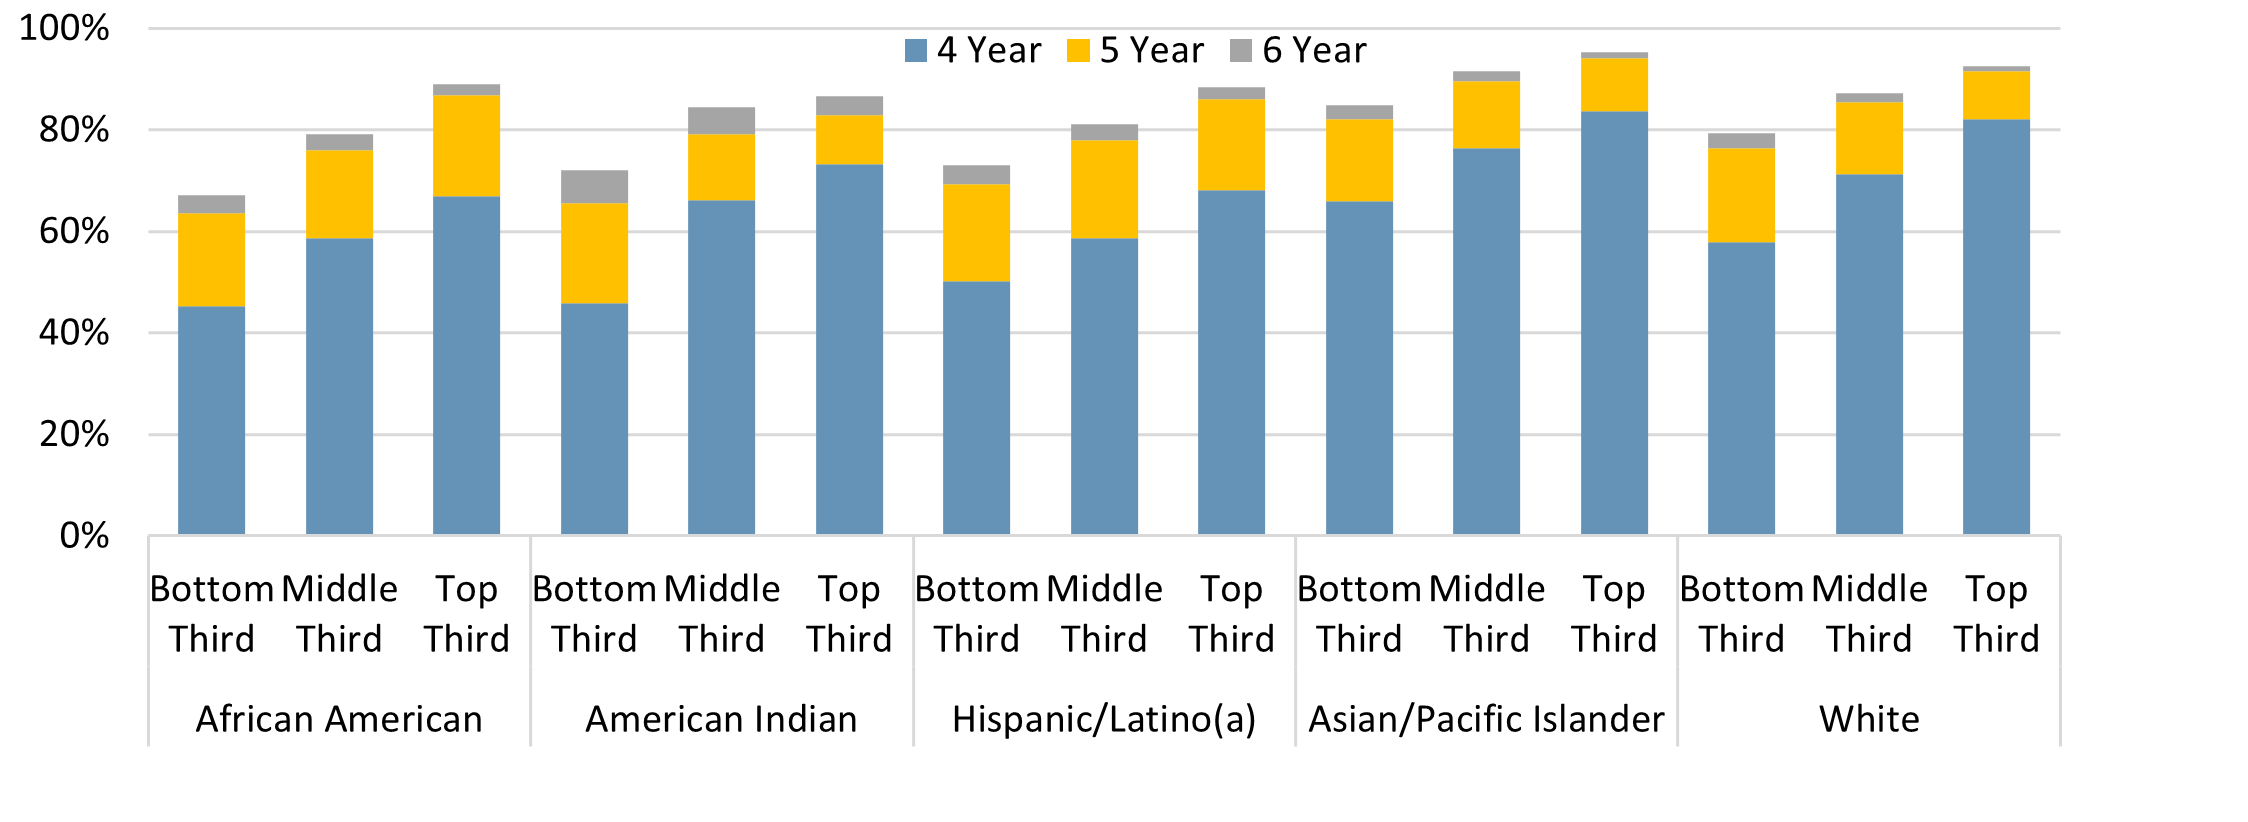
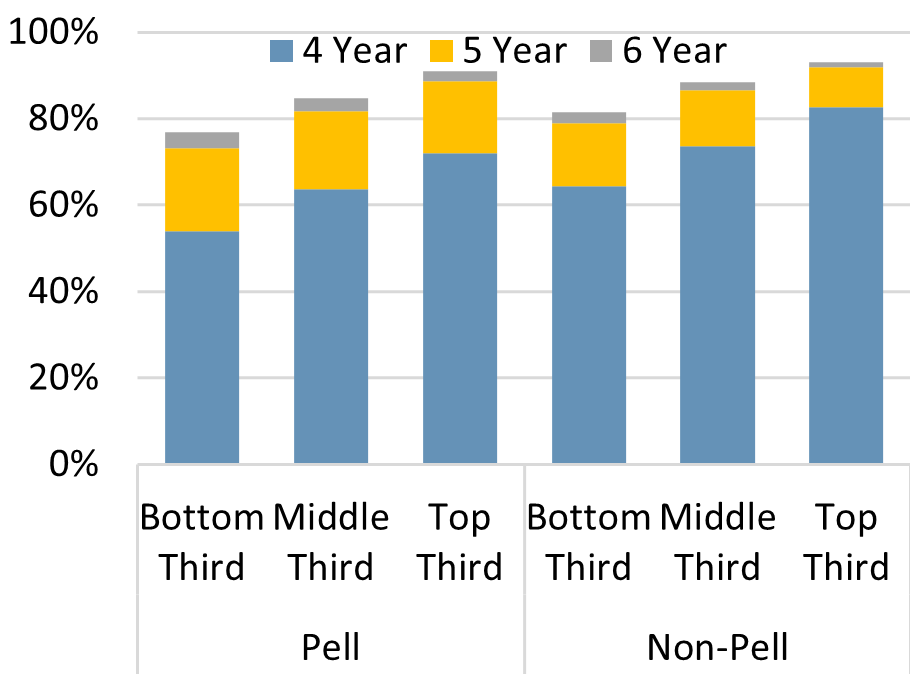
There are differences in graduation rates for freshman students with different characterstics, such as URG students, Pell Grant recipients, and first-generation students compared to students who are not part of those respective groups (as detailed in indicators 3.1.4, 3.1.6, and 3.1.8). However, larger differences in graduation rates are explained by high school unweighted grade point average (GPA), which is used as a proxy measure for academic preparation of entering freshman students.
The within-group gaps for graduation rates between the lowest GPA category (“bottom third”) and highest GPA category (“top third”) are much wider than the gaps between groups when comparing the same GPA categories. For example, there is an 18- percentage point gap in four-year graduation rates for Pell Grant recipients in the bottom GPA tercile (54 percent) compared to Pell Grant recipients in the top GPA tercile (72 percent).
However, the four-year graduation rate gap between Pell Grant recipients and non-Pell recipients in all GPA terciles is about ten percentage points. The gaps are similar when looking at high school GPA within race/ethnicity categories and when looking at first-generation and non-first-generation students.
More information on trends in graduation rates can be found at universityofcalifornia.edu/infocenter/ug-outcomes.
3.1 GRADUATION RATES
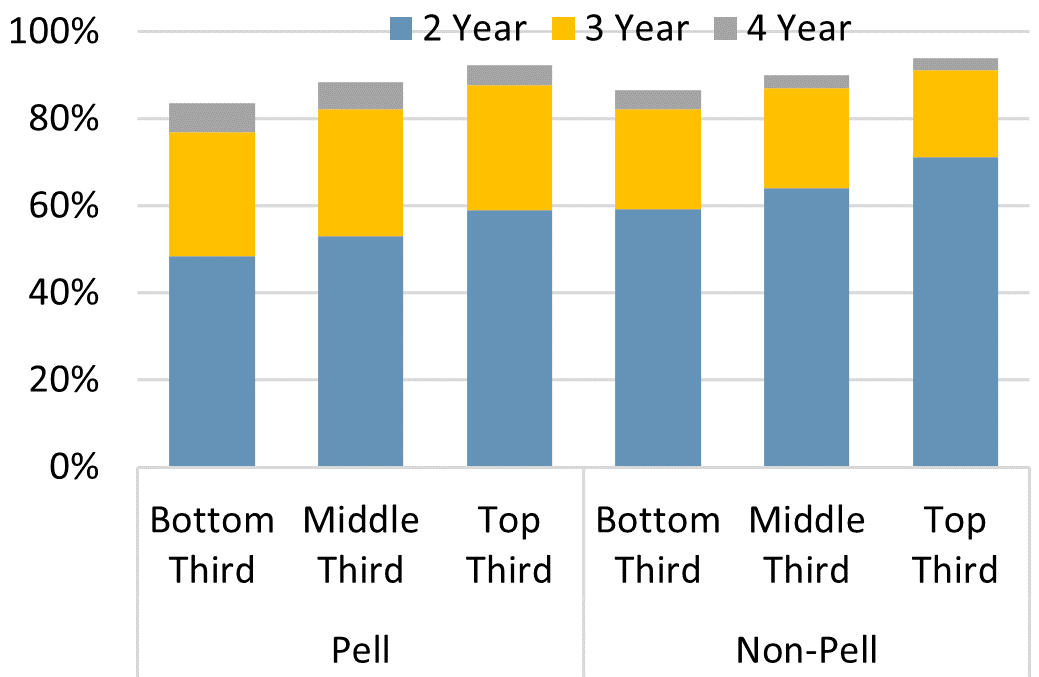
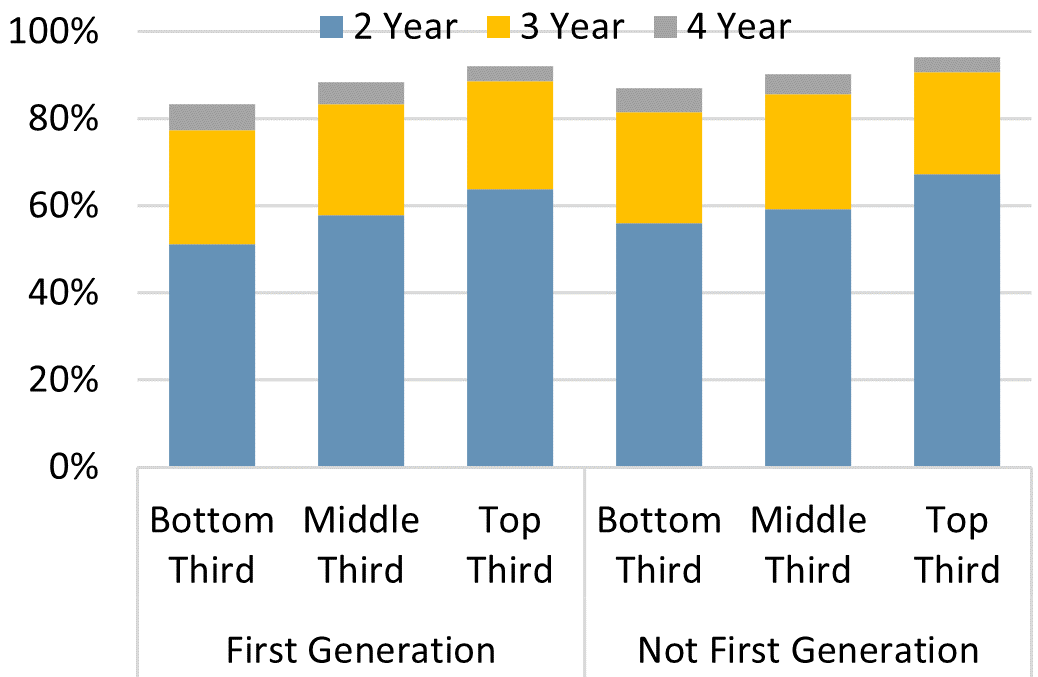
Academic preparation explains more of the difference in transfer graduation rates than race/ethnicity, Pell recipient status, or first-generation status alone.
3.1.11 Transfer graduation rates by incoming transfer GPA (top, middle, and bottom thirds) and race/ethnicity, Pell Grant recipient status, and first-generation status, Universitywide, Cohort entering fall 2017
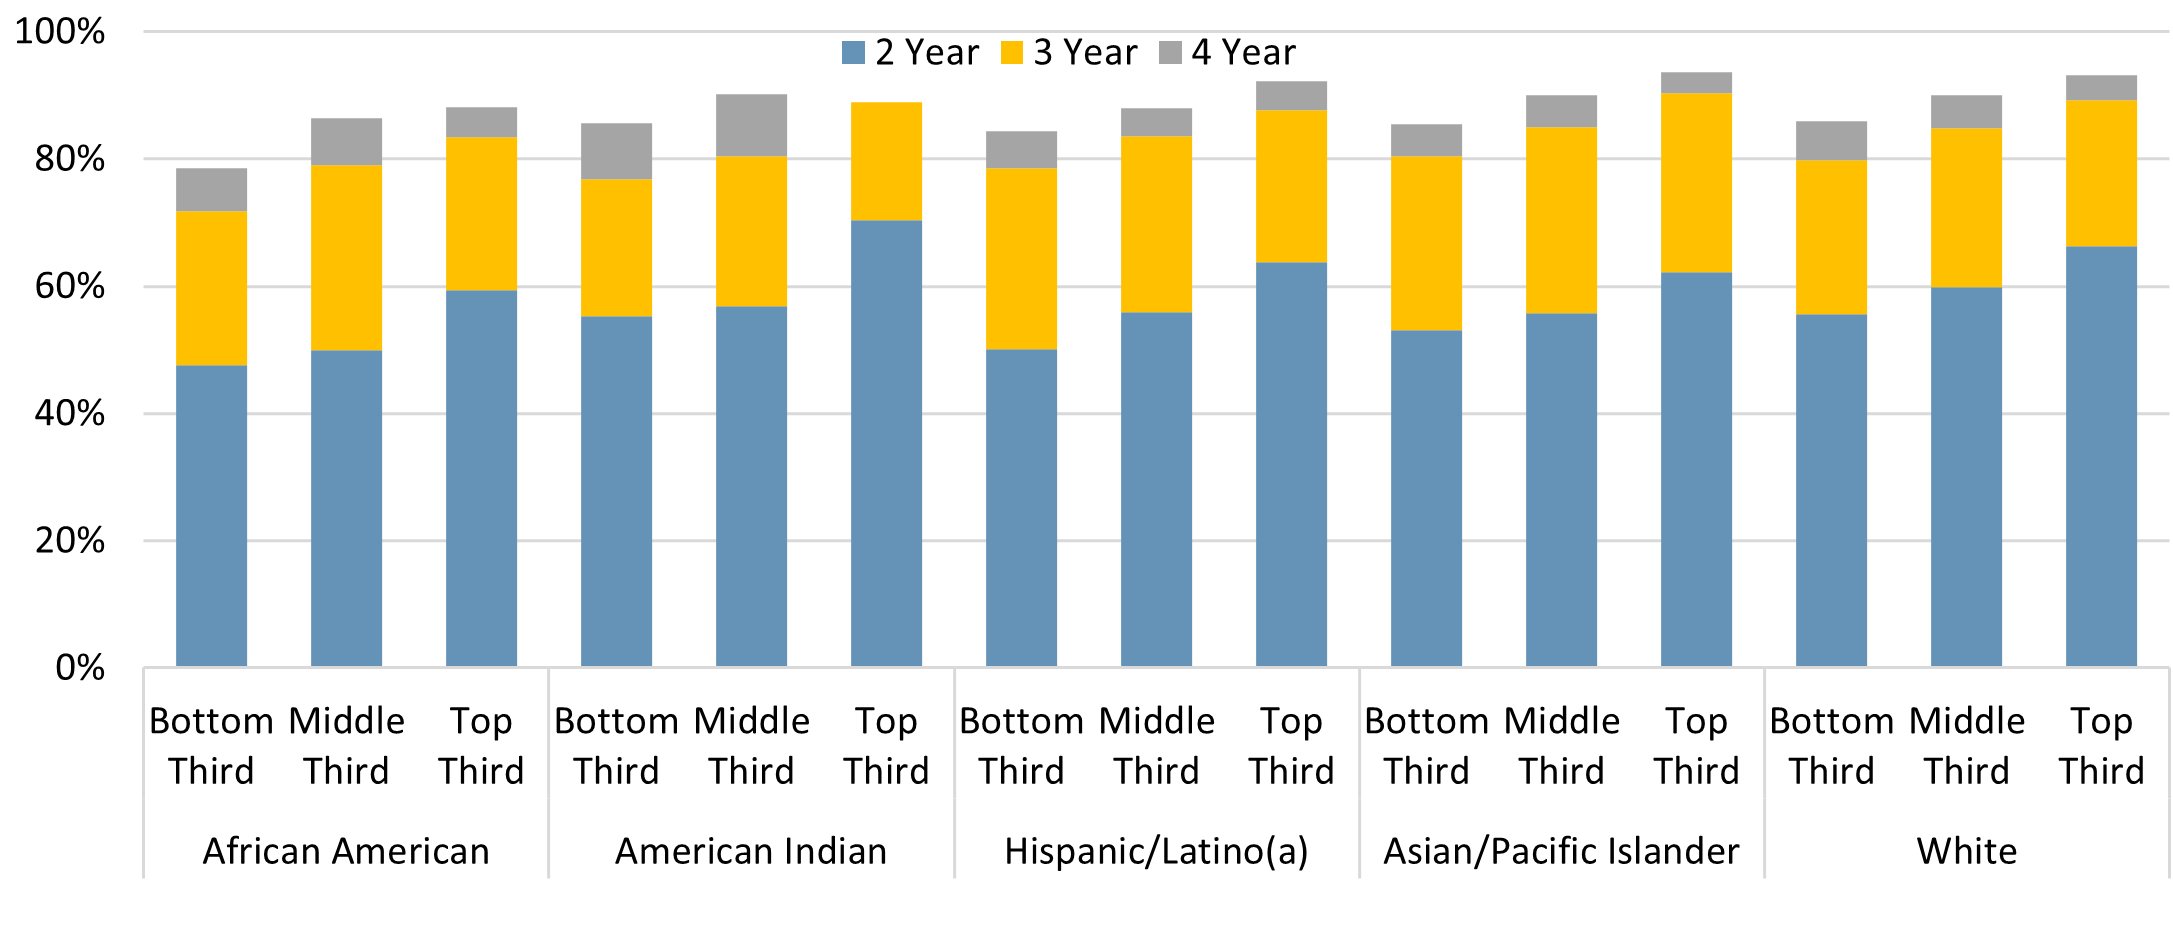
Source: UC Data Warehouse
As with freshman students, there are differences in graduation rates for transfer students with different characterstics, such as URG students, Pell Grant recipients, and first-generation students compared to students who are not part of those respective groups (as detailed in indicators 3.1.5, 3.1.7, and 3.1.9).
However, larger differences in graduation rates are explained by transfer grade point average (GPA). The within-group gaps for graduation rates between the lowest GPA category (“bottom third”) and highest GPA category (“top third”) are wider than the gaps between groups when comparing the same GPA categories.
For example, there is a 13-percentage point gap in two-year graduation rates for first-generation students in the bottom GPA tercile (51 percent) compared to Pell Grant recipients in the top GPA tercile (64 percent).
However, the two-year graduation rate gap between Pell Grant recipients and non-Pell recipients in all GPA terciles ranges from one to five percentage points. With that said, the within-group four-year graduation rate gap shrinks to about nine percentage points between the top and bottom GPA categories and the between-group gaps shrink to one to four percentage points across all GPA categories for first-generation students.
The gaps are similar when looking at transfer GPA within race/ethnicity categories and when looking at Pell Grant recipient and non-Pell Grant recipient students.
Academic preparation is an important factor to consider for those who seek to eliminate equity gaps in graduation rates and may help campuses create preemptive initiatives for students in their first year on campus.
UC has adopted goals to eliminate graduation gaps by 2030 and is seeking funds from the State to support investment in programs and services needed to help achieve these ambitious goals.
More information on trends in graduation rates can be found at universityofcalifornia.edu/infocenter/ug-outcomes.
3.1 GRADUATION RATES
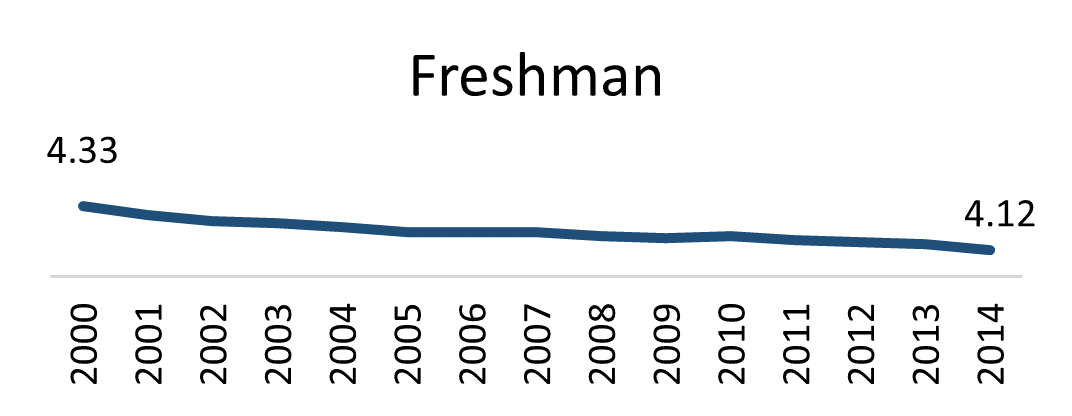
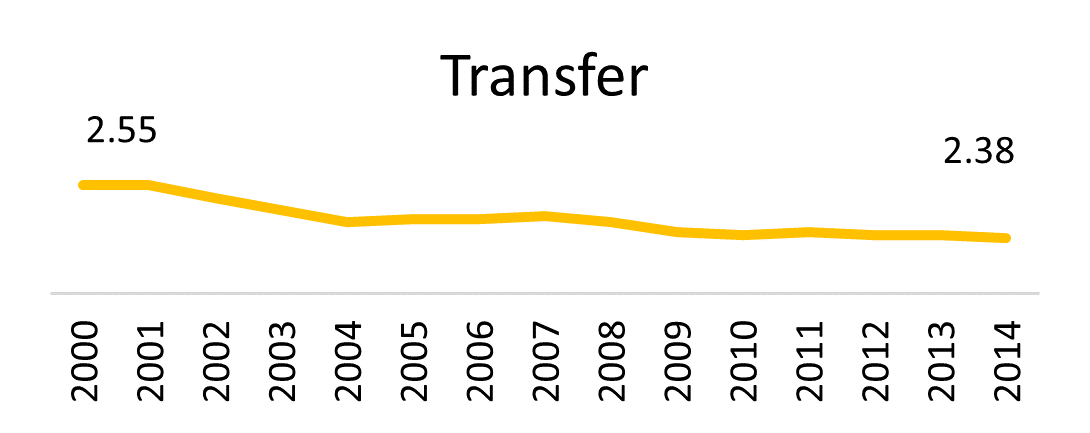
Undergraduate students at UC are graduating more quickly than in previous years.
3.1.12 Average time to degree, Universitywide and UC campuses
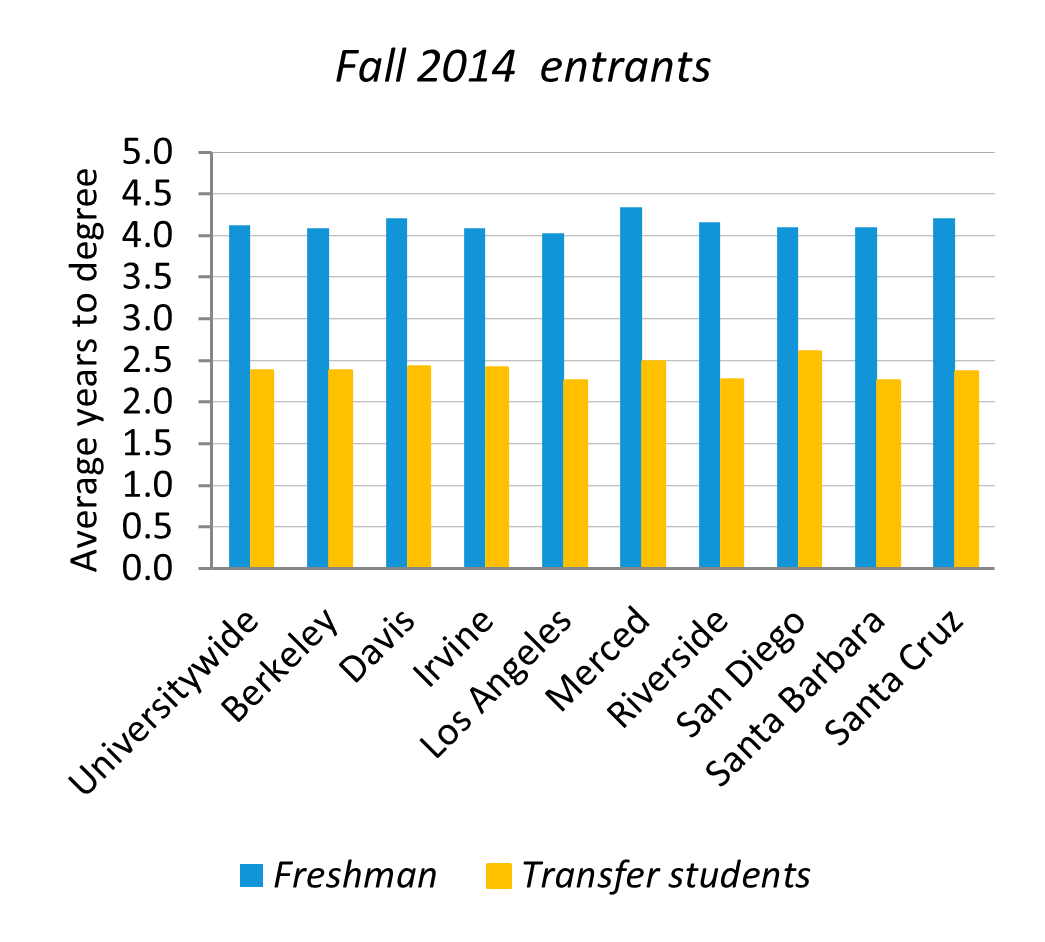
Source: UC Corporate Student System
Average time to graduation only includes students who graduated from UC within seven years.
The average time to earn a bachelor’s degree at UC has decreased fairly steadily since 1994. Students entering as freshmen in 2014 took an average of 4.12 years, down from 4.33 years in 2000.
For students entering as transfers, the average time to degree is 2.38 years, down from 2.55 years in 2000. More information on trends in UC time to degree can be found at universityofcalifornia.edu/infocenter/ug-outcomes.
Retention rates are high, but UC is monitoring recent declines.
3.2.1 First-year retention rates, UC systemwide, Cohorts entering fall 2010 to fall 2020
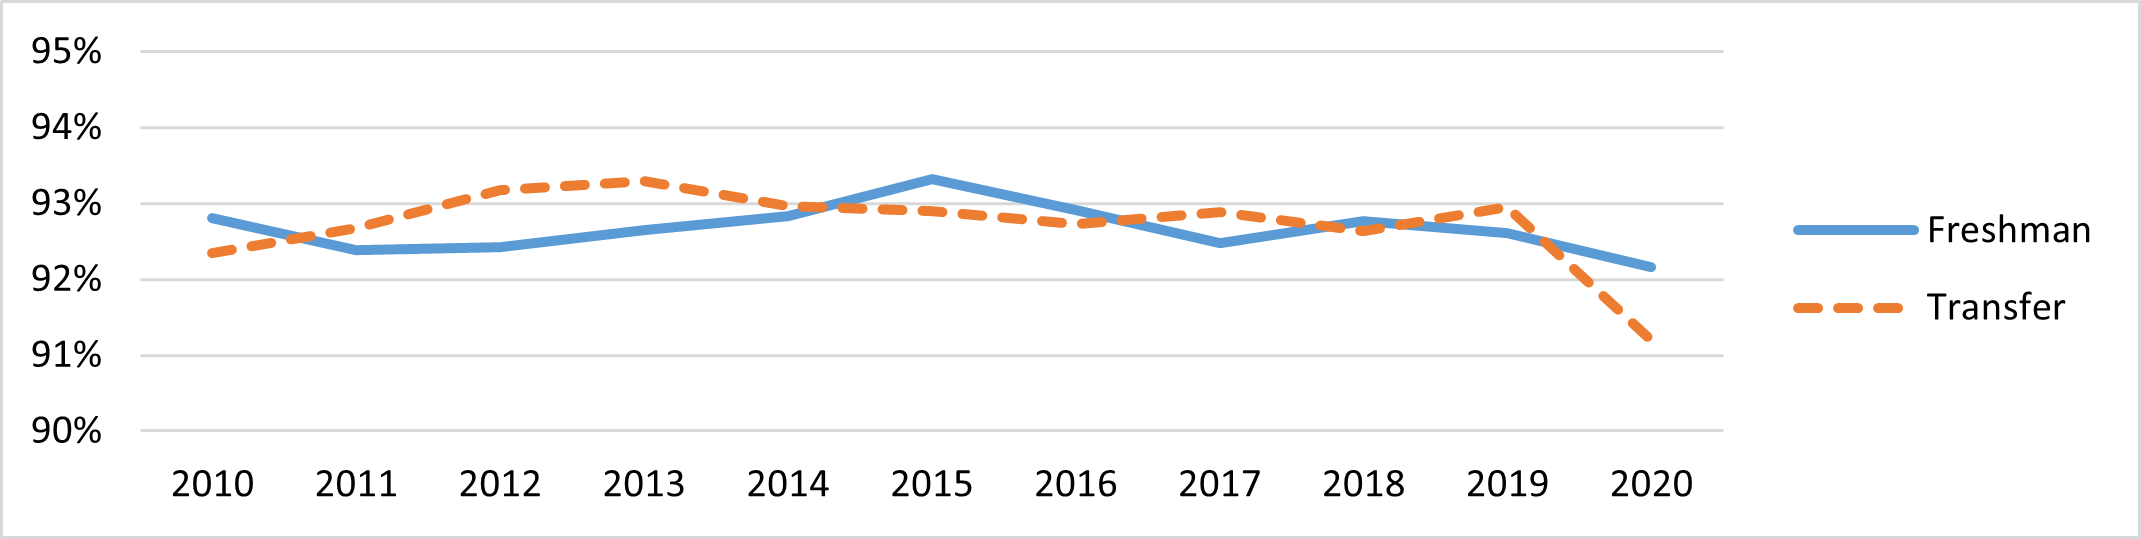
Source: UC Data Warehouse
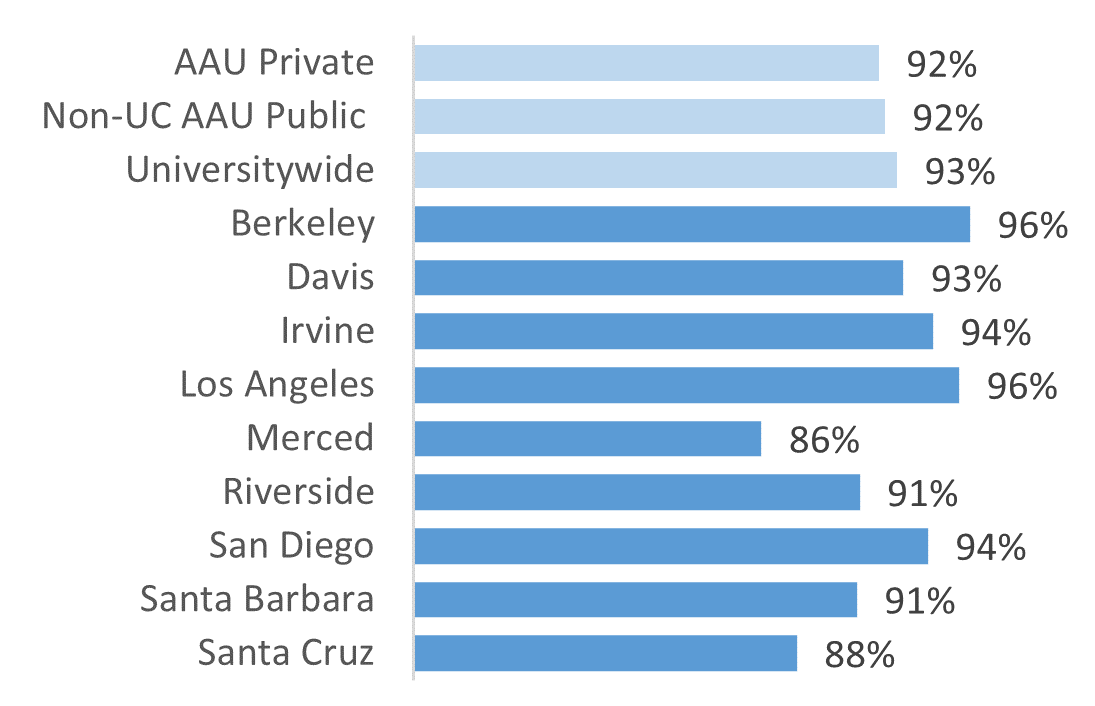
3.2.2 First-year retention rates, UC and comparison institutions, Cohorts entering fall 2020
| Freshmen |
Transfers |
 |
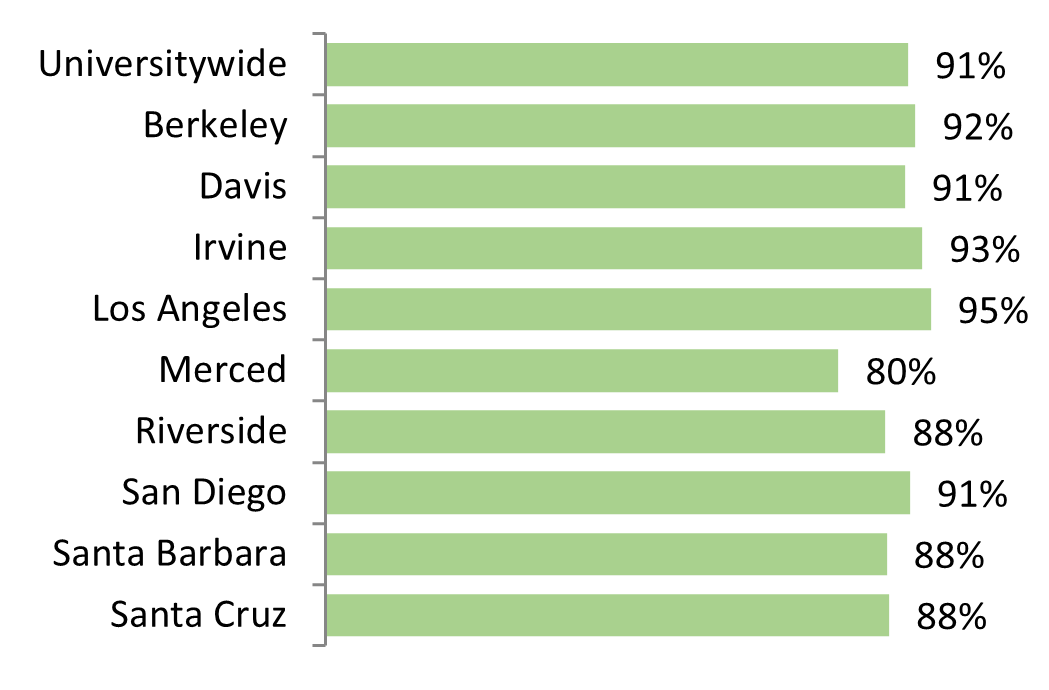 |
Source: Freshman data from IPEDS.1 Transfer data from UC Data Warehouse. Comparison data are not available for transfers.
3.2 RETENTION RATES
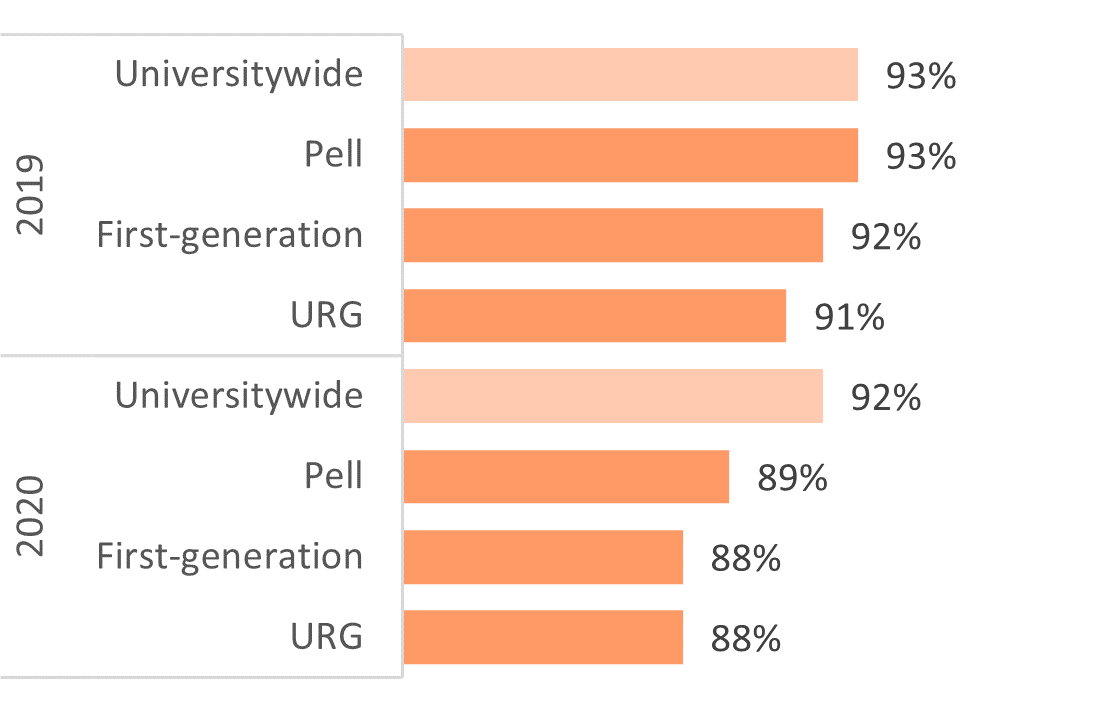
3.2.3 First-year retention rates universitywide and for Pell Grant recipients, first-generation, and URG students
Freshmen and transfer students, Cohorts entering fall 2019 and fall 2020
| Freshmen |
Transfers |
 |
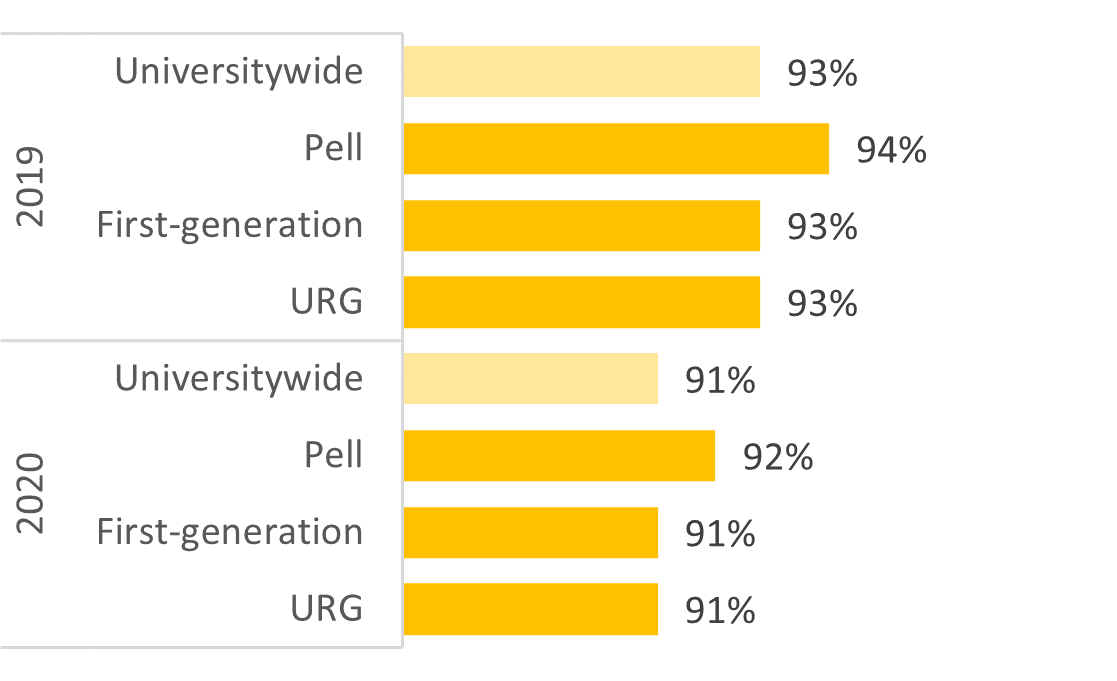 |
Source: UC Data Warehouse
The current Universitywide retention rate is 93 percent. This is comparable to non-UC AAU public institutions (92 percent) and AAU private institutions (92 percent). The Universitywide retention rate is 92 percent for freshmen students and 91 percent for transfer students, representing slight decreases from the previous year (93 percent for freshmen and transfer students, respectively). A few campuses have seen decreases in transfer student retention rates of nine (UC Merced) and four (UC Riverside and UC San Diego) percentage points. Campuses attribute the decreased retention rates to challenges related to the COVID-19 pandemic.
Additionally, Pell Grant recipients, first-generation students, and URG students have a seen a decline in retention rates of three to four percentage points, respectively, for the 2020 entering cohort compared to the 2019 entering cohort. For transfer students, the retention rates for Pell Grant recipients, first-genration students, and URG students are comparable to the Universitywide rate. However, the retention rates for these groups have followed the overall retention rate for transfer students and indicate a two-percent decline for the 2020 cohort compared to the 2019 entering cohort.
For students leaving in good academic standing (GPA ≥ 2.0), some campuses are expanding honors programs or providing opportunities for undergraduate research as early as the freshman year. For those leaving in poor academic standing (GPA < 2.0), some UC campuses are using Summer Bridge or early orientation. Campuses are also looking into housing and residential programs and cohort programs to integrate undergraduates.
Like entering freshmen, transfer students benefit from a smooth transition to UC. Several UC campuses have summer programs to support transfer students. More information on trends in UC retention rates can be found at:
universityofcalifornia.edu/infocenter/ug-outcomes.
Social science, life sciences, and engineering and computer science are the largest segments of bachelor’s degree recipients.
3.3.1 Undergraduate degrees awarded by discipline, UC and comparison institutions, 2019-20
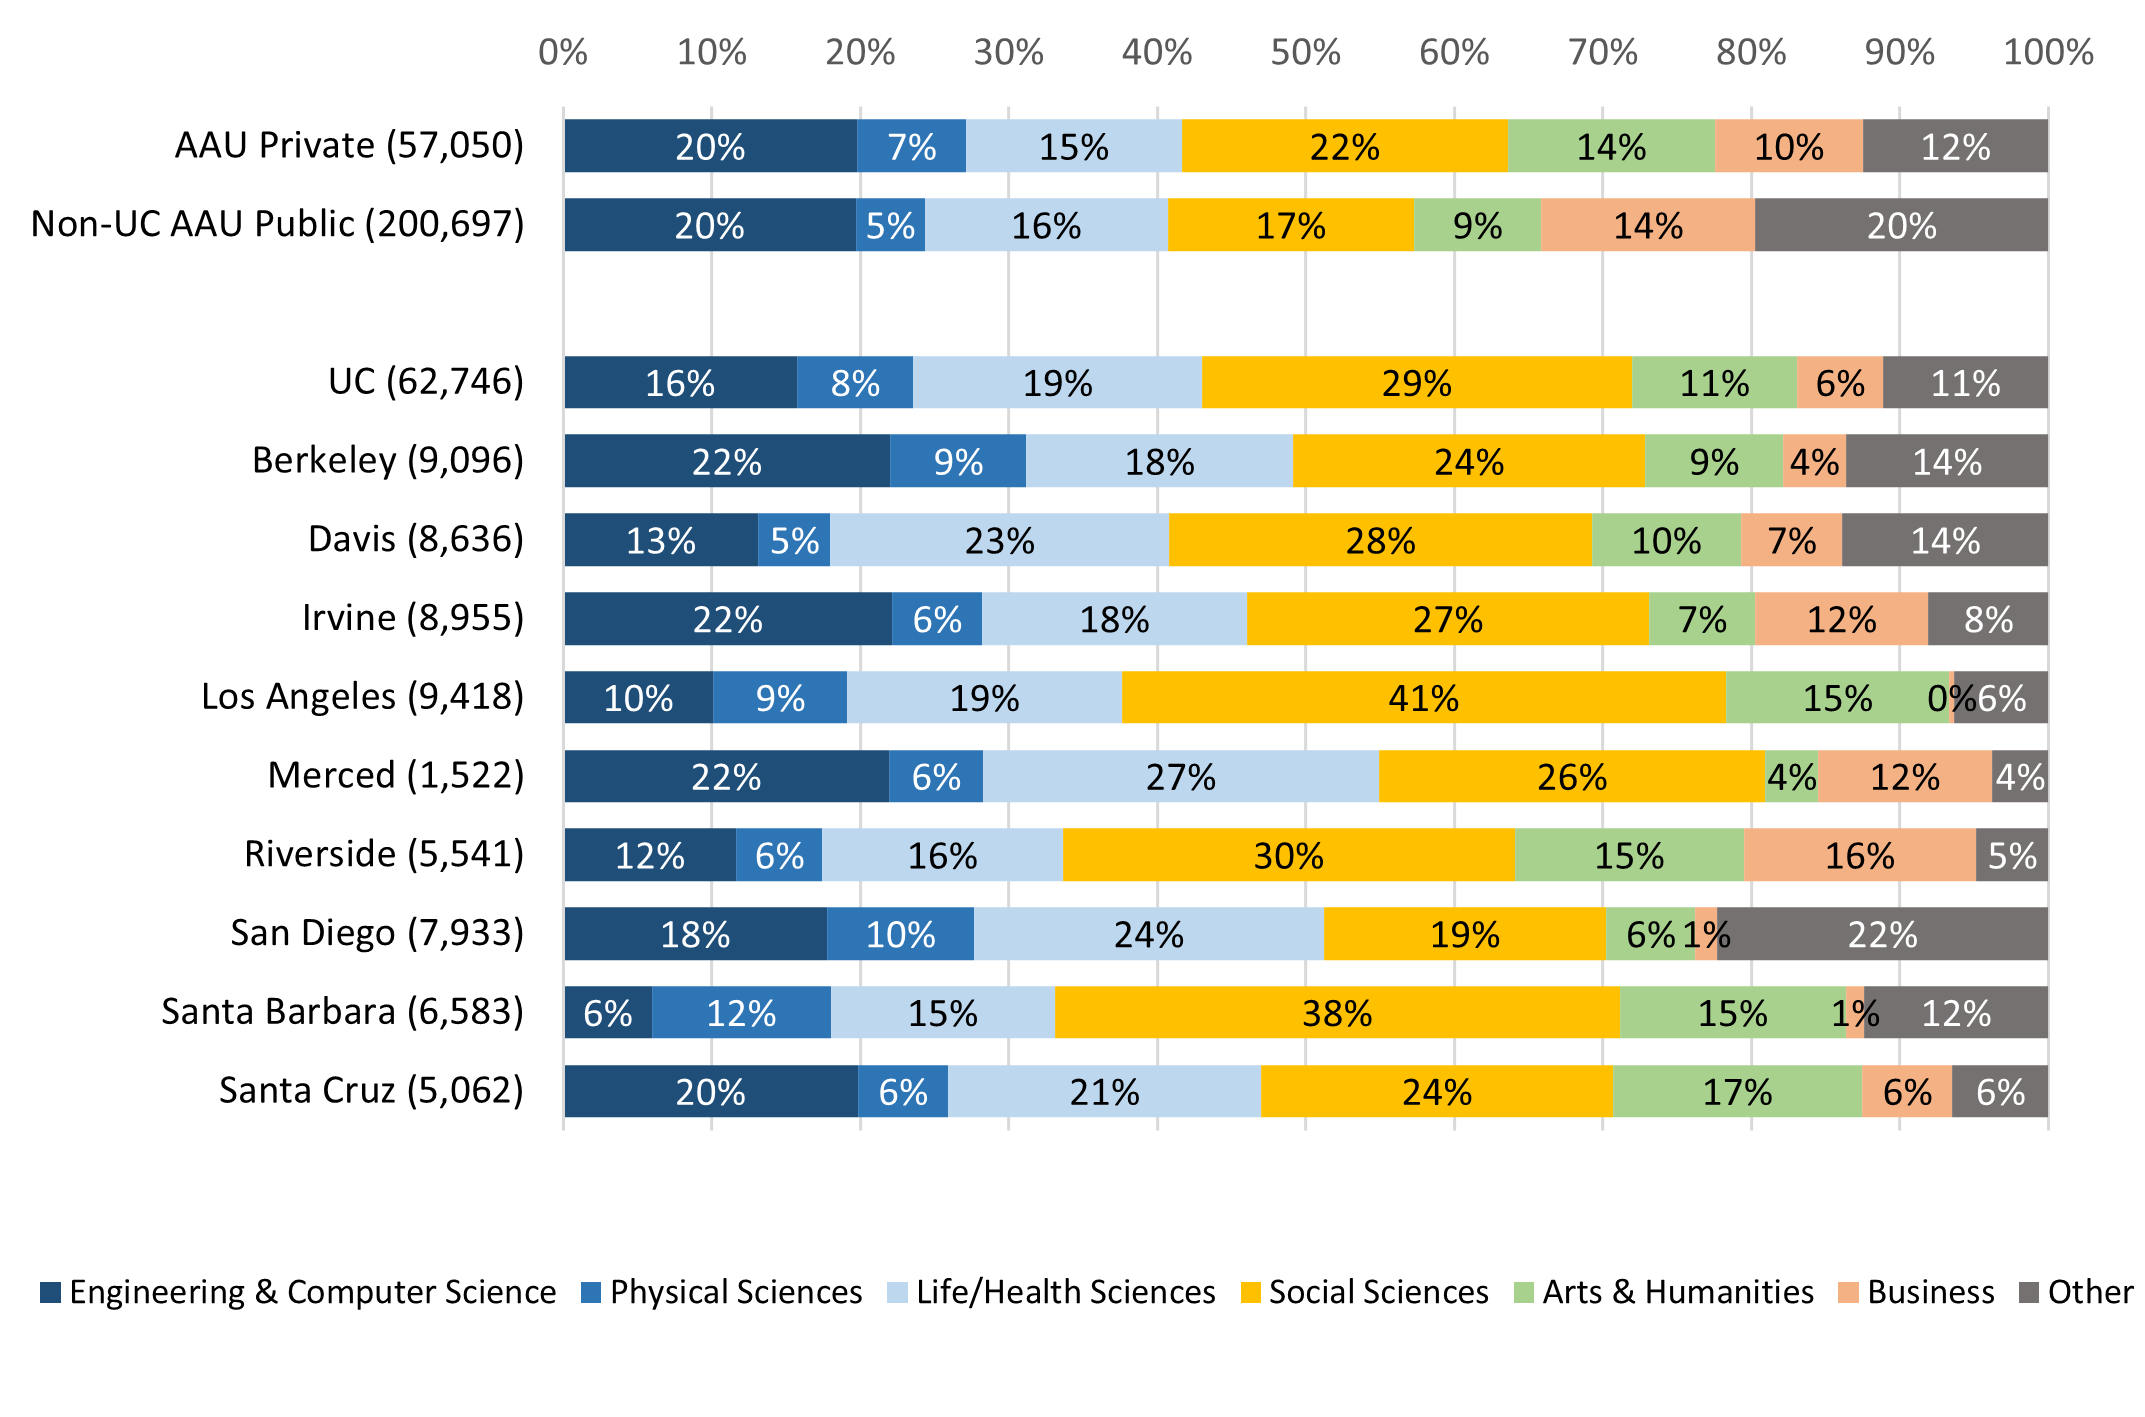
Source: IPEDS
About 43 percent of all undergraduate degrees awarded by UC in 2018–19 were in science, technology, engineering, and mathematics (STEM) fields. This is similar to the proportion at AAU public and private comparison institutions (41 and 42 percent, respectively).
Overall and across most disciplines, undergraduate degree recipients double their earnings between two and ten years after graduation.
3.3.2 Inflation-adjusted average and median alumni wages by selected majors, two, five, and ten years after graduation, Universitywide, 2000–01 to 2017-18 graduating cohorts, combined, sorted by popularity
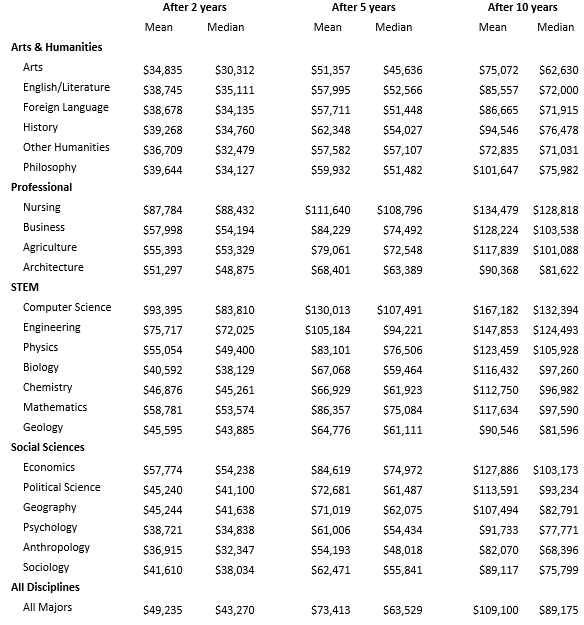
Source: California Employment Development Department and UC Corporate Student System. Includes alumni employed in the state of California only. Amounts are inflation-adjusted to 2021 dollars.
Alumni employment data provide evidence of UC’s contribution to the California economy and its role as an engine of economic mobility. UC enrolls a greater percentage of low-income students (from the bottom 20 percent of the income distribution) than other four-year institutions in California. Recent data made available through a partnership with the Equality for Opportunity Project show that more than one in three UC alumni who come from the bottom 20 percent of income rise to the top 20 percent of income as adults, based on the entering cohorts of 1999 to 2005. Moreover, comparisons using this national data show UC bachelor’s degree recipients working in California tend to earn about 20 percent more than UC graduates who work outside of California. More information on the Equality of Opportunity Project can be found at: ucop.edu/institutional-research-academic-planning/_files/CLIMB-a-mobility-analysis.pdf.
Over time, an increasing share of degree recipients go on to work across diverse California industries, particularly health care, public administration, education, and technology- and internet-related fields.
3.3.3 Industry of employment of UC bachelor’s graduates by discipline and years after graduation, Universitywide, 2000–01 to 2018–19 graduating cohorts, combined
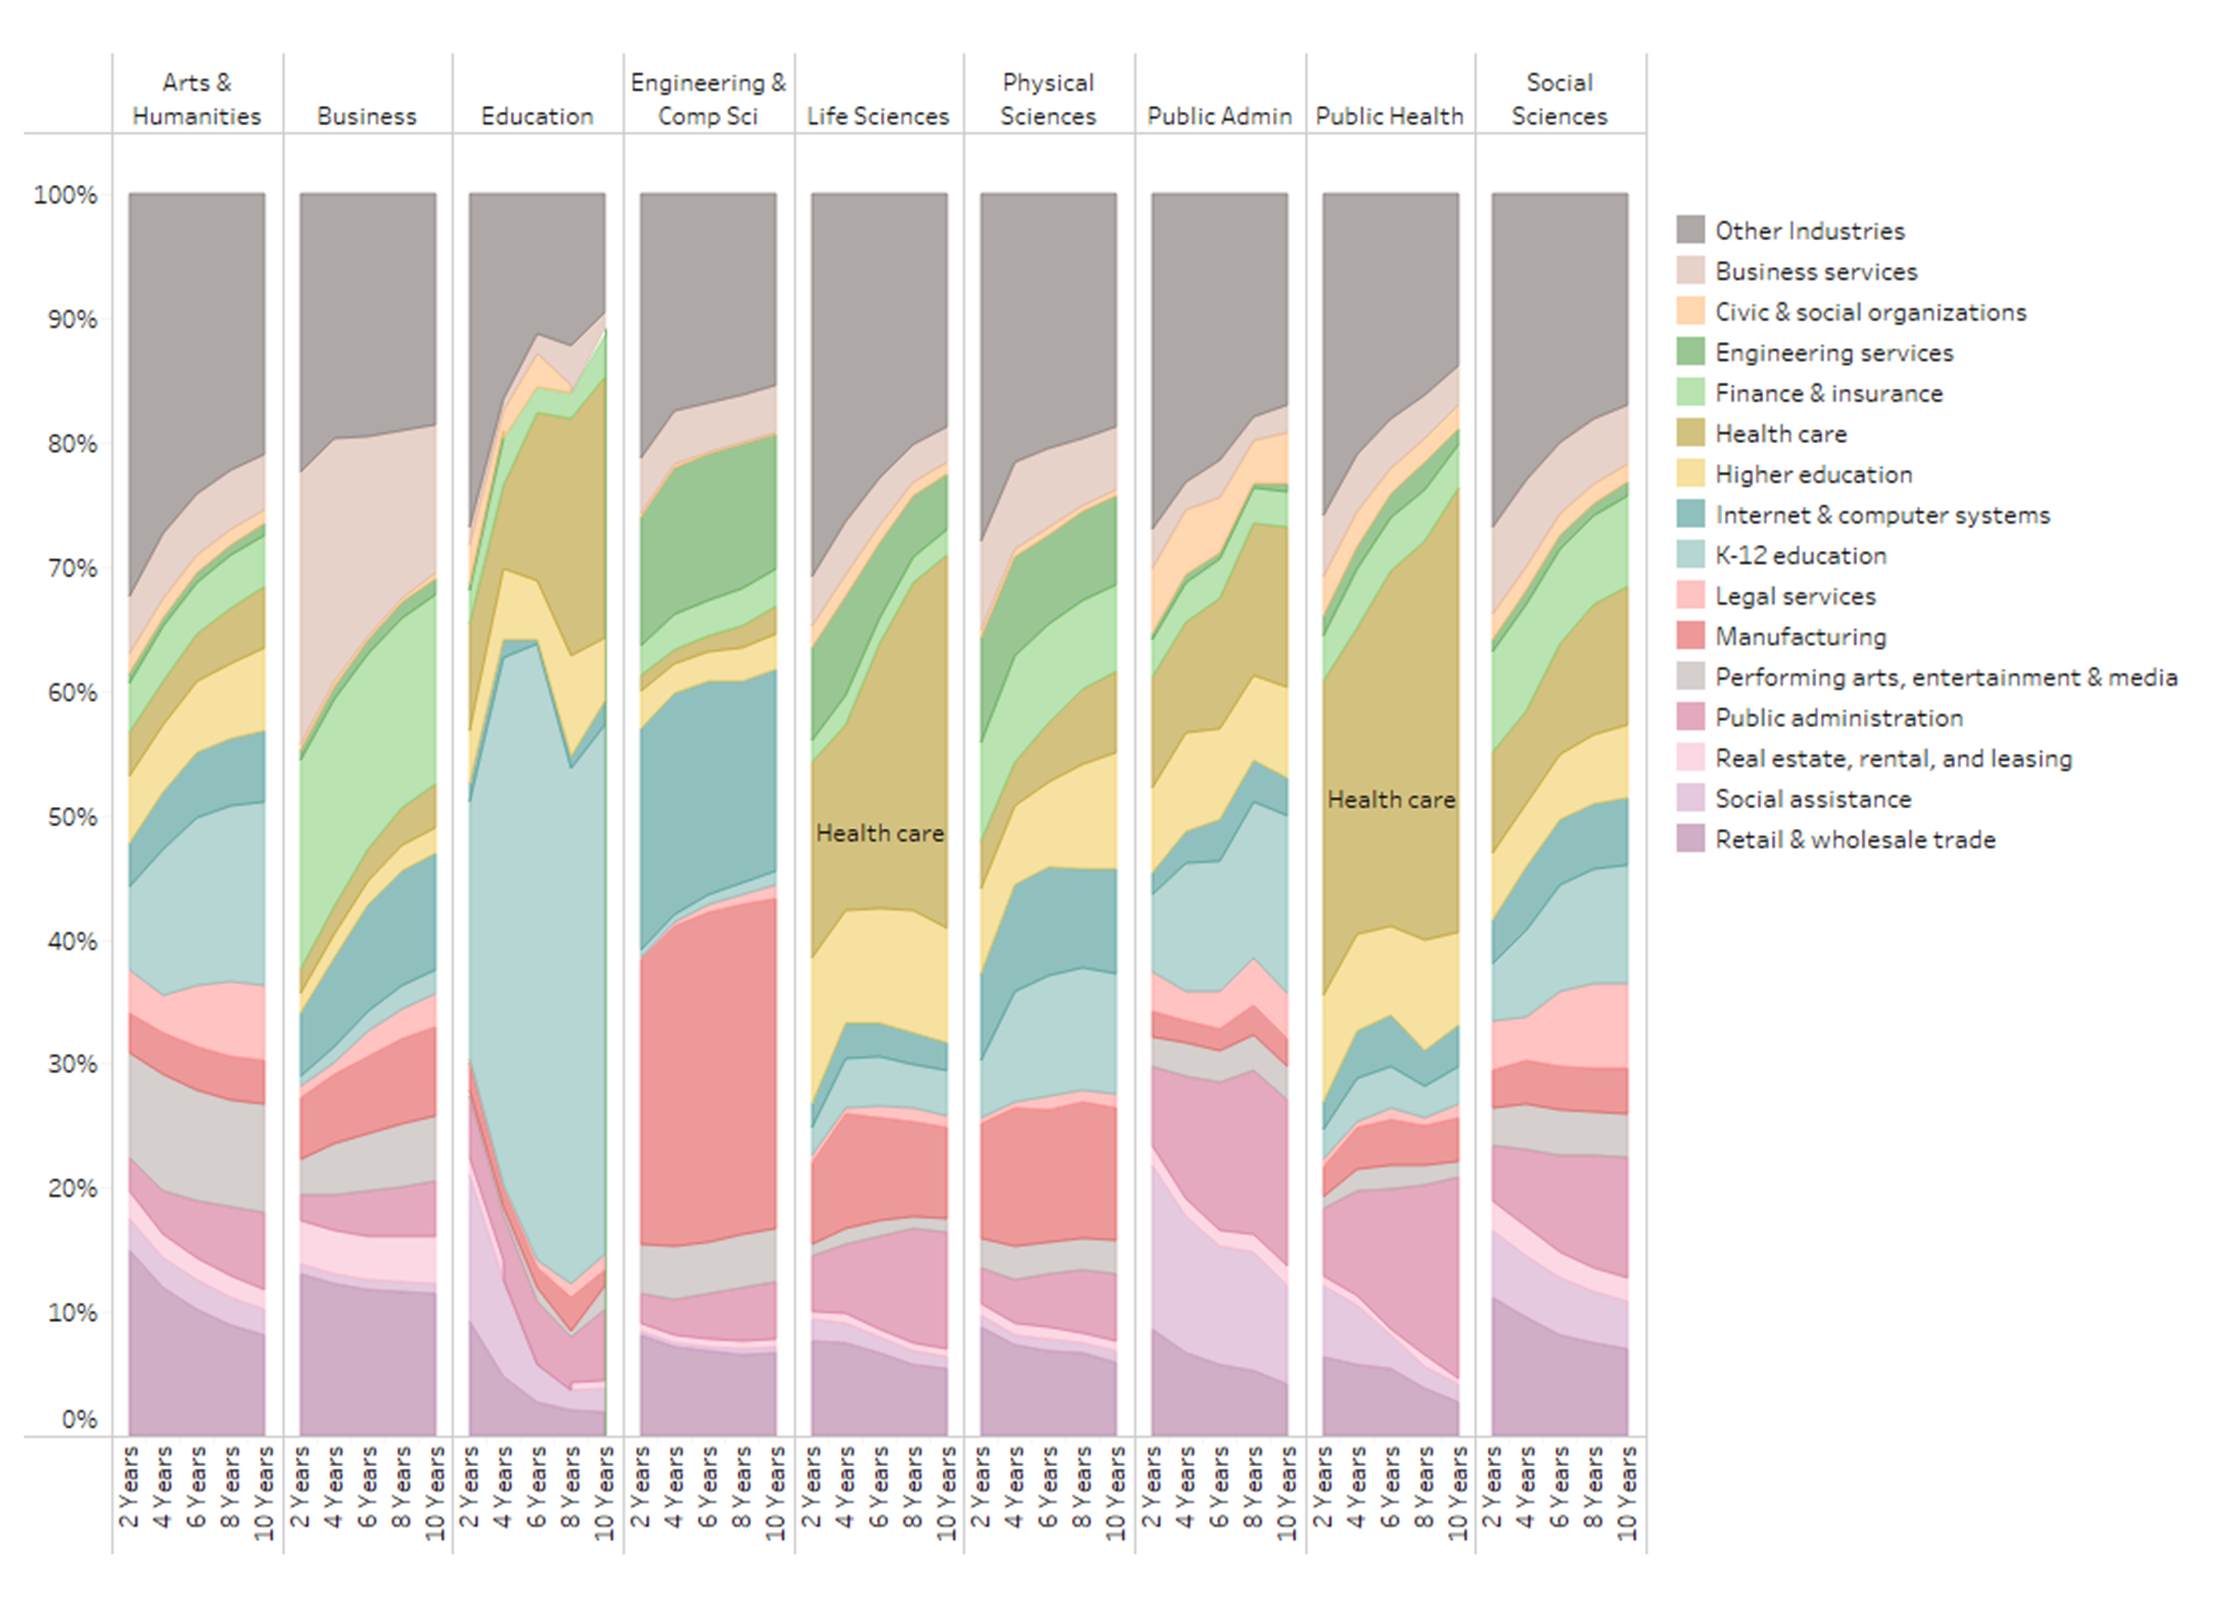
Source: California Employment Development Department and UC Corporate Student System. Includes alumni employed in the state of California only. Amounts are inflation-adjusted to 2021 dollars
UC graduates go on to work in a wide range of industries in California. Over time, bachelor’s degree graduates move to high-skill industries such as education, health care, public administration, engineering, and internet and computer systems.
A significant number of UC graduates go on to become educators within California’s K–12 and higher education systems. About four percent of UC graduates work in the states K–12 education system right after graduation and about eight percent do so within ten years of receiving their UC degree.
A large number of UC graduates also work in the state’s health care and social assistance workforce. At ten years after graduation, about 13 percent work in health care or social assistance (31 percent among life science majors).
3.3 OUTCOMES
3.3.4 Median alumni wages by industry of work for selected majors, five years after graduation, Universitywide, 2000–01 to 2015–16 graduating cohorts, combined
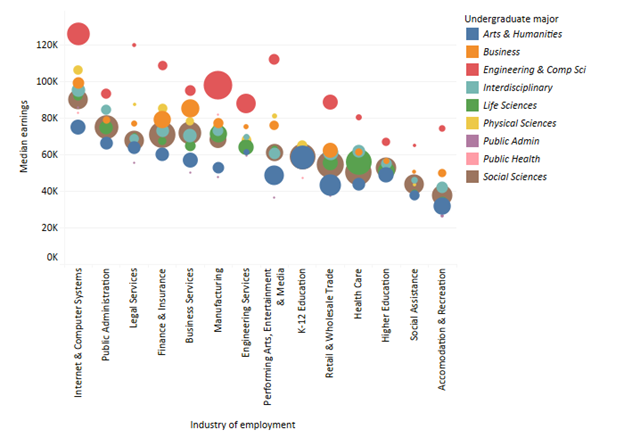
Note: Bubble size corresponds to percentage of alumni within majors employed in the industry. The largest bubble is 43 percent and the smallest is <1 percent.
Source: California Employment Development Department and UC Corporate Student System. Includes alumni employed in the state of California only. Amounts are inflation-adjusted to 2021 dollars.
A large share of Engineering and Computer Science majors work in the Internet & Computer Systems and Manufacturing industries, with median salaries of about $126K and $98K, respectively. Business majors are likely to work in the Business Services or Finance & Insurance industries where median earnings reach $85K and $79K. Arts & Humanities graduates are most likely to work in K–12 Education, where median salaries are much lower, at about $58K at five years after graduation.
Thirty-six percent of undergraduate degree recipients go on to earn a graduate degree, the majority of which are masters-level degrees.
3.3.5 UC undergraduate alumni graduate degree attainment by campus, 2000 to 2015 graduating cohorts, combined, as of June 2021
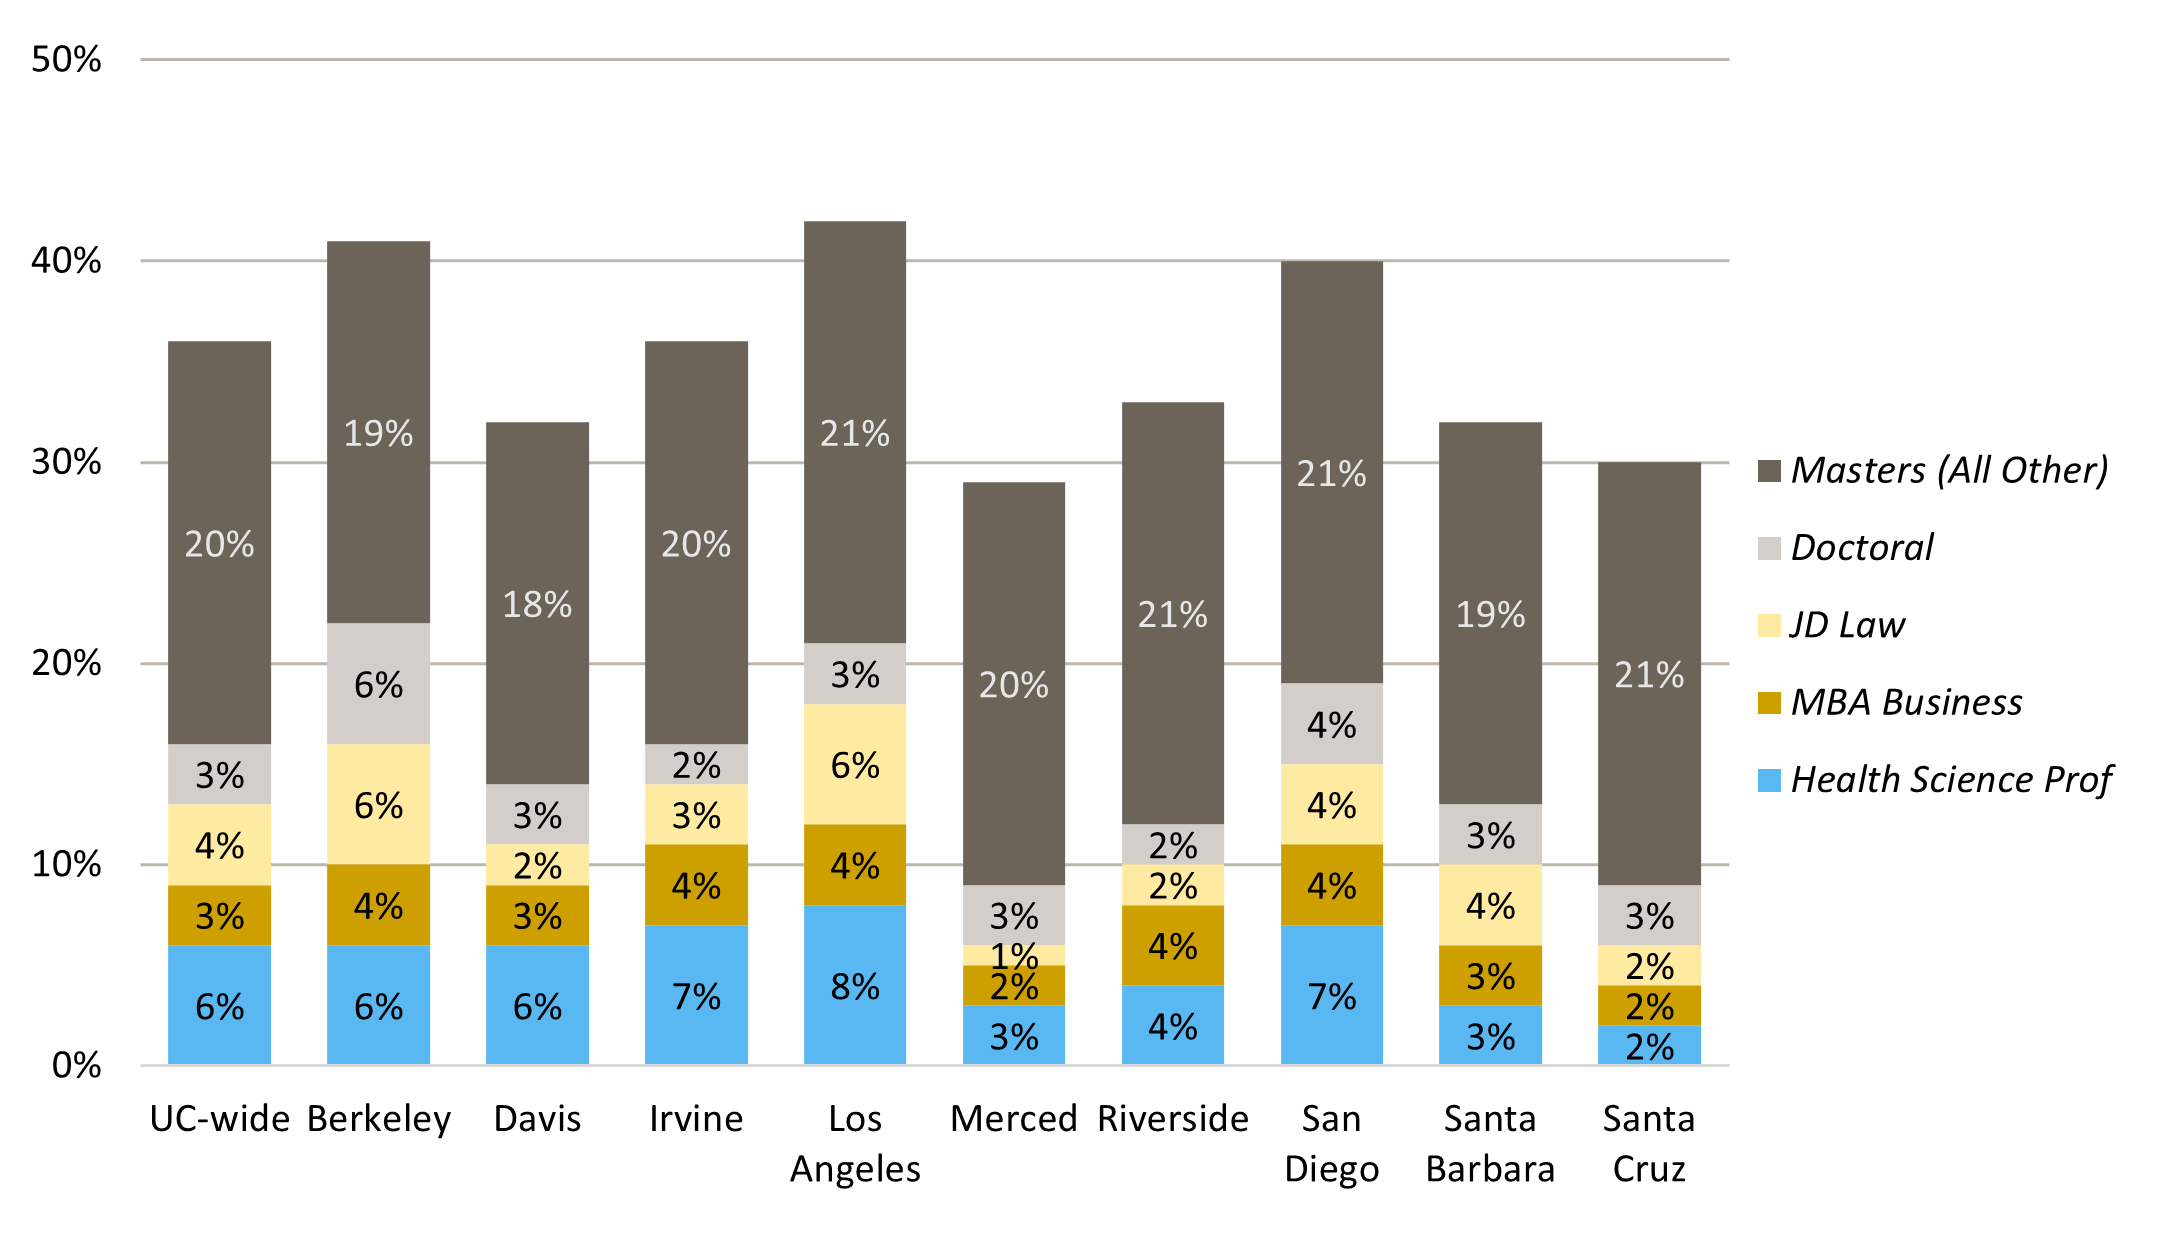
Source: UC Information Center
Earning a graduate degree is a major objective of many undergraduates who attend a research university. Nearly 40 percent of undergraduate students go on to earn a graduate degree after their undergraduate studies at UC.
The UC Information Center (universityofcalifornia.edu/infocenter/alumni-grad-outcomes) provides more details on graduate degree attainment by race/ethnicity, gender, Pell grant eligibility, and entry status. By 2030, UC aims to increase access to graduate degrees for populations that currently are less likely to attend graduate school.