Accountability Report 2022

Chapter 4:
chapter 4: graduate academic and graduate professional students

UC Merced Applied Mathematics Ph.D. student Cory Mccullough is teaching statistics to incarcerated students at two local prisons through the Merced College Rising Scholars Program.

In his early 20s, Cory Mccullough battled addiction and stole to support his habits. The Dos Palos native spent several stints in prison as early as 2011 for commercial burglary. Education was the last thing on his mind. Motivated by the desire to make a life for his kids, he enrolled at Merced College. Like many adult community college students, it took more than one attempt for the passion to learn to stick. But it did and he was a member of two honor societies: Phi Theta Kappa and Alpha Gamma Sigma.

Now, the former inmate finds himself in the joint again, this time not behind bars but helping incarcerated people forge their paths to higher education. The third-year UC Merced Ph.D. candidate is using his experiences and education to teach incarcerated students through the Merced College Rising Scholars Program. The program partners with the California Department of Corrections and Rehabilitation and serves 600 students at two state prisons in Chowchilla: Valley State Prison and Central California Women's Facility.

“They are exceedingly driven (as students) because they don't want to go back to where they've been. No other students I know have that kind of dedication.” Like Mccullough recognized, education can be the key to changing circumstances. “It means a lot for me to go in there and show them that they can do something different with their lives,” Mccullough said.


Goals

California’s Master Plan for Higher Education gives the University of California the responsibility of enrolling and preparing graduate academic and professional students to help meet the needs of California and the nation and to further the UC mission of teaching, research, and public service. Thus, reviving adequate support for the University of California is important, as its graduate education enterprise fuels California’s role as a national and international leader.

UC’s goals for graduate education are to offer outstanding degree programs, advance research, support undergraduate instruction, and prepare students to join a professional workforce or innovate on behalf of it. UC produces the leaders of the future — the teachers, artists, thinkers, innovators, scientists, inventors, doctors, lawyers, and nurses; and it creates an environment of exploration and discovery that stimulates innovation and invention. UC’s internationally renowned graduate education enterprise serves to drive California’s economy and its role as a global leader. UC graduate education allows California to grow, create jobs, drive industry, tackle unique challenges facing the state, and help improve the everyday lives of its inhabitants.

Types of graduate degrees

UC awards both graduate academic degrees and graduate professional degrees.

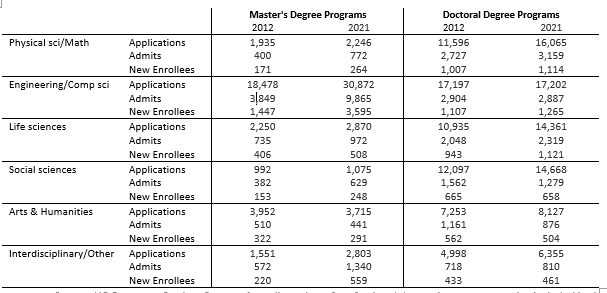
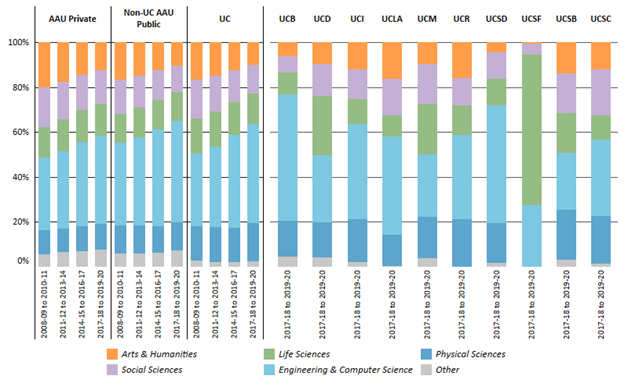
Graduate academic degrees — These include academic doctoral and academic master’s degrees in education, life sciences, physical sciences, social sciences, arts, humanities, and engineering/computer science. The largest proportion of graduate academic degrees awarded at UC is in the STEM fields — science, technology, engineering, and mathematics. From the 2016–17 to 2020–21 academic years, more than 70 percent of UC graduate academic degrees were awarded in STEM fields.

Graduate professional degrees — UC’s professional degrees include professional master’s and professional practice degrees in fields such as law, medicine, nursing, business, education, architecture, public policy, and the arts. The graduate professional category includes professional master’s degrees (e.g., M.B.A., M.Ed.) and professional practice degrees (e.g., J.D., M.D.). In the field of medicine, UC offers the nation’s largest instructional program in health care and health sciences.

The University maintains multiple funding models for its graduate professional programs. Many partially State-supported programs (e.g., M.B.A., law, medicine) assess professional degree supplemental tuition (PDST), which allows the professional schools to ensure their excellence, accessibility, and inclusiveness, and assists with affordability (by requiring return-to-aid for tuition revenue). Programs assessing PDST commit substantial resources to student financial support, including grants and scholarships. Since PDST began in 1994, both the number of professional degree programs that charge PDST and the amount charged have increased. Currently over 60 graduate professional programs charge PDST, ranging from $8,000 to $51,000 per year in addition to systemwide tuition and campus-based fees.

Other UC graduate professional programs, primarily master’s programs, follow a self-supporting funding model. The largest are business and management programs. These programs receive no State support and are funded entirely by revenues generated by the program and other non-State revenues. Self-supporting programs allow the University to serve additional students beyond those supported through State resources. They also fulfill higher education and workforce needs. Some self-supporting programs serve nontraditional populations such as full-time employees, mid-career professionals, and international students with specialized goals. Many programs are offered through an alternative mode of delivery, such as online or hybrid instruction, alternative scheduling, or at off-campus locations.

Graduate enrollment share

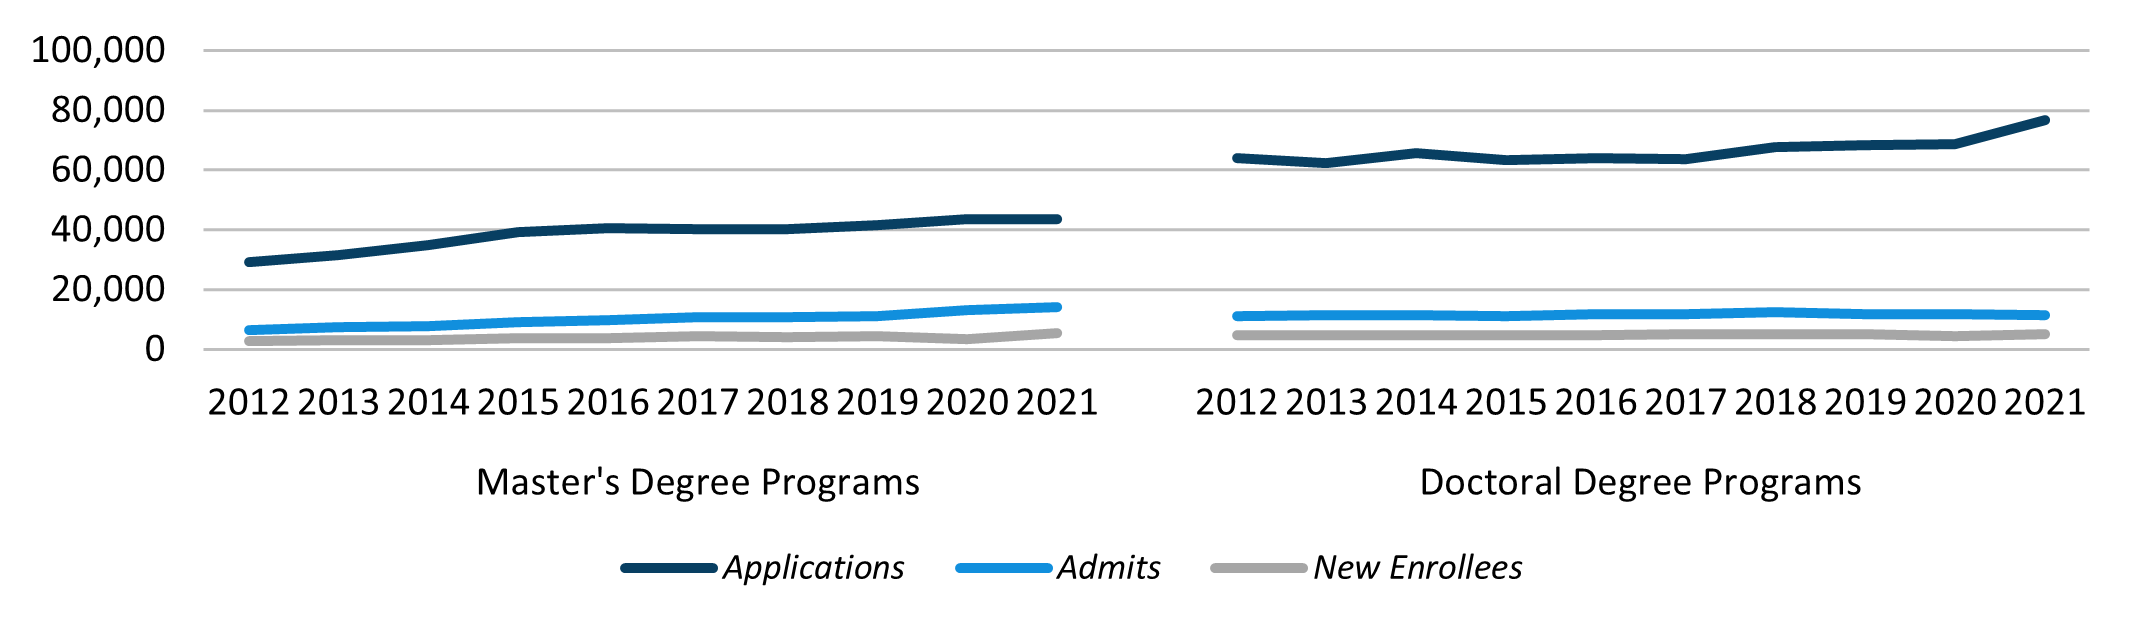
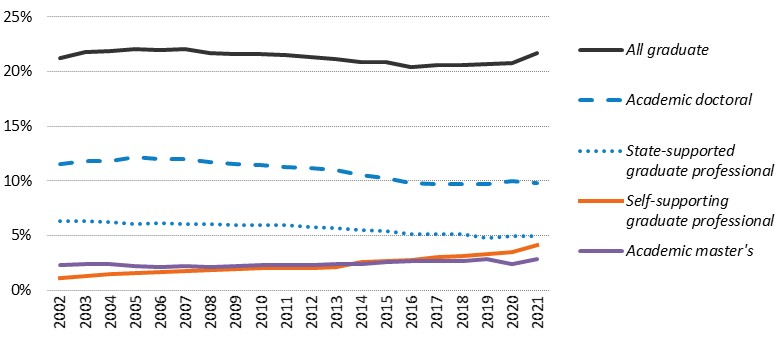
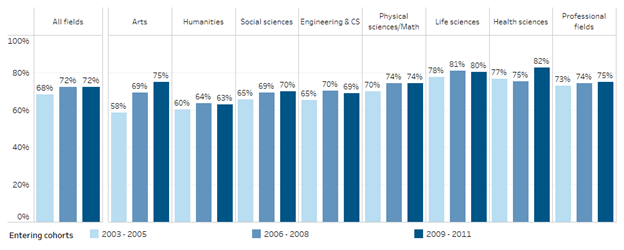
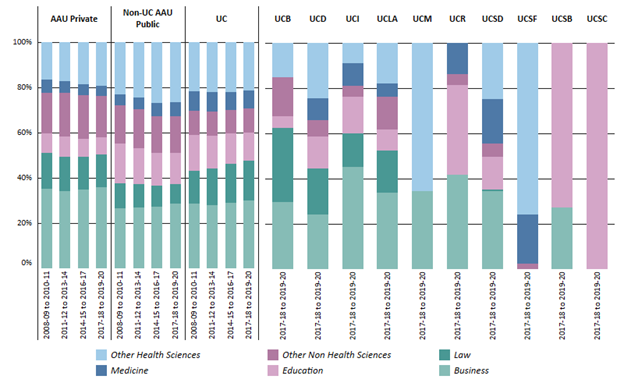
UC’s graduate education enterprise enrolls over 64,000 students, with doctoral students representing the largest number (29,200), and professional (26,500) and master’s (8,200) comprising the remainder. Despite its size, UC’s graduate education enterprise represents a smaller share of its total enrollment than that of its peers. Graduate students comprise 21 percent of total student enrollment at UC, which is lower than the proportion of graduate enrollment among other Association of American Universities (AAU) public (28 percent) and private (56 percent) peer institutions. In addition, while the graduate share of UC’s total enrollment has remained relatively constant over the last decade at 21 percent, the doctoral enrollment percentage has declined. The graduate professional percentage has risen steadily (4.2.1). Despite these enrollment trends, UC research degree production is comparable to other public university competitors. For example, in number of research degrees produced and percentage of research degrees produced in comparison to other types of degrees, UC compares favorably to its competitors. While enrollment needs will vary by program, it is important that academic doctoral student enrollment be supported at sufficient levels to drive UC’s research enterprise and support faculty innovation and retention.

UC is pursuing a multi-year framework with the goal of increasing degree attainment and producing 200,000 more degrees through 2030, About 40,000 of these additional degrees would be at the graduate level.

Supporting diverse career paths and making research accessible

To promote and highlight the work of master’s and doctoral students across UC campuses, UC holds an annual research communication competition called UC Grad Slam (gradslam.universityofcalifornia.edu). The event challenges its ten participants — the winners of each campus’s Grad Slam — to distill years of academic research into a three-minute presentation free of technical lingo. Grad Slam encourages students to communicate their research in a clear and compelling way to non-specialists — a skill that employers need and value. Campuses provide workshops and resources for students to develop this skill set. The contest also demonstrates to the public that UC research benefits their lives in both ordinary and quite extraordinary ways. While UC was unable to hold the 2020 installment of systemwide Grad Slam due to the coronavirus pandemic, Grad Slam returned in a virtual format in 2021. In 2022, the systemwide Grad Slam returned to an in-person competition but without a public audience due to continued pandemic-related limitations. The event was livestreamed, and the winner was Justin Lee from UC Berkeley for his talk on how genetic engineering could be used to stop COVID from replicating inside the body. Also taking home prizes for their outstanding talks were Amanda Quirk of UC Santa Cruz, who won second place for explaining her research into how galaxies collide; Rachel Sousa of UC Irvine, who snagged third place for her talk on how math can help us find a cure for cancer; and Wei Gordon of UCSF, who won the People’s Choice award for a talk on mutations that help fruit-eating mammals metabolize sugar.

UC Graduate Student Experience Survey (UCGSES)

In 2021, UC launched the UC Graduate Student Experience Survey (UCGSES). This systemwide survey was developed based on the UC Graduate Well Being Survey, Ph.D. Career Pathways Survey, and UC campus graduate and professional student surveys. This survey will be administered every two years to solicit graduate and professional students’ opinions on a broad range of academic and co-curricular experiences, including instruction and training, advising, basic needs, student services, and campus climate.

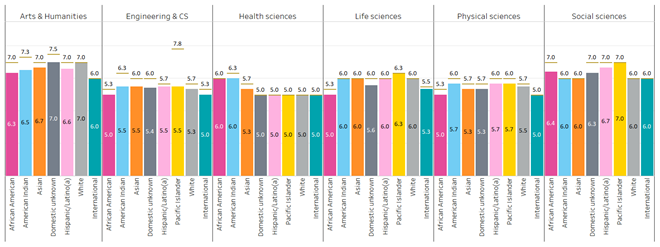
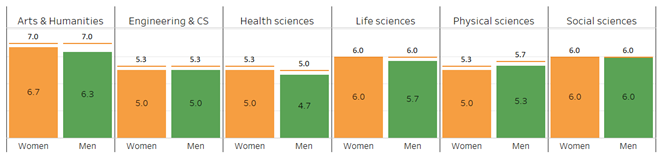
Results showed that about 65 percent of academic doctoral respondents reported they were confident in their financial situation and could get by financially without having to cut back on what was important to them. At the same time, about one-third reported that financial hardship had impeded their success in their program. Findings also revealed differences in financial confidence and hardship exists among students across disciplines. For example, students in Arts, Humanities, and Social Sciences were less likely to report that they were confident in their financial situation compared to other disciplines, and more than half of respondents in Arts and Humanities reported financial hardship had impeded their success. In addition, students from underrepresented racial/ethnic groups (Black/African American, American Indian, and Hispanic/Latino(a)), first-generation students, women, and LGBTQ students reported being less confident in their financial situation than other students. One way UC campuses plan to help increase academic doctoral student financial confidence is by providing multi-year funding/support offers at the time of admission to provide greater assurance regarding the amount and consistency of financial support  students can expect throughout their program. Presently, the minimum duration of support offered to students upon admissions varies. However, it is a UC goal for campuses to ensure that all academic doctoral students will receive a minimum of a five-year funding package upon admission. This is the current practice at UC Irvine, UC San Diego, and UC Santa Cruz.

Additionally, African American and American Indian graduate and professional students are less likely than other students to feel that their culture is respected on campus. These data are presented in Chapter 7: Diversity, indicators 7.2.3 and 7.2.4, and the whole UCGSES survey can be explored at this dashboard: universityofcalifornia.edu/about-us/information-center/UCGSES-data-tables

Equity and inclusion: Expanding academic pathways

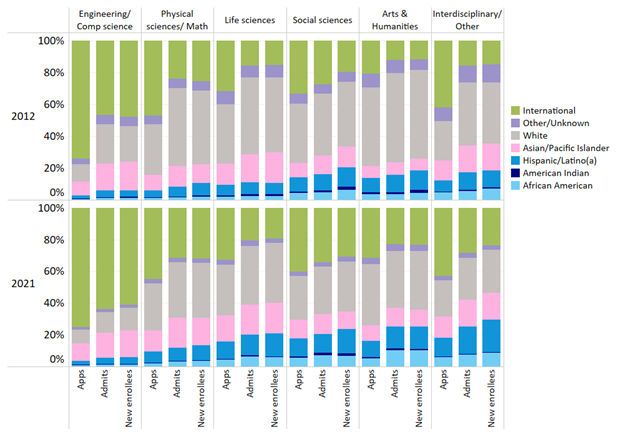
A more diverse and inclusive community of scholars at all levels has been a longstanding goal for UC, but progress at the doctoral, postdoctoral, and faculty levels has lagged compared to the undergraduate level. UC’s difficulties reflect challenges in both enrolling individuals from underrepresented groups in doctoral programs and in attracting and hiring them as postdoctoral scholars and faculty. Improving retention of faculty from underrepresented groups is also important. Improving climate and inclusion at UC continues to be critical to its excellence and future. There is a new systemwide initiative aimed at improving inclusion within UC’s academic community. It is:

Growing Our Own: Graduate Enrollment and Diversifying Ph.D. Pathways Initiative — To support and enhance the career path to the professoriate, the UC Council of Vice Chancellors (COVC) developed this important new systemwide effort. The initiative aims to increase the number and proportion of UC undergraduate degree recipients who earn an academic doctoral degree, and to increase the number and proportion of UC academic doctoral graduates from UC, California State University (CSU), other Hispanic-Serving Institutions (HSIs), Historically Black Colleges and Universities (HBCUs), and Tribal Colleges and Universities (TCUs). With this initiative, UC aims to build sustainable pathways for students from first-generation, low-income, and underrepresented racial/ethnic groups to the professoriate, in California and beyond. The initiative recognizes the importance of multiple interventions and partners — scaled up and sustained over time — to identify and cultivate talent for California’s future professoriate. The initiative seeks to expand existing programs at UC, create stronger connections among institutions of higher education for identifying and cultivating talent, and prioritize academic doctoral training for California undergraduates who collectively come from backgrounds as diverse as California itself. Using relevant data, each UC campus established growth targets achievable by 2030 for Ph.D. enrollments from UC undergraduates and students from­ CSU, HBCU, HSI, and TCU institutions, ranging from 27 to 40 percent. To achieve the growth targets, each campus has developed a plan aligned with the systemwide Growing Our Own strategic framework. In order for UC to maximize progress and appropriately widen the pathways to California’s professoriate, particularly for first-generation students and scholars from underrepresented communities of color, additional investment from the state is needed.

Growing Our Own is providing an infrastructure to better elevate, connect, and advance a range of pathways and inclusion efforts. Below are a few examples of such programs:

UC LEADS — The University of California Leadership Excellence through Advanced DegreeS (UC LEADS) program prepares promising UC undergraduate students for advanced education in science, technology, engineering, and mathematics (STEM) fields. The program prepares underrepresented UC undergraduate students for doctoral education opportunities at a UC campus.

From its inception in 2000, 1,153 scholars participated in UC LEADS, celebrating 20 years of programmatic effort and yielding significant outcomes. Ninety-nine percent of UC LEADS scholars graduate with their undergraduate degree, 76 percent pursue graduate school or have already earned degrees in a master’s or doctoral program, and 48 percent of UC LEADS scholars attended UC for graduate school. Given the importance of gender and ethnic equity within STEM-based doctoral programs, it is notable that 50 percent are women, 53 percent are first-generation college students, and 52 percent are from underrepresented minority groups. Thirty-seven UC LEADS alumni are now working as tenure track faculty, including seven within the UC system, while another 12 are employed in non-tenure track faculty positions, and 11 hold other academic career positions. Others work around the world as industry and government scientists, teachers, medical doctors, and entrepreneurs. It is also worth noting that 28 percent of scholars who enroll in a UC graduate program do so at the campus where they spent their second UC LEADS summer experience — further illustrating the impact and significance of the relationships that students build through this program.

UC-Hispanic Serving Institutions Doctoral Diversity Initiative (UC-HSI DDI) — Launched in fall 2019, the UC-HSI DDI aims to improve faculty diversity by enhancing pathways to the professoriate for underrepresented students from California Hispanic Serving Institutions (HSIs). The UC-HSI DDI includes two components: 1) competitive grant awards to UC faculty/faculty administrators to support short-term and long-term programs/projects to enhance and expand pathways to the professoriate for underrepresented students; and 2) funding to directly support graduate student preparation for the professoriate. Funding includes resources to support a limited number of Ph.D. students (two per campus), named UC President’s Pre-Professoriate Fellows (UC PPPF), who are California HSI alumni and have advanced to candidacy at UC. The UC President’s Pre-Professoriate Fellowship fosters their interest in and preparation for the professoriate. Additional professional development support for underrepresented Ph.D. students is provided to campus graduate divisions to encourage and help more scholars explore opportunities to help them consider, and pursue, careers in the professoriate. Another goal of the UC-HSI DDI is to enhance the climate of academic programs through interventions, incentives, and efforts that foster an academic culture of inclusion and equity — especially for faculty and students from underrepresented communities.

In two cycles, the UC-HSI DDI grants program has supported ten projects: five small grants (up to $50K) and five large grants (up to $350K). The lead investigators represent projects from seven different UC campuses: Davis, Riverside, and Santa Cruz each with two grants; and Irvine, Los Angeles, Merced, and San Diego each with one grant. The ten funded grants cover a broad range of disciplines/areas, including five in STEM, three in social sciences, and two interdisciplinary; together, these projects partner with more than 40 institutions and support nearly 450 students. The program has received significant interest, generating 59 grant applications and more than $13M in funding requests in only two cycles. The initiative has also supported 35 UC President’s Pre-Professoriate Fellows since the program’s inception, three of whom have been awarded the prestigious UC President’s Postdoctoral Fellowship.

UC-HBCU Initiative — The University of California-Historically Black Colleges and Universities (UC-HBCU) Initiative was established to increase the number of African Americans completing Ph.D.’s at UC by investing in relationships between UC faculty and HBCUs. The program has raised UC’s profile within the HBCU community and facilitated faculty research collaborations in addition to enrolling, retaining and graduating students. UC has hosted 700 UC-HBCU summer interns across nine campuses since it first hosted students in summer 2012. UC currently has 78 Ph.D. fellows enrolled across all ten UC campuses as a direct result of the Initiative: 68 percent in STEM fields, and 32 percent in Social Sciences/Humanities. Thirteen Ph.D. and 16 master’s students have graduated. Of the 13 Ph.D. graduates, five (38 percent) have secured tenure track positions in the professoriate, two in California, at UC Irvine and William Jessup University. One graduate is teaching at Penn State, Brandywine, and two have been hired as faculty at HBCUs (Fisk University and Howard University). Two Ph.D. graduates were awarded the President’s Postdoctoral Fellowship (PPFP), which helped them to secure faculty appointments, and others have also obtained prestigious postdoctoral appointments and employment positions. These alumni are making important contributions to California, the nation, and the world.

University of California President’s Postdoctoral Fellowship Program (PPFP) — The PPFP was established to encourage outstanding women and minority Ph.D. recipients to pursue academic careers at UC. The program offers postdoctoral research fellowships, professional development, and faculty mentoring to outstanding scholars in all fields whose research, teaching, and service will contribute to diversity and equal opportunity at UC. More information about the PPFP is presented in Chapter 5.

Looking ahead

UC is committed to expanding pathways to research and advanced degrees so that innovation can be driven at the highest levels and to propel California to lead the way with a diverse professoriate. Inclusion and equity are critical to the continued success and prominence of UC’s research enterprise. In addition to the programs noted above that help advance the Growing Our Own: Graduate Enrollment and Diversifying Ph.D. Pathways initiative, UC is launching two related pilot programs:

UC-California Community College Faculty Internship Program (UC-CCCFIP) 3-year Pilot. This pilot builds on UC Irvine’s current faculty internship program with California Community Colleges (the California Community College Internship Program-CCCIP), to support an expansion of the program to include additional UC and CCC campuses, and provide more competitive student stipends to attract Ph.D. students from underserved and diverse communities. This effort will promote pathways into faculty positions at California Community Colleges (CCC). The program will help expose UC students and encourage them to train for the professoriate, engage with undergraduate students from the California Community College system, and model advanced degree aspirations for CCC students. The systemwide pilot will be inclusive of all disciplines, but priority areas/fields will be identified by CCC. The UCI program has served nearly 100 students since it began, many of whom have gone on to careers as professors in CCCs, CSUs, and UCs.


Development of online Introduction to Research/Research Exposure course(s). California has an outstanding public higher education system, with UC, CSU, and CCC. UC’s role within the state is unique in  that it is a research university system, yet it has no strategic mechanism to ensure that each and every UC student has research exposure/experience. Beyond a UC course, there is great value in developing research exposure courses, in collaboration with UC’s intersegmental partners, that will target California undergraduates at CCC and CSU. This will serve to expose and potentially better position students, from all backgrounds, to consider career opportunities fueled by research, careers that are critical to supporting the state’s advanced workforce needs. This project is a long-term pilot effort.

Looking ahead requires prioritizing investing in pathways to success for California undergraduates and focusing on expanding and diversifying California’s much-needed pool of workers and innovators to meet the state’s advanced workforce needs. This requires ensuring that those pursuing advanced degrees and professoriate opportunities are reflective of the state of California. UC is looking forward to working in collaboration with state leaders to support that vision for California’s future. Investing in Growing Our Own is key to sowing success.

For more information)

UCOP Graduate Studies (website)

UC Grad Slam (website)

UC-Hispanic Serving Institutions Doctoral Diversity Initiative (UC-HSI DDI) (website)

UC LEADS (website)

UC-HBCU Initiative (website)

President’s Postdoctoral Fellowship Program (website)

Time to doctorate at UC (dashboard) 

Doctoral completion rates (dashboard)

Graduate student financial support and net cost of attendance (dashboard)

Employment and doctoral experience of Ph.D. recipients (dashboard)

Doctoral program data (dashboard)

UC Academic Planning Council, Graduate Education Workgroup’s Report “Recommendations for Greater Support of Doctoral Education,” (June 2019) (pdf)

Growing Our Own: Graduate Enrollment and Diversifying Ph.D. Pathways initiative (pdf)


 4.1 GRADUATE ACADEMIC ADMISSIONS

Universitywide graduate academic applications have increased substantially since 2012, while admits and new enrollments have remained relatively flat.

4.1.1 Graduate academic applications, admits, and new enrollees by degree program, Universitywide, Fall 2012 to Fall 2021

Graduate academic applications, admits, and new enrollees by degree program and citizenship, Universitywide, Fall 2010 to Fall 2018

4.1.1b

Source: UC Corporate Student System. A small number of professional doctoral programs are also included in these data. Universitywide
applications and admits are duplicated in this report since students often apply to more than one campus.

The demand for UC academic master’s and doctoral programs has increased since 2012. Applications for admission grew from 93,000 in 2012 to 120,300 in 2021. Nearly all of this increased demand has come from prospective international students, with international applications growing from 46,400 to 63,900. Engineering and computer science programs have higher demand from international students than do other disciplines. Recent survey data compiled by the Council of Graduate Schools show a similar nationwide trend of growth, with engineering as the most popular field.1

Since 2012, admits increased from 17,500 to 25,300 in 2021, and new enrollments increased from 7,400 to 10,588. Though applications are now predominantly (53 percent) from international students, both admits and new enrollments of domestic students exceed those of international students.

1 cgsnet.org/ckfinder/userfiles/files/2017_International_Survey_Report_Final.pdf


4.1 GRADUATE ACADEMIC admissions

Since 2012, the number and share of graduate academic admissions have significantly increased for international students.

4.1.2 Graduate academic applications, admits, and new enrollees by race/ethnicity and discipline, Universitywide, Fall 2012 and 2021

Graduate academic applications, admits, and new enrollees by race/ethnicity and discipline

Source: UC Data Warehouse

International students represent the majority of applicants, admits, and new enrollees in engineering and computer science graduate programs. The share of international students in all other disciplines also increased between 2012 and 2021. Social science and humanities programs have the highest shares of enrollment among students from underrepresented racial/ethnic groups, and those shares increased between 2012 and 2021.

Given recent events, including political decisions affecting visas and the COVID-19 pandemic, UC and the national higher education community are examining the impact on international students and UC degree programs.


 4.2 GRADUATE ACADEMIC AND PROFESSIONAL Enrollment

Graduate enrollment, as a share of UC’s total undergraduate and graduate enrollment,has increased slightly due to growth of self- supporting programs.

4.2.1 Graduate enrollment share of total, Universitywide, Fall 2002 to Fall 2021

Graduate enrollment share of total, Universitywide Fall 2000 to Fall 2018

Source: UC Corporate Student System. Academic master’s students include post-baccalaureate, teaching-credential students. Graduate professional includes professional master’s (e.g., M.B.A., M.Ed.) and professional practice (e.g., J.D., M.D.) degrees.1

With 21 percent graduate enrollment in 2021, including health science students, UC was lower than the average for non-UC AAU1 public institutions, at 28 percent, and the average for AAU private institutions, at 56 percent.

In fall 2021, the proportion of academic doctoral students varied across UC’s general campuses, from eight percent at Riverside, Santa Cruz, and Merced to 12 percent at Berkeley. At San Francisco, an exclusively graduate health-sciences campus, academic doctoral students made up 31 percent of fall 2021 enrollments. Since 2011, the share of academic doctoral students has declined at most campuses due to more rapid growth in the undergraduate, master’s, and professional populations, and,  in part, to the resources necessary to support enrollment of academic doctoral students in greater numbers.

UC awards 23 percent of California’s graduate academic master’s degrees, 62 percent of its academic doctoral degrees, and 20 percent of its graduate professional practice degrees.

4.2.1b
Source: UC Data Warehouse

1A list of the institutions in the AAU comparison groups can be found in the data glossary.


 4.2 GRADUATE ACADEMIC AND PROFESSIONAL Enrollment

Entering academic doctoral students from UC, CSU, HBCUs, HSIs, and TCUs are more racially/ethnically diverse than students from other undergraduate institutions.

4.2.2 Academic doctoral entering student enrollment by undergraduate institution and race/ethnicity, Universitywide

Academic doctoral entering student enrollment by undergraduate institution and race/ethnicity

Current percent of all academic doctoral students from UC/CSU/HBCU/HSI/TCU and Growing Our Own goal

growing our own

Source: UC Corporate Student System. HSIs exclude UC HSI and CSU HSI campuses

While about 16 percent of all entering UC academic doctoral students are from underrepresented racial/ethnic groups, 30 percent of those entering from UC, California State University (CSU), Historically Black College and Universities (HBCU), Hispanic Serving Institutions (HSI; non-UC/CSU), or Tribal Colleges and Universities (TCU) are from an underrepresented racial/ethnic group. Enrolling a higher proportion of students from these priority institutions will accelerate the growth in racial/ethnic diversity of the overall academic doctoral population and more rapidly translate into more diverse Ph.D. graduates entering the workforce and the professoriate. The recently launched systemwide initiative, “Growing Our Own: Graduate Enrollment and Diversifying Ph.D. Pathways,” prioritizes enrolling students from UC, CSU, HBCUs, other HSIs, and TCUs. This initiative seeks to increase the proportion of UC Ph.D.’s that come from these priority institutions from 27 to 40 percent.


 4.2 GRADUATE ACADEMIC AND Professional enrollment

UC net stipends remain below competitive offers, although the gap decreased substantially between 2013 and 2020.

4.2.3 Average net stipend offered to graduate academic doctoral students admitted to UC compared with their          first-choice non-UC schools, Universitywide, 2013, 2017, and 2020

by residency

Academic doctoral students’ graduate debt at graduation, by discipline, domestic students

by broad discipline

Average net stipend offered to graduate academic doctoral students admitted to UC compared with their first-choice non-UC schools

Source: UC Graduate Student Support Survey. Graduate academic professional doctoral programs include EdD, D.Env., DrPH., D.P.T. and D.N.S.

Doctoral students are crucial to a university’s research enterprise and instructional programs. To attract the most highly qualified applicants, universities offer aid packages that include the cost of tuition and stipends. Net stipend is the amount of aid that students have for living expenses after tuition and fees are paid. It does not include loans that the student may be offered. The “stipend gap” varies by discipline, as shown in the chart above. Since 2013, UC has made considerable progress in closing the net stipend gap with competing institutions, reducing it from $1,600 to about $900 in 2020. However, a considerable gap remains between UC’s average net stipend and growing living costs in California. Inadequate support poses challenges in recruitment of students, and for enrolled students, inhibits their ability to appropriately meet basic living needs. California’s high cost of living is also detrimental to UC faculty recruitment and retention. This is a significant problem with negative implications for graduate education and UC research which, without intervention, will negatively impact California’s industry innovation and the ability of the state to meet its advanced workforce needs.


 4.2 GRADUATE ACADEMIC AND Professional Enrollment

More than half of UC doctoral students graduate without debt. Doctoral students in the physical and life sciences have seen smaller increases in debt since 2006–07 and graduate with less average loan debt than those in the social sciences and arts and humanities.

4.2.4 Academic doctoral students’ graduate debt at graduation, by discipline, domestic students, Universitywide, Graduating classes of 2006–07 to 2020–21 (every two years)

Academic doctoral students’ graduate debt at graduation, by discipline, domestic students

Source: UC Corporate Student System1

Depending on the field of study, between 73 percent (arts and humanities) and 93 percent (physical and life sciences) of UC doctoral students take on no additional debt during graduate school.

Several factors account for the difference in debt burden between doctoral students in the physical and life sciences and those in other disciplines. Physical and life science students are more likely to be supported by research grants, which facilitates
their ability to spend more time on research, rather than carrying consistent teaching assistant responsibilities, as is the more common funding model in arts and humanities and some social sciences. Generally, graduate student researchers are funded at higher levels than teaching assistants. In addition, physical and life science programs take less time on average to complete than do programs in the social sciences or arts and humanities (partly due to the noted funding model differences).

Average debt is among graduates with debt. Debt categories are inflation-adjusted in 2019 dollars using CA CPI-W.


4.2 GRADUATE ACADEMIC AND Professional Enrollment

Graduates with the highest debt levels come from professional schools that charge higher supplemental tuition.

4.2.5 Graduate professional degree student debt at graduation, by discipline, domestic students, Universitywide, Graduating classes of 2006–07 to 2020–21 (every two years)

Graduate professional degree student debt at graduation, by discipline, domestic studentsSource: UC Corporate Student System

On average, 48 percent of the aid awarded to graduate professional degree students comes in the form of loans rather than fellowships or grants. By comparison, loans constitute three percent of the aid awarded to graduate academic students. Graduate funding models require greater reliance on loans for professional degree students, as their programs are of shorter duration, and many fields offer potentially higher incomes after graduation.

Most graduate professional degree students finance part of their education by borrowing. The increases since 2006–07 in average inflation-adjusted debt levels of graduating professional degree students vary considerably. Increases in graduate debt result from a combination of factors, including steady growth in tuition, cost of living increases, and greater student reliance on federal student loan programs.


 4.3 GRADUATE ACADEMIC STUDENt outcomes

Like other major research universities, UC awards a high proportion of graduate academic degrees in science, technology, engineering, and mathematics (STEM) fields.

4.3.1 Graduate academic degrees awarded by discipline, UC and AAU private and public comparison institutions, 2008–09 to 2010–11, 2011–12 to 2013–14, 2014–15 to 2016–17, 2017–18 to 2019–20; campus-level data for 2017–18 to 2019–20.

Graduate academic degrees awarded by discipline

Source: IPEDS1

UC graduates have had major impacts on the nation and the world — creating much of California’s biotechnology and computer industries, developing research breakthroughs that have led to major medical advances, shaping ideas about our world and culture, creating the economic and social infrastructure of our communities, and assuming political leadership in California and the nation.

UC’s graduate STEM programs reflect the predominant industries in California’s economy. In addition to leading all California institutions in the production of engineering and computer science degrees, UC far outpaces them in the production of degrees in the biological sciences — key to driving the growth of California’s biotechnology sector.

Since 2008–09, the number of graduate academic degrees awarded at UC grew by 38 percent, compared to 60 percent at the group of AAU private institutions and 32 percent for the group of non-UC AAU public institutions.

1"Other" includes interdisciplinary and academic degrees in otherwise professional fields, such as architecture, communications, and public administration.


 4.3 GRADUATE ACADEMIC STUDENT outcomes

UC’s doctoral completion rate increased in nearly every field over the two most recent cohorts studied.

4.3.2 Doctoral completion rates after ten years, by broad field, Universitywide, Fall 2003–2005, 2006–2008, and 2009–2011 entry cohorts

 Doctoral completion rates after ten years, by broad field

Source: UC Corporate Student System

The Universitywide ten-year doctoral completion rate across all fields for the fall 2009–11 entering cohorts was 72 percent. This is an increase from the 68 percent completion rate reported for the 2003–05 cohort. Among broad disciplines, life sciences and health sciences continue to have the highest completion rates. Engineering and computer sciences, social sciences, and humanities showed the lowest rates, owing to the longer normative time in those fields and different financial support models, although both experienced an increase compared to previous cohorts.

The overall improvement in ten-year completion rates may be attributed to at least two factors. First, student demographics have shifted to include a larger percentage of international students, who, as a group, have a higher ten-year completion rate than the overall cohort’s rate. (A variety of factors influence this difference, including different tuition rates for international students, which can drive motivation/expectation to complete programs sooner rather than later.) Second, shifts over time in enrollment toward disciplines with higher completion rates (STEM fields) affect the overall ten-year completion rate.

The Doctoral Completion Rates dashboard is available at: universityofcalifornia.edu/infocenter/doctoral-rates


 4.3 GRADUATE ACADEMIC STUDENT Outcomes

UC’s median ten-year time to doctorate by ethnicity and gender compares well with AAU institutions.

4.3.3 Median ten-year time-to-doctorate, by ethnicity and gender, Universitywide, AAU public and AAU private comparison institutions, 2015 to 2017 exit cohort

Median ten-year time-to-doctorate, by ethnicity and gender

Median ten-year time-to-doctorate, by ethnicity and gender, Universitywide, AAU public and AAU private comparison institutions

Source: Survey of Earned Doctorates, National Opinion Research Center

The median number of years required to complete a doctoral degree at UC (elapsed time-to-doctorate) is comparable to that at other major research universities. Men and women complete the doctorate in about the same amount of time at UC. Students from underrepresented groups (URG) have longer time-to-doctorate at UC and comparison institutions, whereas international students required substantially less time to complete the doctorate.

It should be noted that while UC’s URG completion rate is comparable to that of non-UCs, the gap between UC URGs and non-URGs is the largest among the comparison groups. While at this point, it is a small difference, it is important to raise awareness and continue to track outcomes.

The Time to Doctorate dashboard is available at: universityofcalifornia.edu/infocenter/time-to-doctorate


 4.3 GRADUATE ACADEMIC STUDENT Outcomes

UC’s median ten-year time-to-doctorate varies by ethnicity, gender, and discipline.

4.3.4 Median ten-year time-to-doctorate, by ethnicity and gender, by discipline, Universitywide, 2018 through 2020 exit cohort                                      

Median ten-year time-to-doctorate, by ethnicity and gender, by discipline


4.3.5 Median time-to-doctorate, by gender and discipline, Universitywide, 2018 through 2020 exit cohort

Median ten-year time-to-doctorate, by ethnicity and gender, by discipline

Source: UCOP Corporate Student System. Caution should be exercised in the interpretation of the American Indian and Pacific Islander groups due to small cell sizes.

In engineering and computer sciences and physical sciences, African American and international students had shorter registered time-to-doctorate (RTD) than their peers. In the social sciences, African American, Hispanic/Latino(a), and Pacific Islander students had longer RTD than American Indian, Asian, White, and international students. International students have shorter elapsed time-to-doctorate (ETD) and RTD in arts and humanities, engineering and computer science, life science, and physical science disciplines.

Men and women generally have comparable time-to-doctorate, with exceptions in health sciences, where women have a longer ETD and RTD; and the arts and humanities and life sciences, where women have a longer RTD. Women in the physical sciences have shorter ETD and RTD than men.

The Time to Doctorate dashboard is available at: universityofcalifornia.edu/infocenter/time-to-doctorate


 4.3 GRADUATE ACADEMIC STUDENT Outcomes

More than half of UC’s academic doctoral degree recipients plan to stay in California, a greater share than those who attended high school or college in California.

4.3.6 Origin and planned destination of UC academic doctoral degree recipients, Universitywide, 2009–10 to 2018–19Origin and planned destination of UC academic doctoral degree recipients

Source: Survey of Earned Doctorates.

The most recent data for UC’s doctoral degree recipients, based on those graduating between 2009–10 and 2018–19, show that over half plan to stay in California. Sixty-three percent of domestic doctoral degree recipients intend to stay, though only 41 percent of this cohort received their bachelor’s degrees in California, and only 39 percent attended high school in California. This proportion is higher in engineering, computer science, and life sciences fields, indicating that UC graduates are an important force in California’s robust economy in these areas.

Though a negligible share of UC’s international (not a U.S. citizen nor permanent resident) doctoral recipients attended high school or college in California, half intend to stay after graduation.

The Survey of Earned Doctorates (SED) is conducted for all individuals receiving a research doctoral degree. It is sponsored by the National Science Foundation, National Institutes of Health, U.S. Department of Education, U.S. Department of Agriculture, National Endowment for the Humanities, and the National Aeronautics and Space Administration.


 4.3 GRADUATE ACADEMIC STUDENT Outcomes

Half of UC academic doctoral and master’s graduates who stay in California work in higher education.

4.3.7 Industry of employment of UC graduate academic students in CA, by year after graduation, Universitywide, 2000 to 2018 graduating cohorts

Industry of employment of UC graduate academic students in CA, by year after graduation

Source: California Employment Development Department and UC Corporate Student System1

Graduates of UC academic doctoral and master’s degree programs go on to work in a broad range of industries in California. UC’s engineering and computer science programs supply workers to the state’s high-skilled and high-tech industries. Since 2000, over 28,000 graduates of these programs have entered the California workforce, with 34 percent working in the manufacturing sector and 26 percent working in engineering services. Another 25 percent go on to work in the state’s internet and computer services industry. About 17 percent of engineering and computer science graduates go on to teaching and research positions in the state’s college and university systems.

More than 59,000 graduates of UC academic doctoral and master’s degree programs in fields other than engineering/computer science have entered the California workforce since 2000. Nearly half of them (49 percent) have gone on to work in the state’s higher education workforce, which includes all of the two-year and four-year colleges, both public and private. This highlights the critical role of UC’s graduate academic programs in producing the cadre of faculty who teach California’s future college-educated workforce and conduct research that advances the state and national economies.

The contributions of UC academic doctoral and master’s graduates to the state workforce go beyond higher education. About 16 percent of the employed graduates of UC physical sciences and life sciences programs work in the state’s manufacturing sector, while another 21 percent work in the engineering industry. This shows that the skills gained in UC academic doctoral and master’s programs are both applicable and relevant to key high-tech industries.

The job market for doctoral and master’s degree recipients is nationwide, and those who leave California are not tracked in this data source.

1 Includes very small numbers of graduate professional students, who do not affect the overall picture.


Like other major research universities, UC awards a high proportion of professional degrees in business.

4.4.1 Graduate professional degrees awarded by discipline, UC and AAU private and public comparison institutions, Number of degrees grouped in 3-year intervals: 2008–09 to 2010–11, 2011–12 to 2013–14, 2014–15 to 2016–17, 2017–18 to 2019–20; campus-level data for 2017–18 to 2019–20.

Graduate professional degrees awarded by discipline

Source: IPEDS1

The proportion of professional degrees awarded by UC is comparable to AAU private and public institutions, with the greatest proportion of degrees awarded in business. The number and size of graduate professional degree programs vary by campus, with UCLA awarding the greatest number of professional degrees.

UC has also grown in the proportion of law degrees, in part due to the School of Law at UC Irvine, which opened in 2009.

Since 2003, UC has opened new professional schools in several other areas, including the Rady School of Management at UC San Diego in 2003, the School of Medicine at UC Riverside in 2013, the Sue and Bill Gross School of Nursing at UC Irvine in 2017, the School of Public Health at UC San Diego in 2019, and the School of Pharmacy and Pharmaceutical Sciences at UC Irvine, which began enrollment in fall 2021.

1 UC Merced added a professional master’s program in public health in 2017. “Other” includes disciplines such as public administration, architecture, communications, and library science.


UC professional programs prepare graduates for careers related to their field of study.

4.4.2 Industry of employment of UC graduate professional students in California, by year after graduation, Universitywide, 2000 to 2018 graduating cohorts

Industry of employment of UC graduate professional students in California, by year after graduation

Source: California Employment Development Department and UC Corporate Student System1

Graduates of UC Master of Business Administration (MBA) programs contribute significantly to the state’s high-skilled and high-tech industries. The 26,000 UC MBA graduates who have entered the California workforce since 2000 have worked in a wide array of industries, including manufacturing (26 percent), finance and insurance (20 percent), retail and wholesale trade (19 percent), and internet and computer systems (23 percent).

Over 16,000 graduates of UC health science professional practice programs (e.g., M.D., D.D.S., Pharm.D.) have gone on to work in California since 2000. The majority of these graduates (72 percent) go on to work in the state’s health care and social assistance sector. This highlights UC’s role, per the Master Plan, as the state’s sole public provider of many health science professional practice degrees and validates UC’s success in fulfilling that role. UC health science graduates also play key roles in other areas of public service in the state, including 39 percent who go on to work in the state’s higher education system and 27 percent who work in state government at some point after receiving their degrees.

UC law school graduates go on to work in two main areas — legal services and government. Of the 13,000 UC law school graduates who have worked in California since 2000, about 79 percent eventually find positions in the legal services industry. Another 18 percent go on to work in the public sector as government prosecutors and public defenders, and in other public agency roles. A large percentage of law school graduates start off in legal services initially after receiving their degree (73 percent), but by ten years after graduation this percentage has fallen to about 45 percent. The percent of UC law school graduates in government rises from seven percent to 16 percent over the same period.

1 Includes very small numbers of graduate academic students (e.g., Ph.D. business), which do not affect the overall picture.