Chapter 8:
TEACHING and LEARNING
Overview
The University of California provides its students with a rich learning environment created by faculty engaged in both teaching and academic research. Student learning at UC involves classes, seminars, and lab sections enhanced by collaboration with faculty and researchers. Through these activities, faculty and students engage in a learning process that helps develop critical thinking, communication, and problem-solving skills, as well as discipline-specific knowledge.
Educating students
UC’s faculty are principally responsible for maintaining UC’s academic excellence and promoting student success. Undergraduate student retention, graduation rates, and measures of effectiveness are presented in chapter 3 and persistence and graduation rates and time to degree for graduate students are in chapter 4. This chapter focuses on the learning experience of UC’s undergraduate and graduate students, reporting what skills they have learned, their engagement with faculty and their peers, and satisfaction with their UC experience. A majority of both undergraduate and graduate students report improvement in academic skills. This chapter also reports on the composition and workload of instructional staff across different academic disciplines and professional programs.
Promoting educational effectiveness
UC is committed to continuous improvement of instruction and employs a range of pedagogical and assessment strategies to enhance and support student learning. Campuses offer pedagogical development and training for faculty and teaching assistants to promote the use of evidence-based teaching practices and improve the quality of teaching and learning. UC’s teaching and learning centers and offices provide instructional development training to instructors every year, improving the quality of education for students in all disciplines across all ten campuses.
UC promotes educational effectiveness by supporting assessment of student learning. Assessment strategies include the development of program-level student learning outcomes and integration of evidence of student learning into academic program reviews. Programs across UC are undertaking curriculum redesign and improvement as a result of assessment work. Much of this aligns with the expectations of regional accrediting agencies, in particular the WASC Senior College and University Commission (WSCUC). As part of WSCUC accreditation, UC campuses assess five main core competencies of student learning: writing, oral communication, quantitative reasoning, information literacy, and critical thinking. Each UC campus posts its WSCUC accreditation reports online.
A number of these and other strategies are detailed in the UC 2030 Equity is Excellence report that summarizes campus efforts to achieve UC 2030 goals to improve timely graduation and overall student outcomes.
Innovative instructional offerings
UC faculty develop and teach an ever-expanding catalog of online courses and programs, expanding learning opportunities for UC and non-UC undergraduates, graduates, and professional students. The shift to emergency remote instruction during the pandemic increased faculty and student experience with remote offerings, with greater offerings – particularly in the summer – when compared to pre-pandemic levels. The UC cross-campus enrollment system can provide additional opportunities for students to access high-demand courses offered at other UC campuses, increasing flexibility and opportunities for degree completion.
For non-UC students considering matriculation at a four-year university or resuming their studies, UC offers online approved A-G and AP high school courses to increase academic preparation and UC and CSU eligibility through UC Scout. UC Extension offers online continuing education courses, professional certificates and post-baccalaureate programs for those seeking to advance their education and to enhance their professional skills.
In addition to online courses, UC leverages instructional technologies to enhance instruction and promote success. UC continues to develop and refine hybrid courses using multimedia resources, videos, podcasts, e-books, and other technology-based tools. UC follows best instructional practices to embed innovative technologies into course design and focuses on creating online and face-to-face learning experiences that encourage collaboration and maximize faculty-student and peer-to-peer interactions. Increasingly, UC courses utilize a flipped model of instruction, where lectures and other traditional classroom content are provided online, and classroom time is dedicated to group discussions, problem-solving activities, and other experiential exercises.
The largest gains in self-reported proficiency between freshman and senior years were in “understanding your field of study” and the “ability to design, conduct, and evaluate research.”
8.1.1 Self-reported proficiency levels, Spring 2024

University of California Undergraduate Experience Survey (UCUES) Data Tables, 2024 dashboard
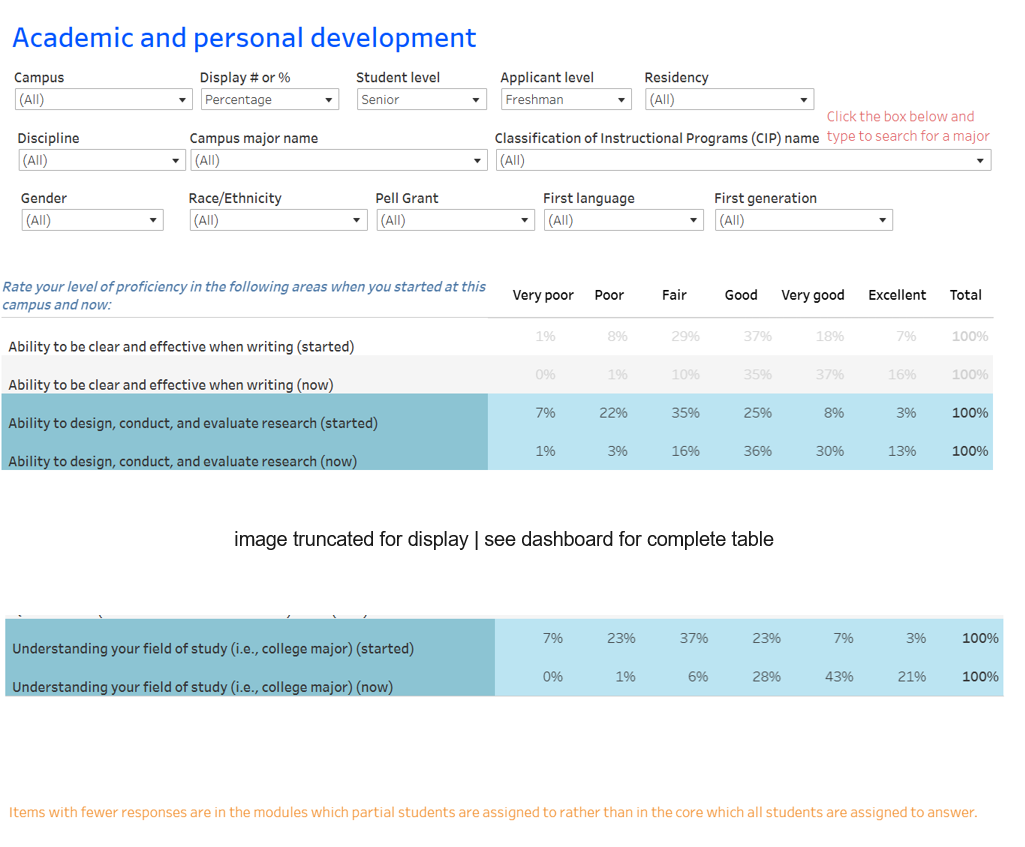
The Academic Development tab of the linked dashboard illustrates self-reported skill levels. To look at seniors who entered as freshmen, filter student level on “Senior” and applicant level on “Freshman.”
8.1 undergraduate student learning AND ENGAGEMENT
The Spring 2024 UCUES reports that 80 percent of bachelor’s degree recipients participated in research, internship, or service learning activities.
8.1.2 Student engagement with research, internships, and service learning, Spring 2024
UC undergraduate student research, internships, and service learning dashboard
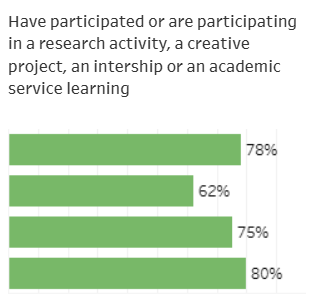
The dashboard provides detailed information on participating in research, internship, and service learning activities by campus, student demographics, and other categories. It shows a return of participation rates after a drop during the pandemic.
8.1 undergraduate student learning AND ENGAGEMENT
The Spring 2024 UCUES reports that 46 percent of students brought up ideas or concepts from different courses during class discussions and made a class presentation at least somewhat often.
8.1.3 Academic engagement, Spring 2024
University of California Undergraduate Experience Survey (UCUES) Data Tables, 2024 dashboard
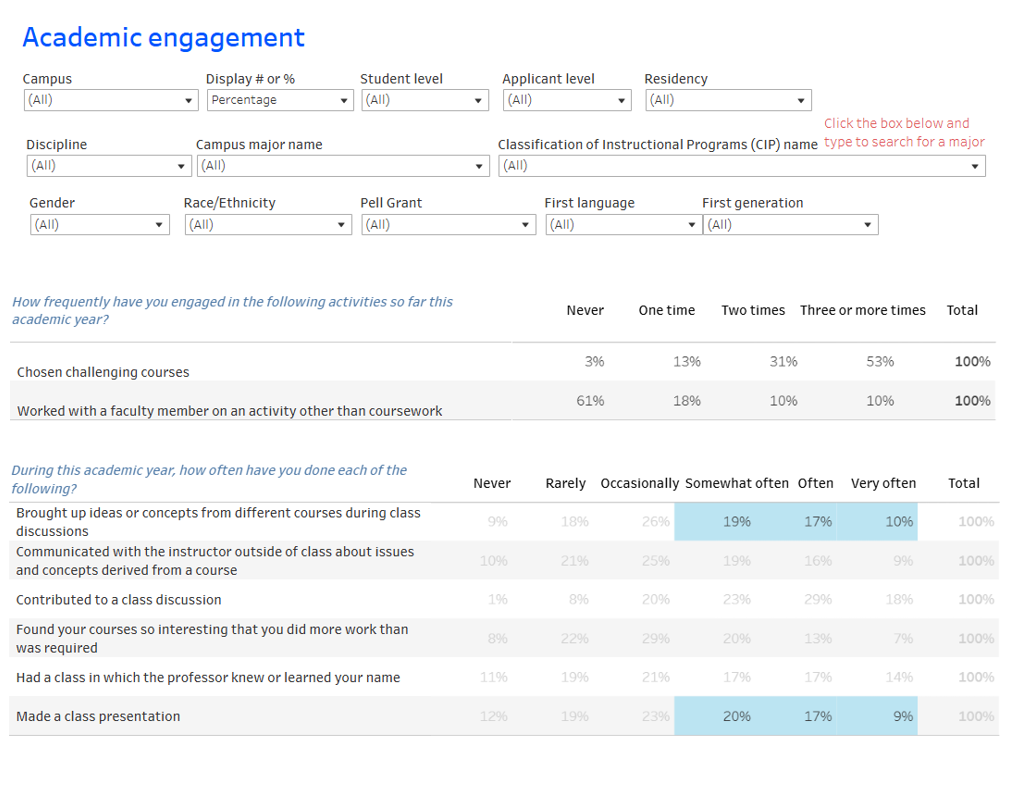
The academic engagement tab of the UCUES dashboard highlights items related to academic engagement.
Undergraduate student satisfaction increased to 90 percent, up from an average of 80 percent seen over the last decade.
8.1.4 Student satisfaction, Spring 2006 to 2024
UCUES common item longitudinal analysis dashboard
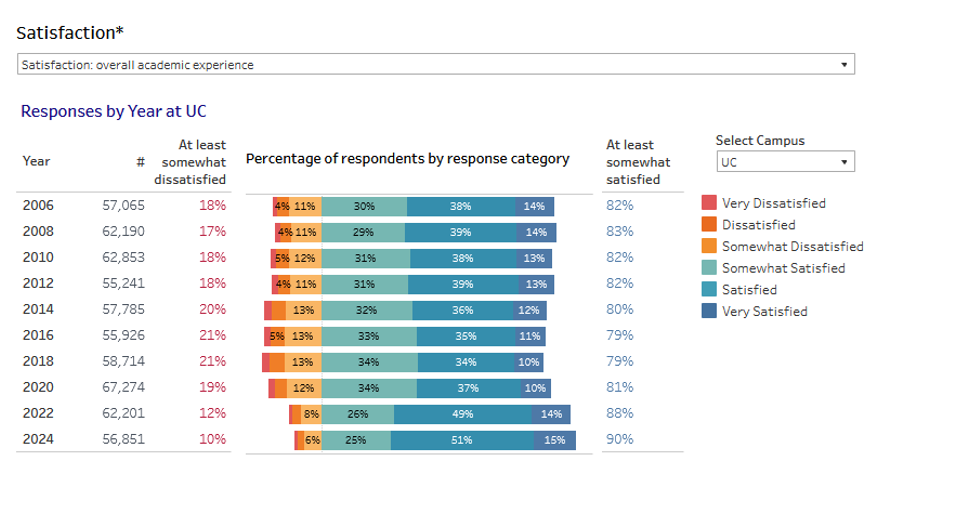
The UCUES common items longitudinal analysis dashboard provides trend data on critical items and the ability to filter by campus and other characteristics.
Following a dramatic increase in online offerings during the COVID-19 pandemic, online course-taking is greater than pre-pandemic levels with 23 percent of undergraduates taking at least one online course.
8.1.5 Share of undergraduates taking at least one course online. Universitywide and comparison institutions, 2013–14 to 2023–24
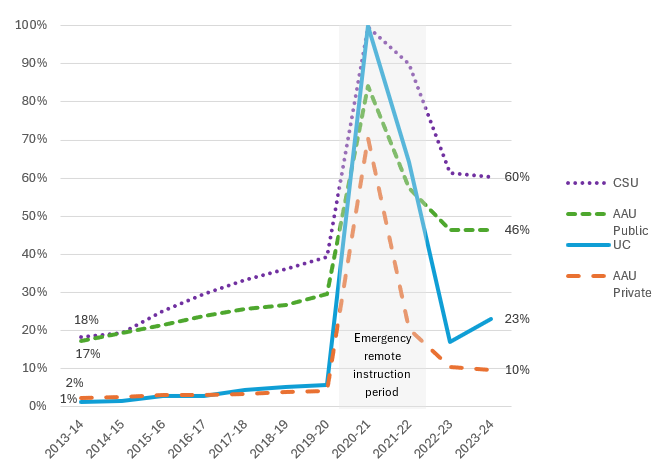
Source: IPEDS
In 2019–20, 3 percent of all undergraduate units, or approximately 279,000 out of 9.8 million, were delivered online. The Governor’s 2022–23 Budget proposed to double that number by 2030. In 2020–21, 96 percent of units were delivered online due to the COVID-19 pandemic. In 2023-24, 11 percent of all undergraduate units were delivered online.
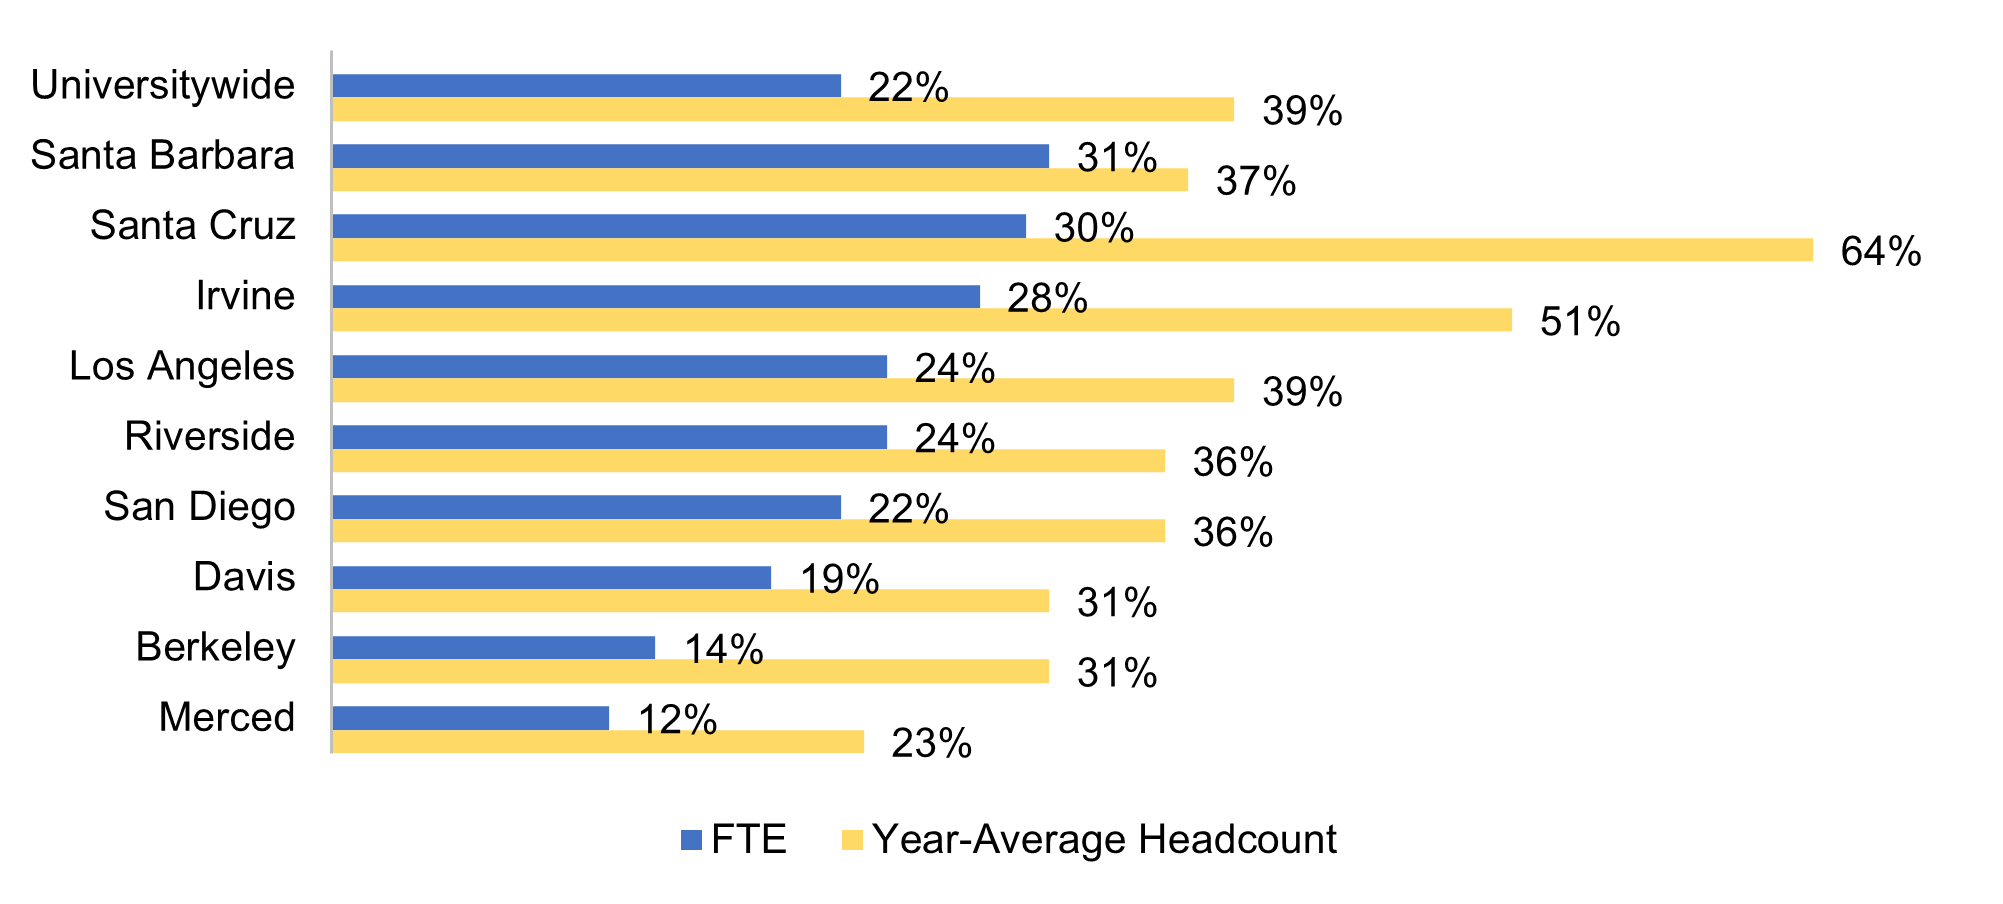
Summer enrollment, as a percentage of academic year enrollment increased to 22 percent of 2023-24 FTE boosted by online course offerings and summer first-year orientation courses at some campuses.
8.1.6 Summer enrollment as a percentage of prior year fall-winter-spring enrollment Universitywide and UC campuses, 2009-10 to 2023-24
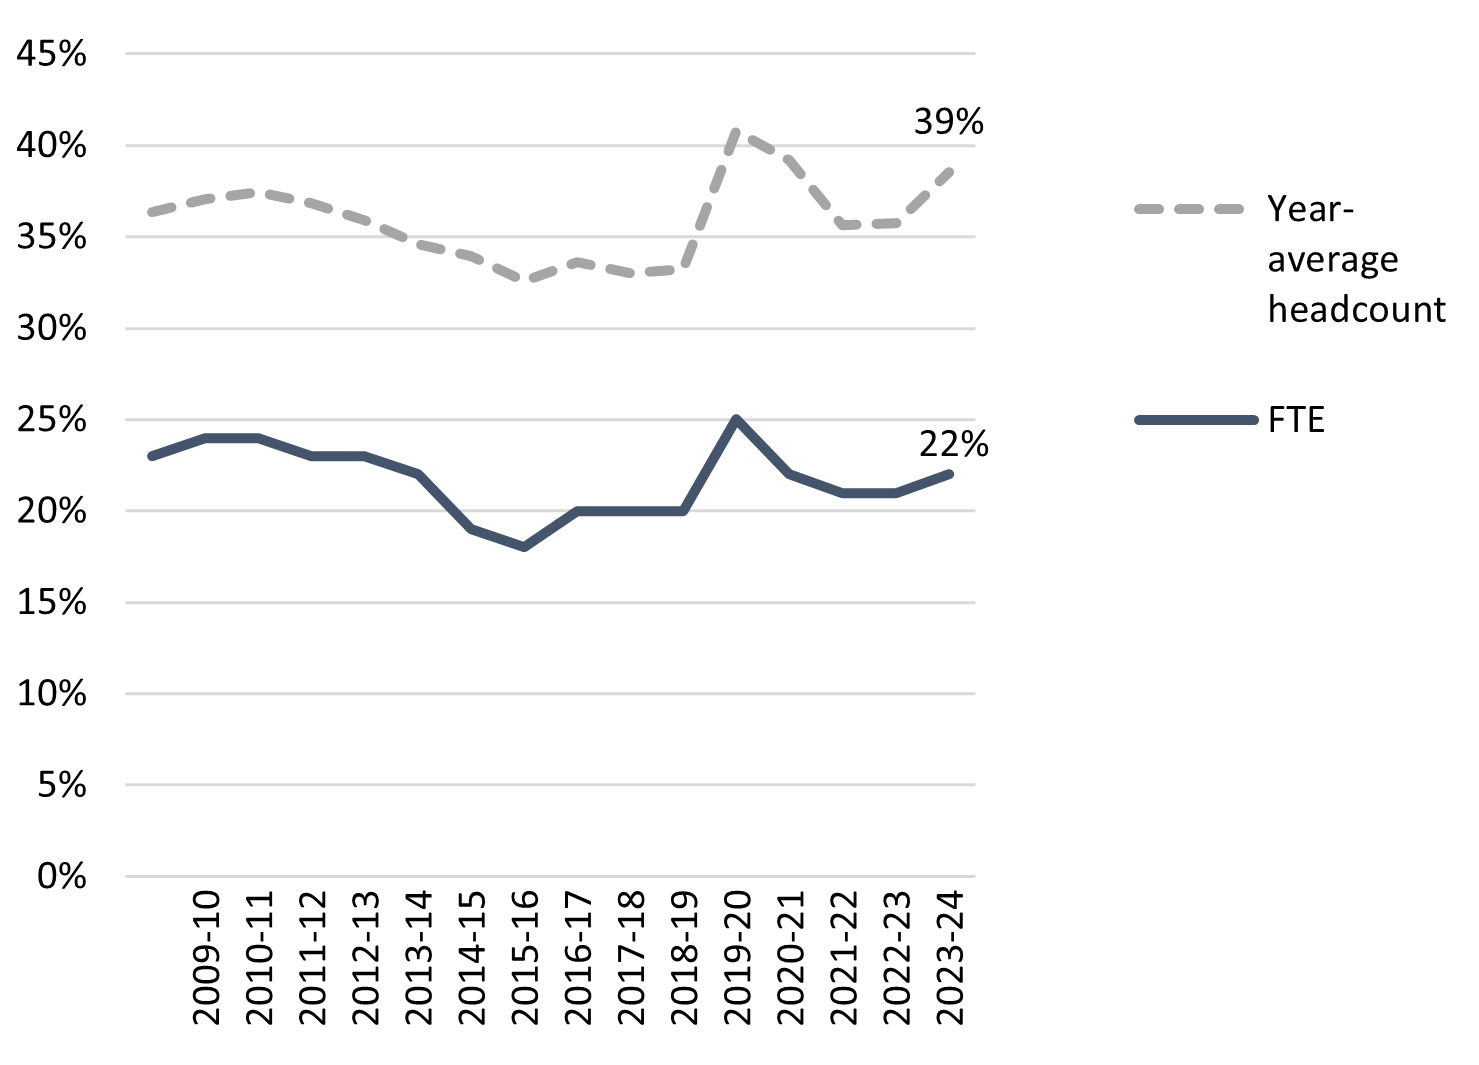
Source: Budget Analysis and Planning
For this indicator Summer is counted as a trailing term: e.g., the 2023-24 year includes summer 2024.
UC doctoral students credit their doctoral programs with having strengthened multiple skill sets, including research, teamwork, and understanding other perspectives.
8.2.1 Preparation by skillset, Universitywide, 2018 and 2019 combined
UC doctoral experience survey dashboard
How well prepared do you feel you are in the following skillsets?
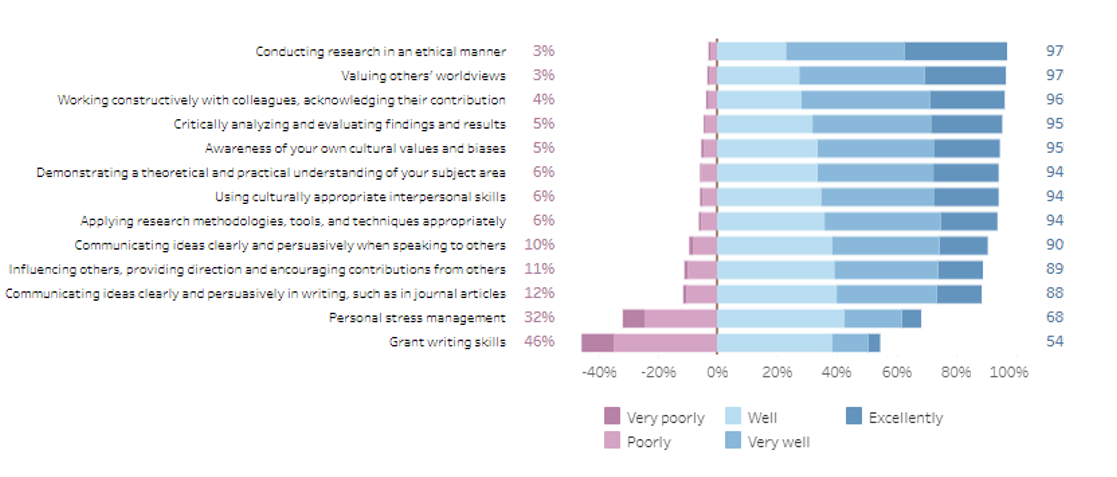
The Ph.D. Career Pathways Student Survey, a collaboration between the University of California and the Council of Graduate Schools, was administered in the spring 2018 and 2019 terms. The 2020 administration did not include items about skillset.
The UC student-faculty ratio is almost 22 to 1, as faculty hiring has not kept pace with increasing student enrollment.
8.3.1 General campus student-faculty ratio, Universitywide
Student faculty ratio dashboard
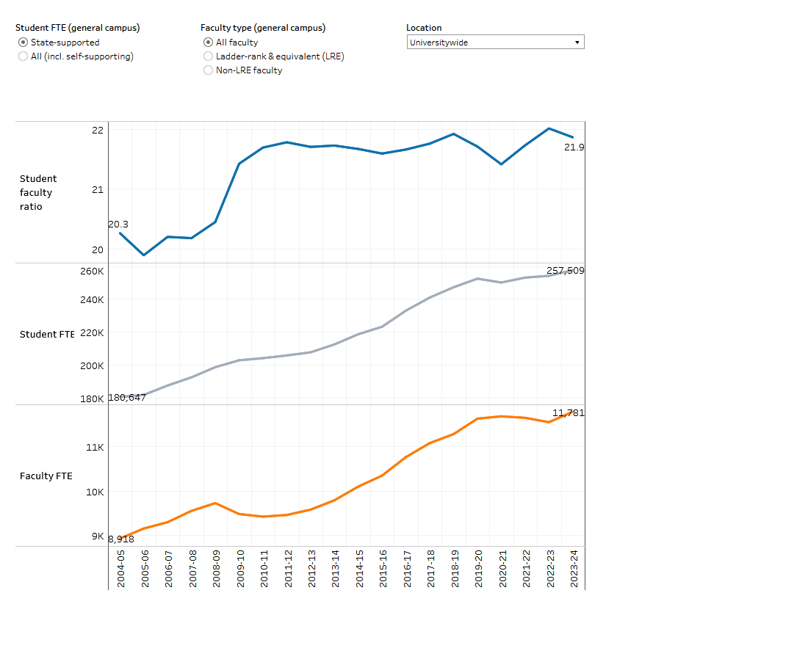
One measure of academic quality is the student-faculty ratio, which reflects resources available for instruction and the average availability of faculty members to every student. Thus, lower ratios are preferable for students.
Because the student-faculty ratio varies considerably by degree, major, and instructional level (lower-division, upper-division, and graduate), student experiences will vary as well. Indicators 8.3.2 and 8.3.3 on student credit hours (SCH) provide additional insight into the student experience.
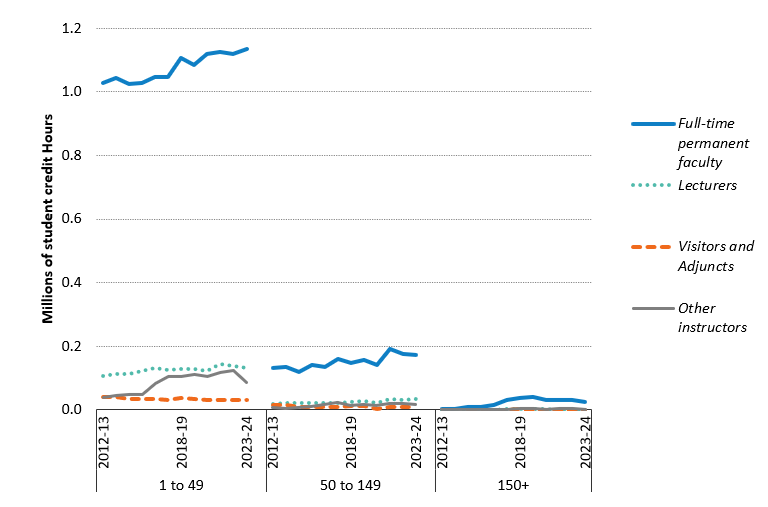
Overall, a larger number of student credit hours are performed by full-time permanent faculty who are leading scholars in their disciplines.
8.3.2 Student credit hours, by instructional staff and class size Universitywide 2012–13 to 2023–24
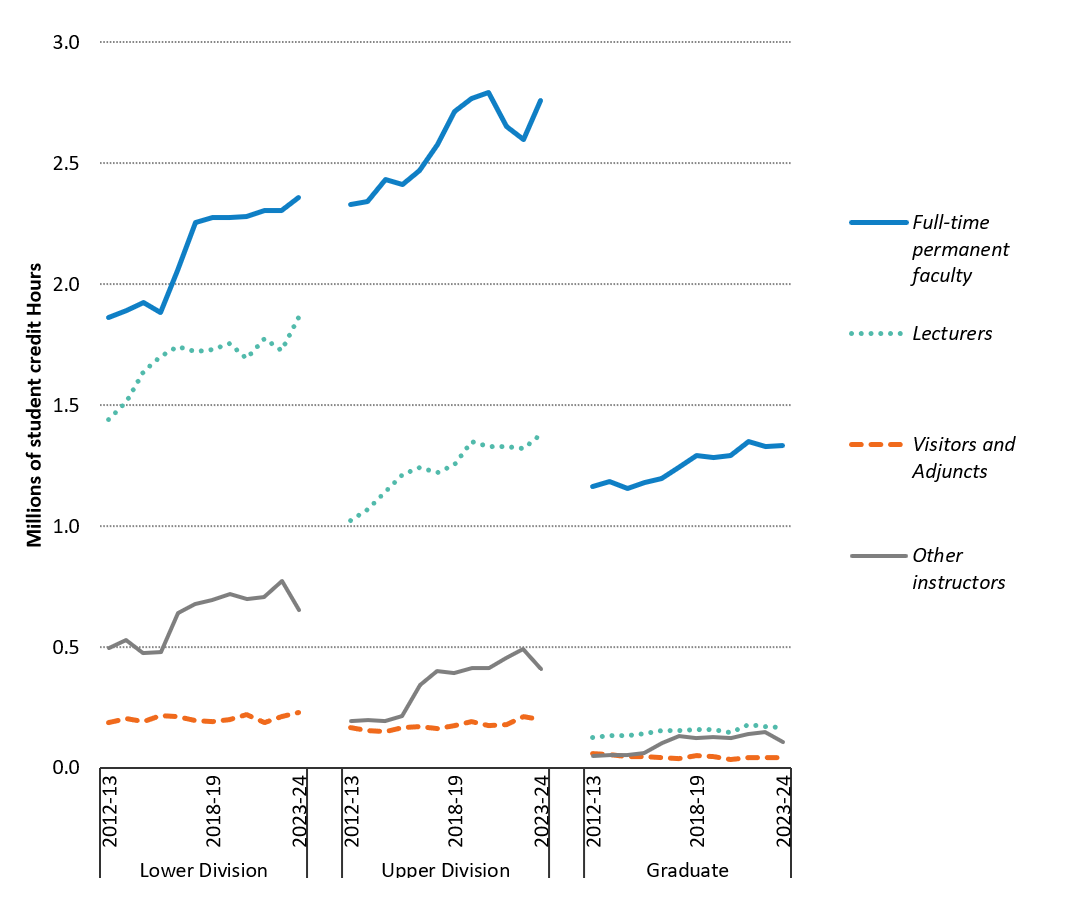
Source: UC Faculty Instructional Activities dataset
Student credit hours (SCH) represent the number of student enrollments in a course multiplied by the number of credits earned from that course. For example, a four-credit class with 50 students generates 200 SCH; a two-credit class of 15 students generates 30 SCH. This measure gives an indication of the relative teaching load across different types of instructors at different levels of instruction.
Lower-division courses such as writing, language, and other required courses are most often taught by lecturers; introductory courses to the major are most often taught by full-time permanent faculty. Upper-division courses, which are core to the student’s major, are more likely taught by full-time permanent faculty, as are graduate courses. For 2023-24, UC San Diego updated their categorization method, resulting in fewer instructors in the Other instructors category and more instructors in the Full-time permanent faculty and Lecturers categories. The changes to UC San Diego’s categorization method for 2023-24 are also reflected in indicator 8.3.3. below.
Data are for general campus courses only. These data are submitted annually by UC campuses and contain information on all general campus courses taught in that year.
As students enroll in upper-division and graduate classes, they have greater contact with full-time permanent faculty and smaller classes.
8.3.3 Student credit hours, by instructional staff and class type and class size, Universitywide, 2012–13 to 2023–24
Lower-division classes (scale 0–1.8m)
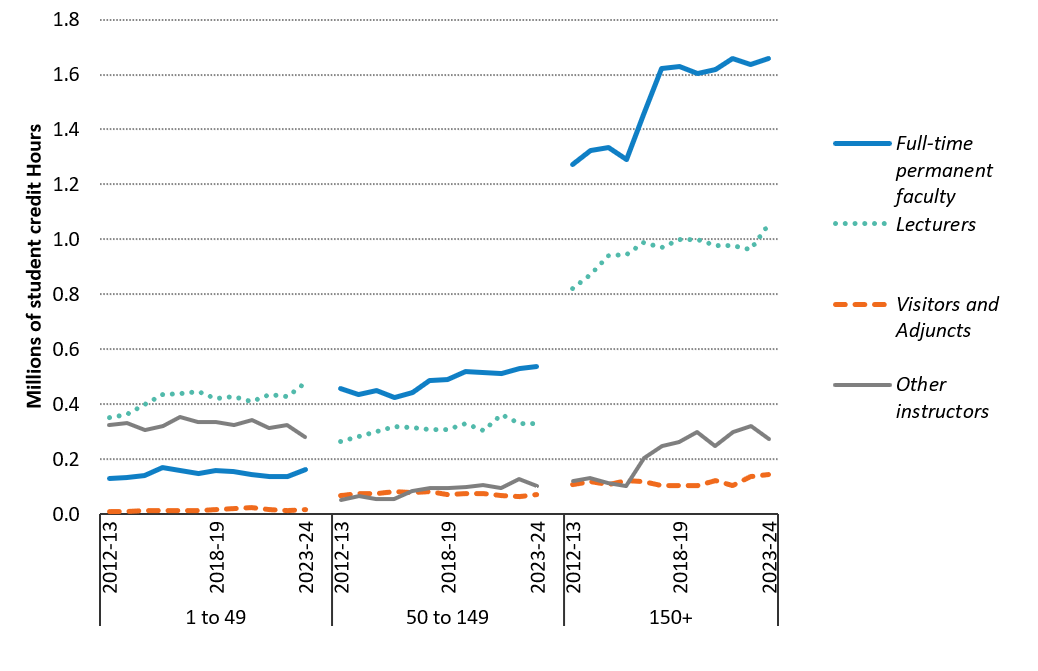
Upper-division classes (scale 0–1.4m)
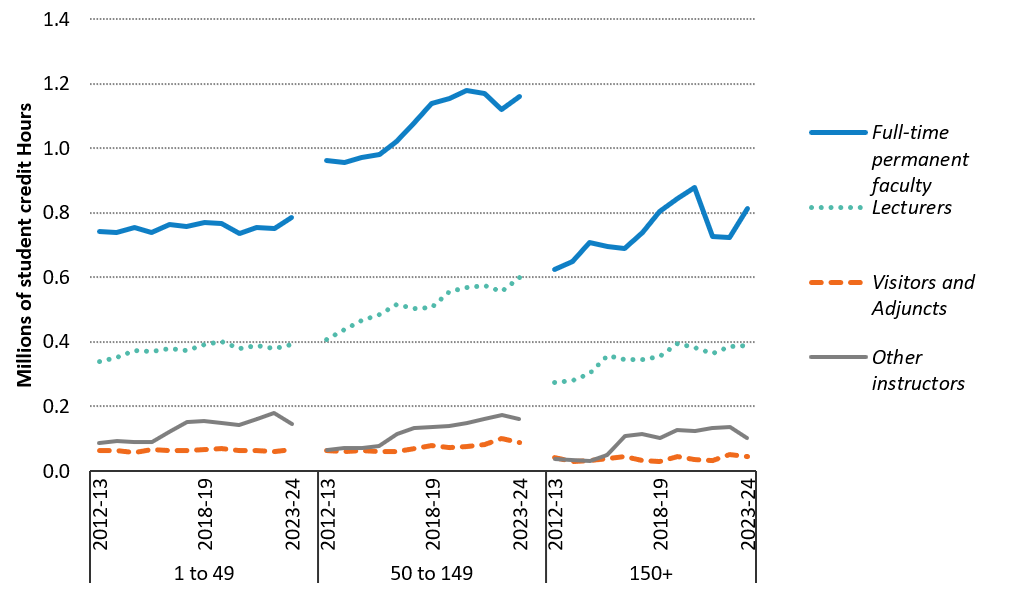
Graduate classes (scale 0–1.2m)
Source: UC Faculty Instructional Activities dataset