As the novel coronavirus began to spread, teams across University of California knew that the need to translate scientific discovery into therapies and vaccines to fight COVID-19 would be urgent. At the same time, the growing pandemic highlighted widespread inequalities in health and the urgency of achieving greater health equity.
UC’s five Clinical and Translational Science Award (CTSA) teams were already positioned to address needs at the intersection of COVID-19 and health equity, but the process of securing funding for research and community outreach programs often can be slow. UC Biomedical Research Acceleration, Innovation and Development (UC BRAID) took action to support immediate projects by creating a grant program to enable UC CTSAs to quickly respond to the need for COVID-19 related clinical trials and vaccination efforts that are inclusive and benefit vulnerable communities.
Dr. Carrie L. Byington, Executive Vice President, University of California Health, and an infectious disease expert, opines, “The inequality in health across our state and nation is now even more apparent as we see the disproportionate impact of COVID-19 in communities of color and lower socioeconomic areas. The problems leading to health disparities will take years to address. In the short term, we must start working toward better diversity in the clinical trials that translate the wealth of scientific research in our state and nation into benefits for all. The UC BRAID grants have helped create momentum for addressing these issues.”
Overview
UC requires significant resources and planning to support its instruction, research, and public service missions. The indicators in this chapter provide insight into the financial health of the University, the state of capital and space resources, and the environmental sustainability of campus operations. This chapter now also includes information on the UC Community Safety Plan, which re-envisions safety at the University of California locations.
Financial trends
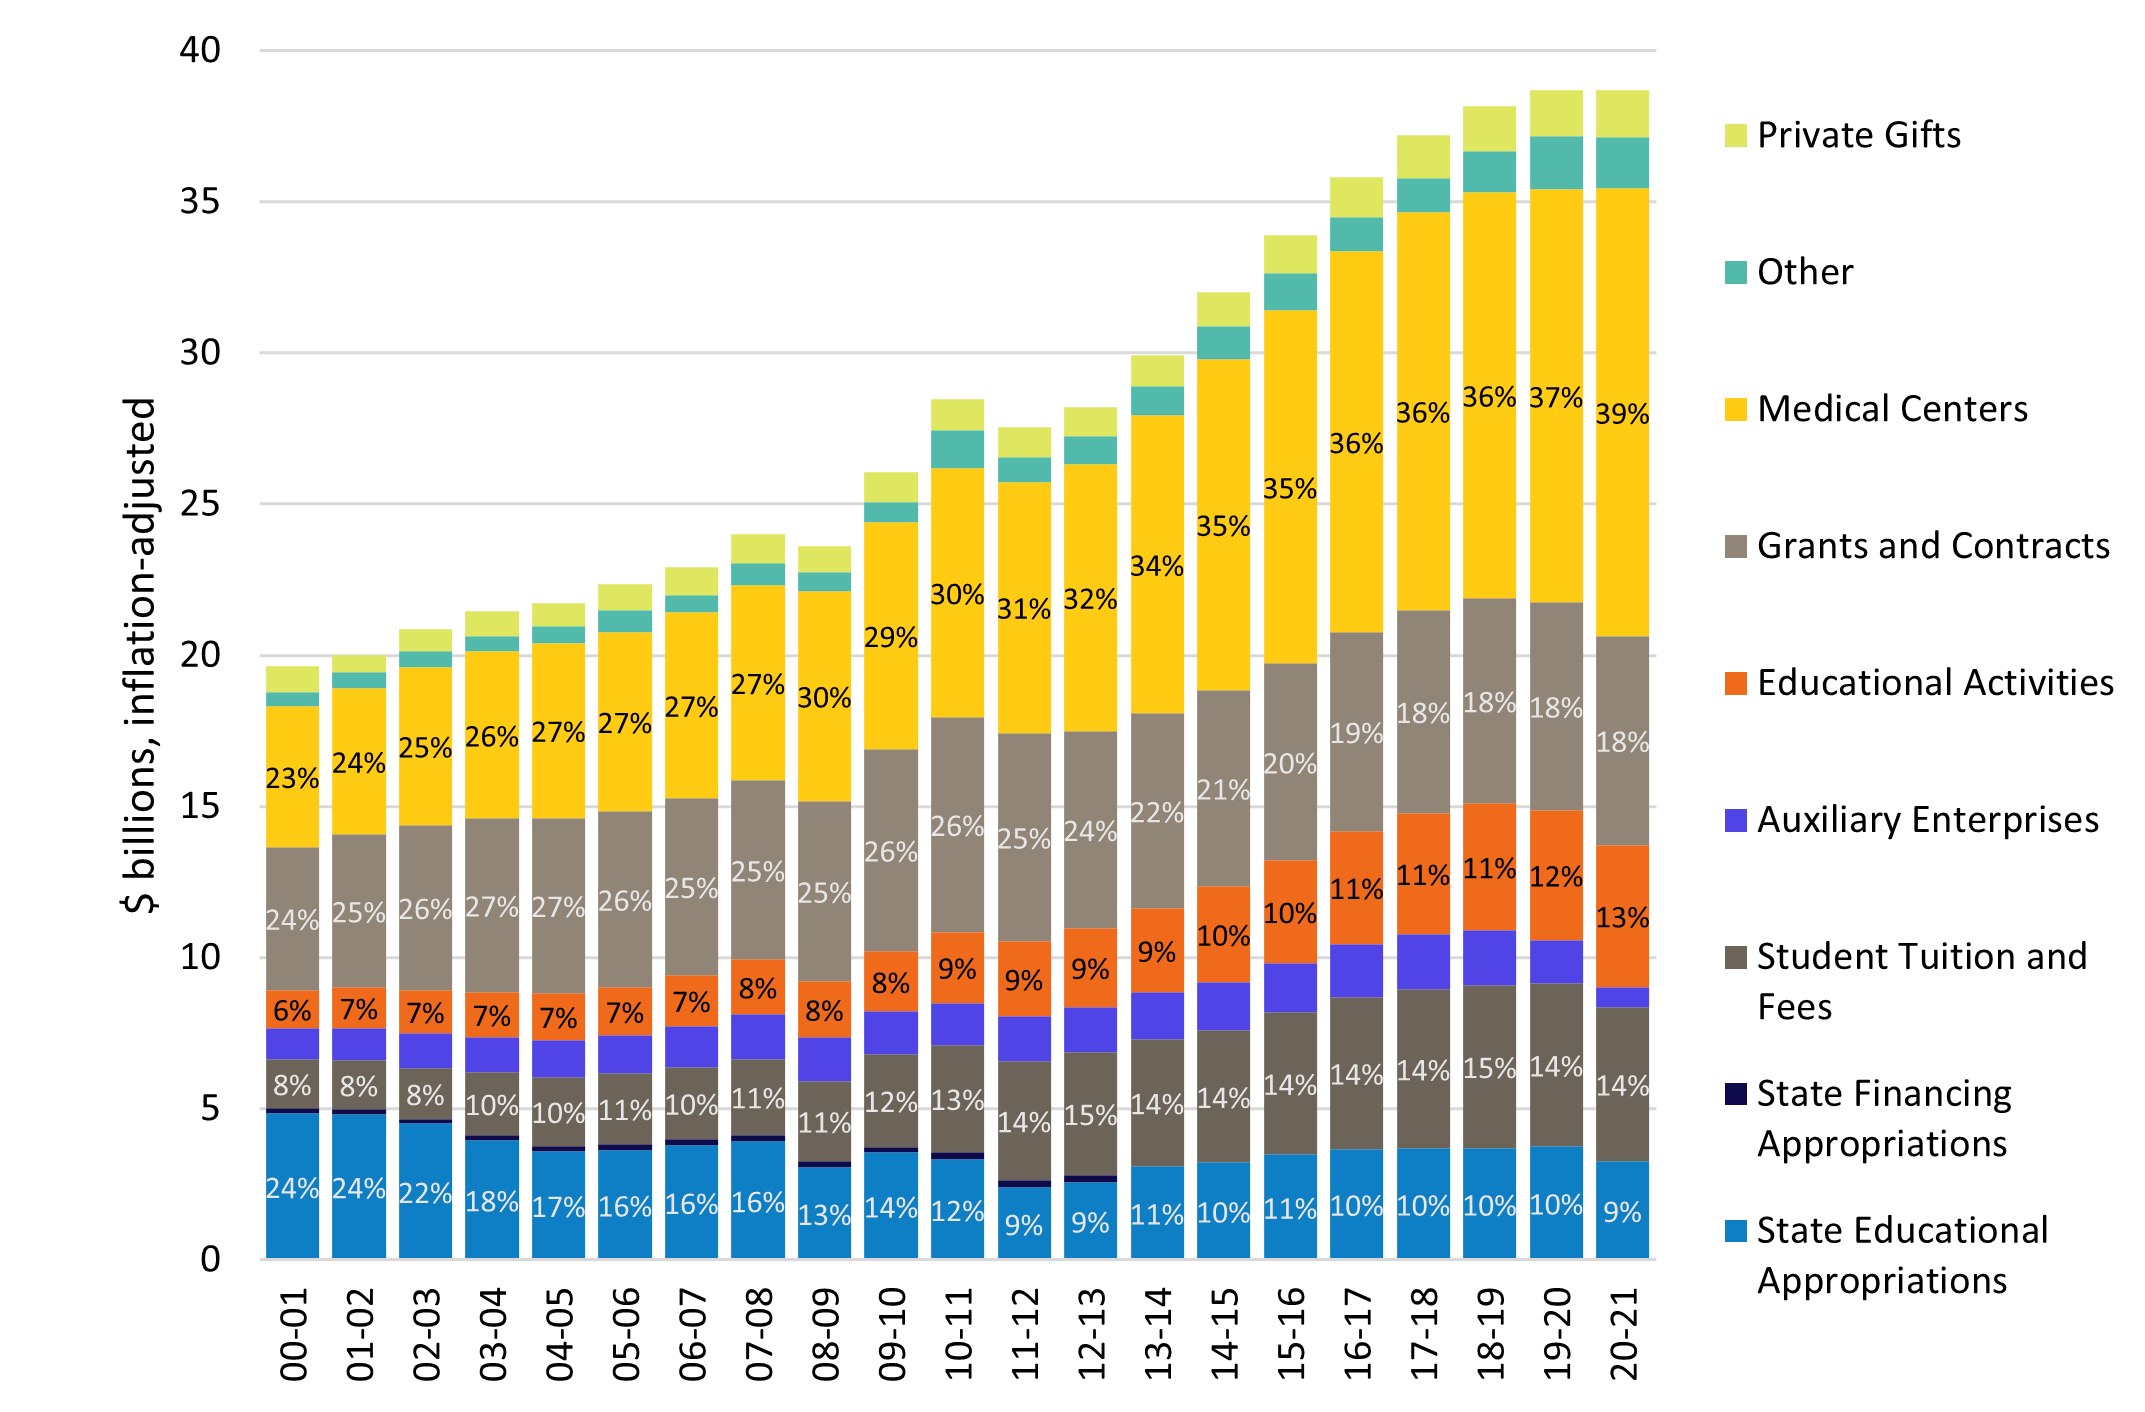
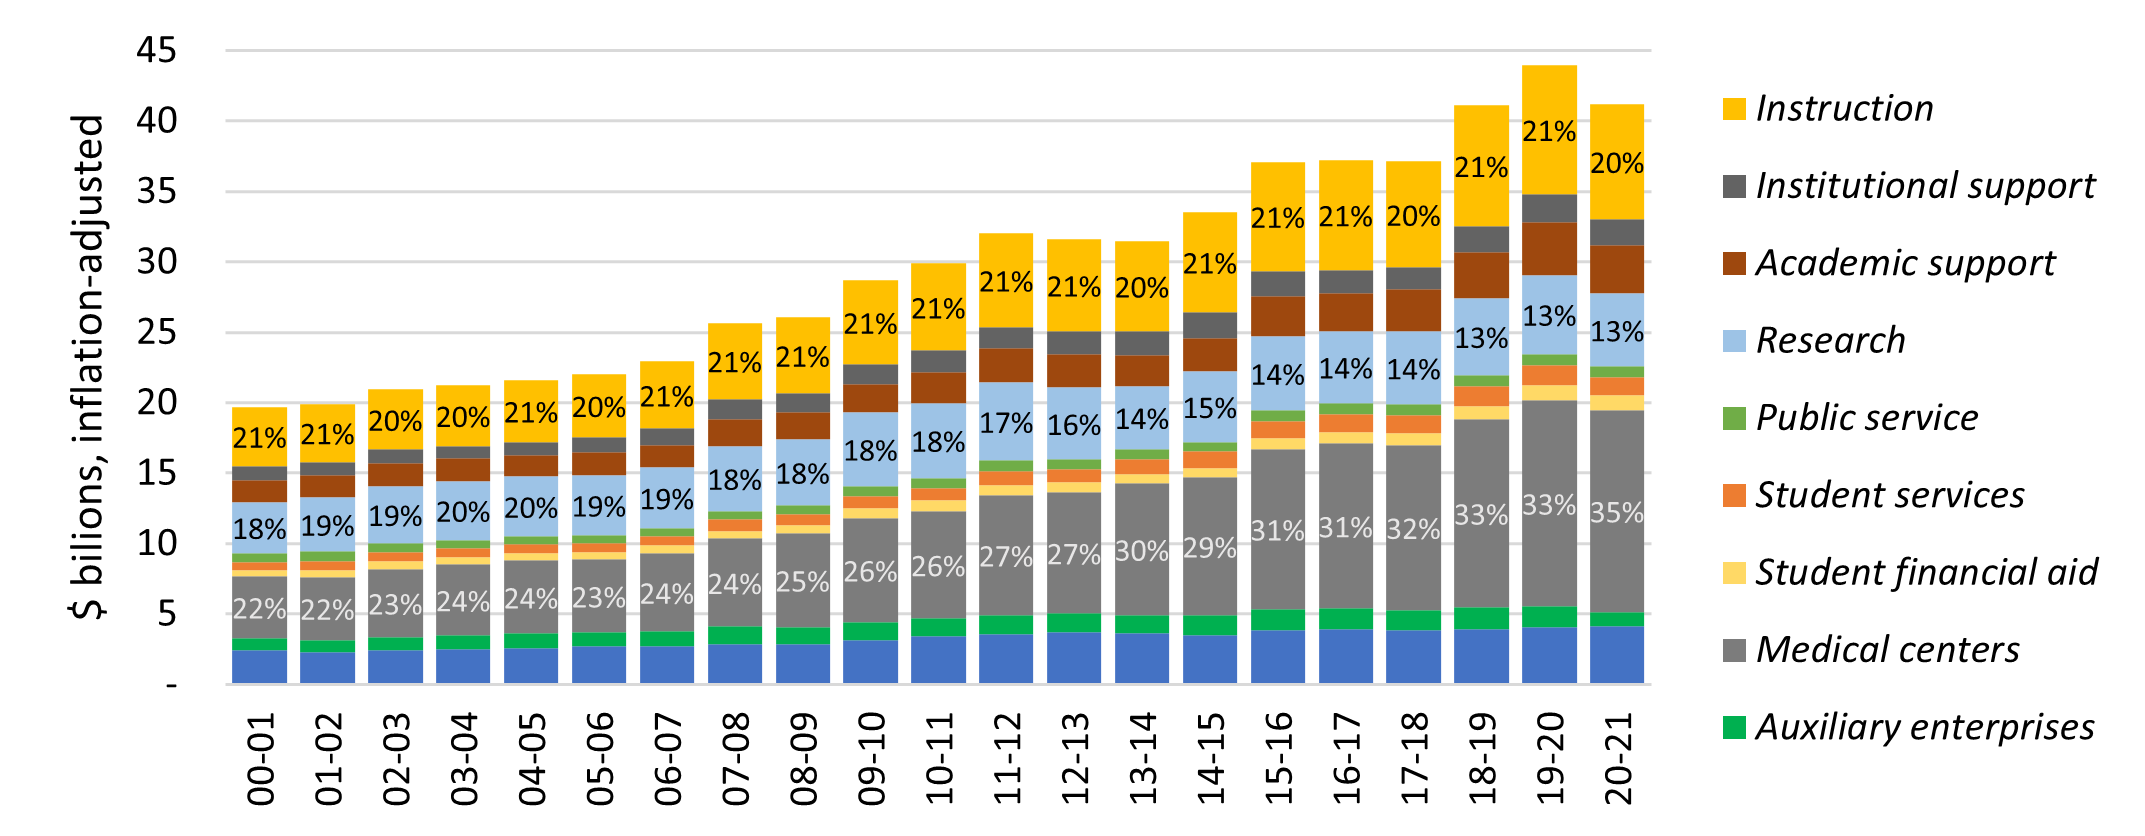
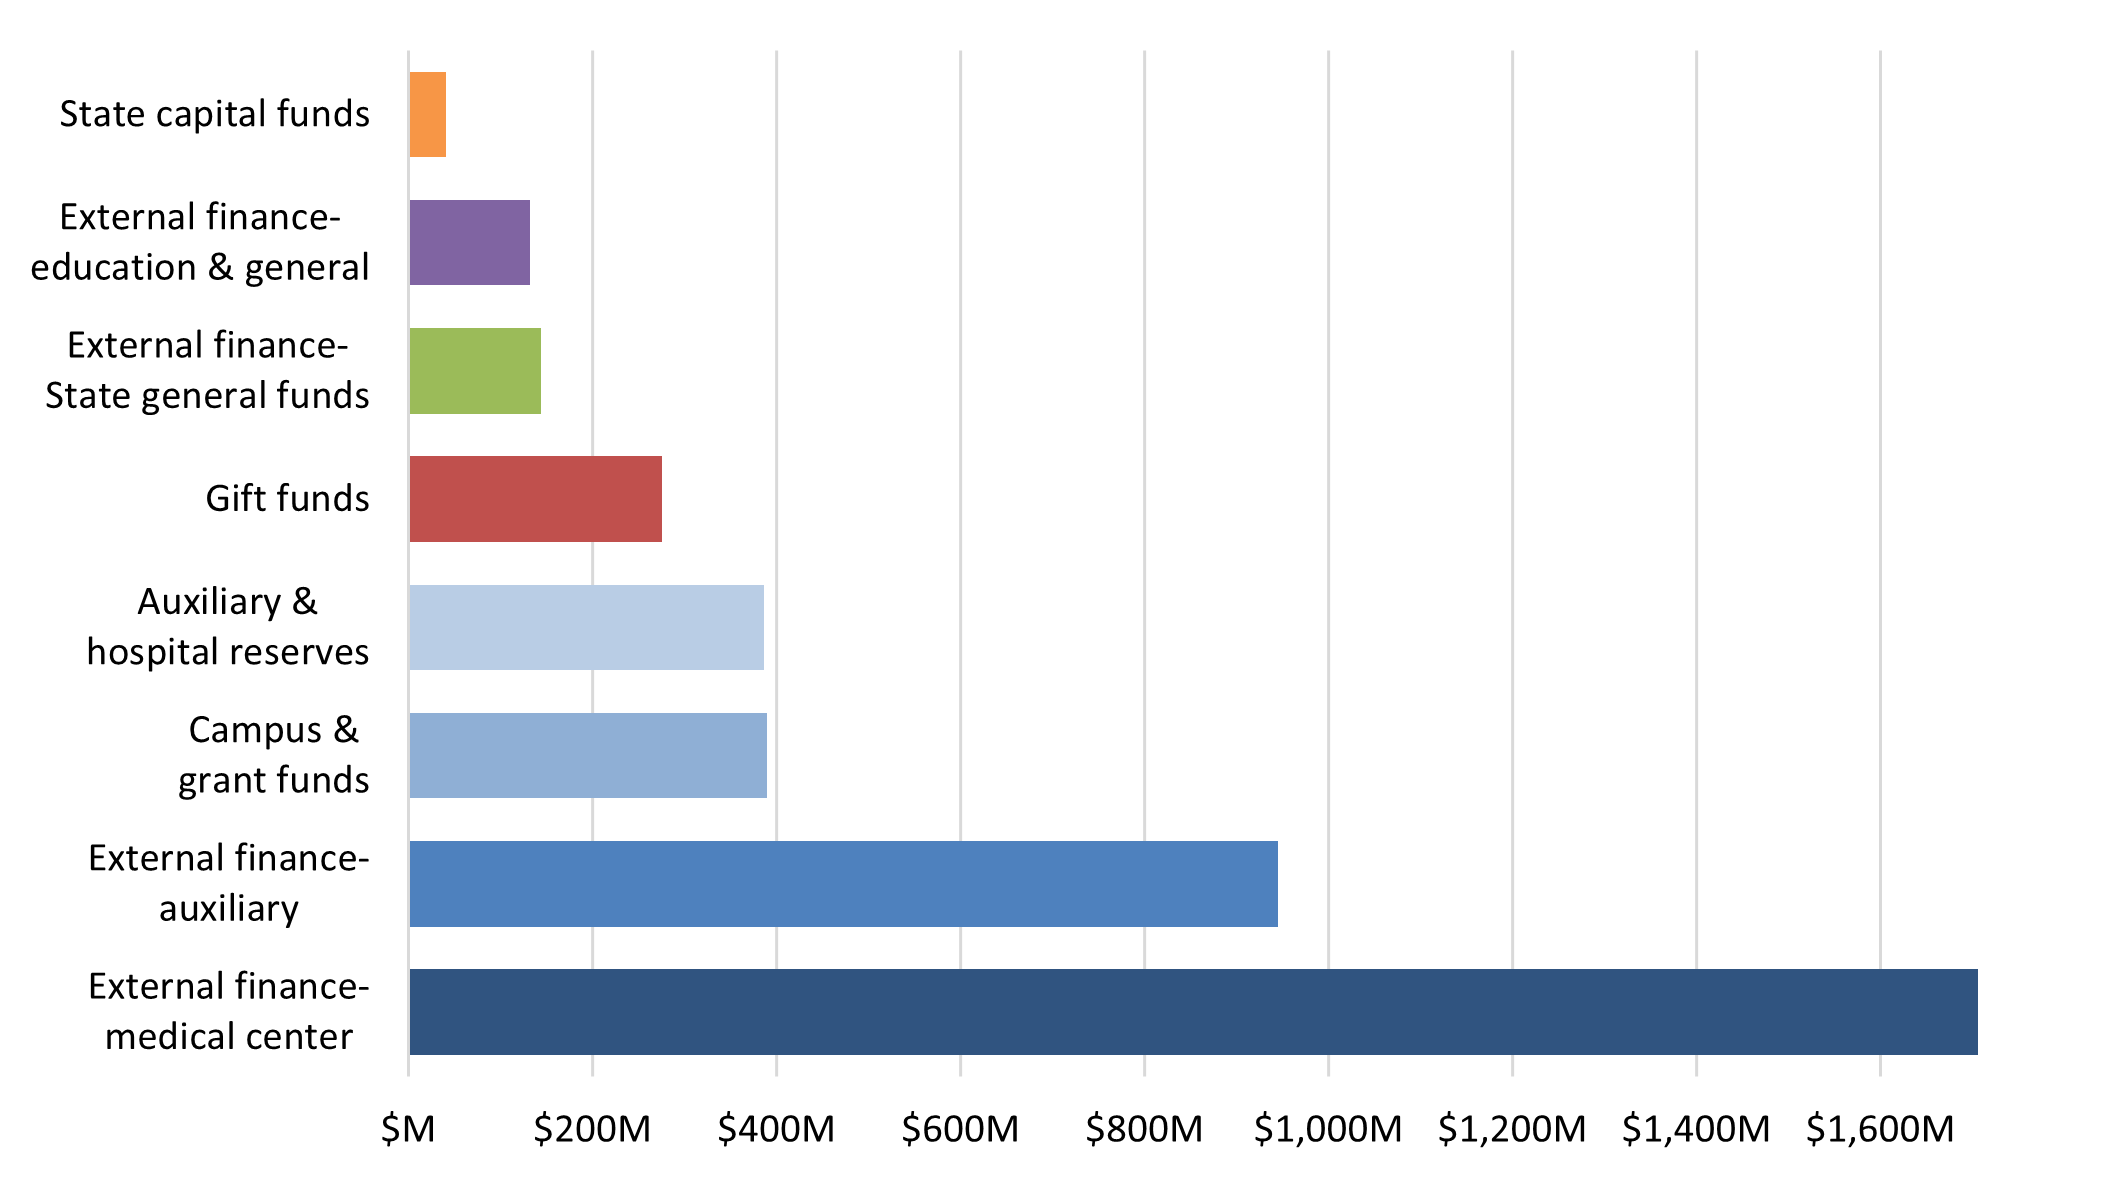
The University’s revenues, totaling over $41.6 billion in 2020–21 (excluding Department of Energy laboratories), fund its core mission and a wide range of support activities. Over one-third comes from the five UC medical centers, which have collectively nearly doubled in size in the past decade. Contracts and grants, which help sustain the University’s research mission and reflect UC’s preeminence in research, are the next largest source of funds.
The impact of the COVID-19 pandemic through fiscal year 2020-21 resulted in large revenue losses across various areas of the University. Reductions in services such as nonessential patient care, housing and dining, and other auxiliary functions, including student refunds for cancelled contracts, resulted in revenue losses of about $2.28 billion as of June 30, 2021. As of that date, these losses were partially offset by Higher Education Emergency Relief Funds (HEERF) I - III — Coronavirus Aid, Relief, and Economic Security Act (HEERF I), Coronavirus Response and Relief Supplemental Appropriations Act (HEERF II), and American Rescue Plan (HEERF III) — totaling $753 million in institutional portion federal funding intended to help with costs associated with the pandemic such as facilities cleaning, COVID patient care, and remote instruction. The University also received an additional $605 million in HEERF I-III funding restricted for emergency student financial support.
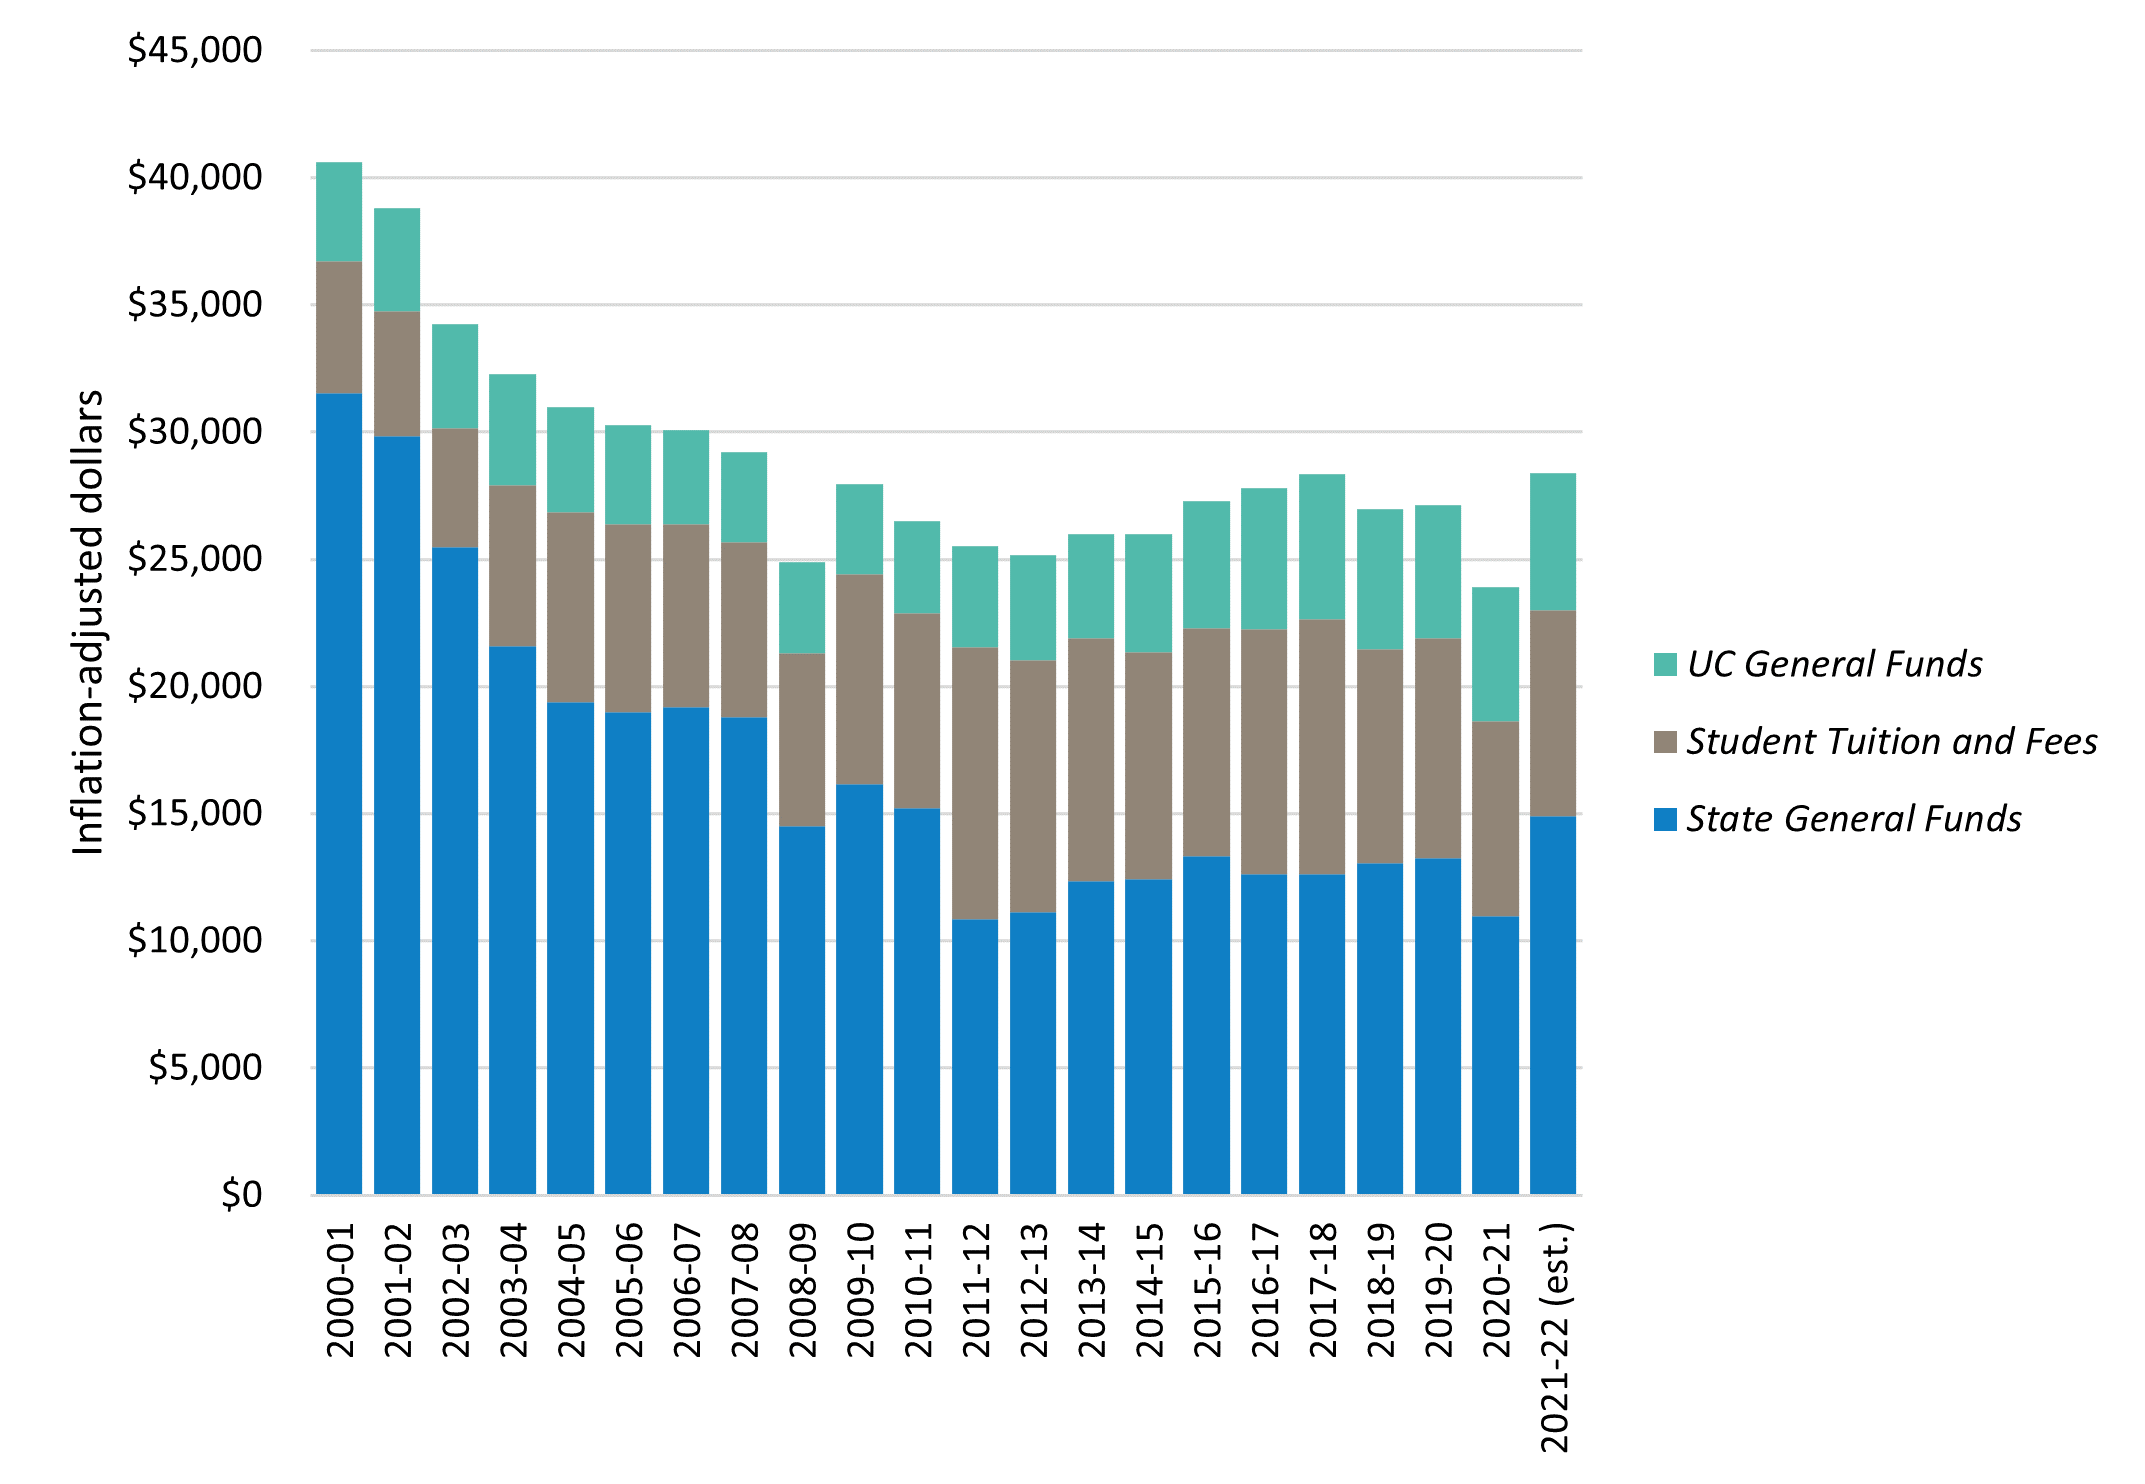
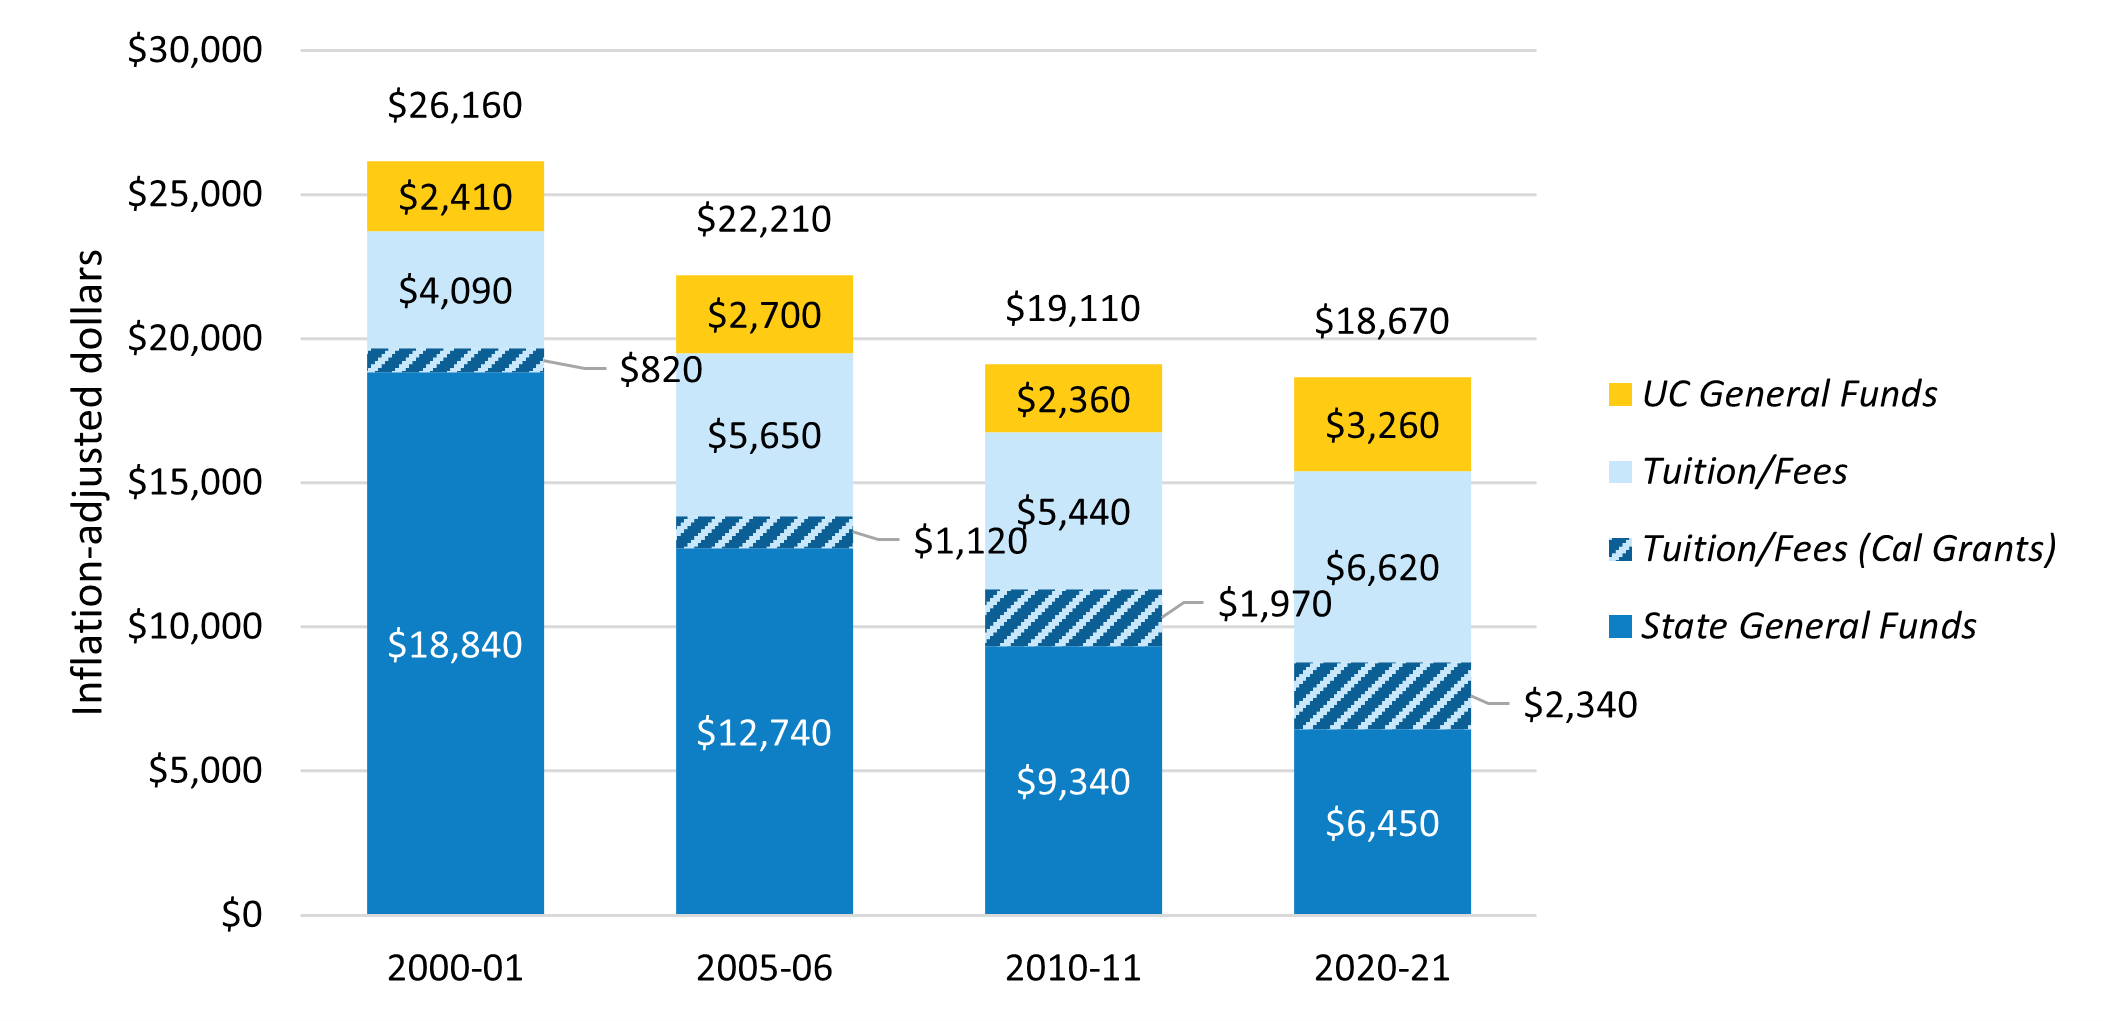
State General Funds, tuition and fees, and UC General Funds make up the core revenues for the University’s instructional mission. State funds were historically the largest single source of support for instruction; however, cuts in State funding over the past two decades reduced this resource. State educational appropriations are less today in inflation-adjusted dollars than they were in 2006–07 and over $1 billion less than what they were in 2000–01, despite substantial enrollment growth. In 2000–01, State funding for UC, including Cal Grants, contributed $19,660 per student —– 75% of the total cost. In 2020–21, the State share declined to $8,790, or 47% of the total cost. From 2000–01 to 2010–11, systemwide tuition and fees were increased to offset the impacts of reduced funding from the State, though financial aid increases made up for those increases for many UC students. In-state tuition at UC has remained flat for nine of the last ten years. Under these circumstances, the importance of alternative sources of funding, such as Nonresident Supplemental Tuition, has increased.
Prior to the COVID-19 pandemic, improvements in the California economy since 2012, combined with the passage of Proposition 30, had brought some stability to the State budget and thus to the University’s core budget. Modest increases in State support during times of fiscal stability have not been enough to both fully restore prior funding levels and keep pace with enrollment growth. In addition, the significant impact of the COVID-19 pandemic toward the end of the 2019–20 fiscal year resulted in State budget uncertainty for 2020–21 and 2021–22.
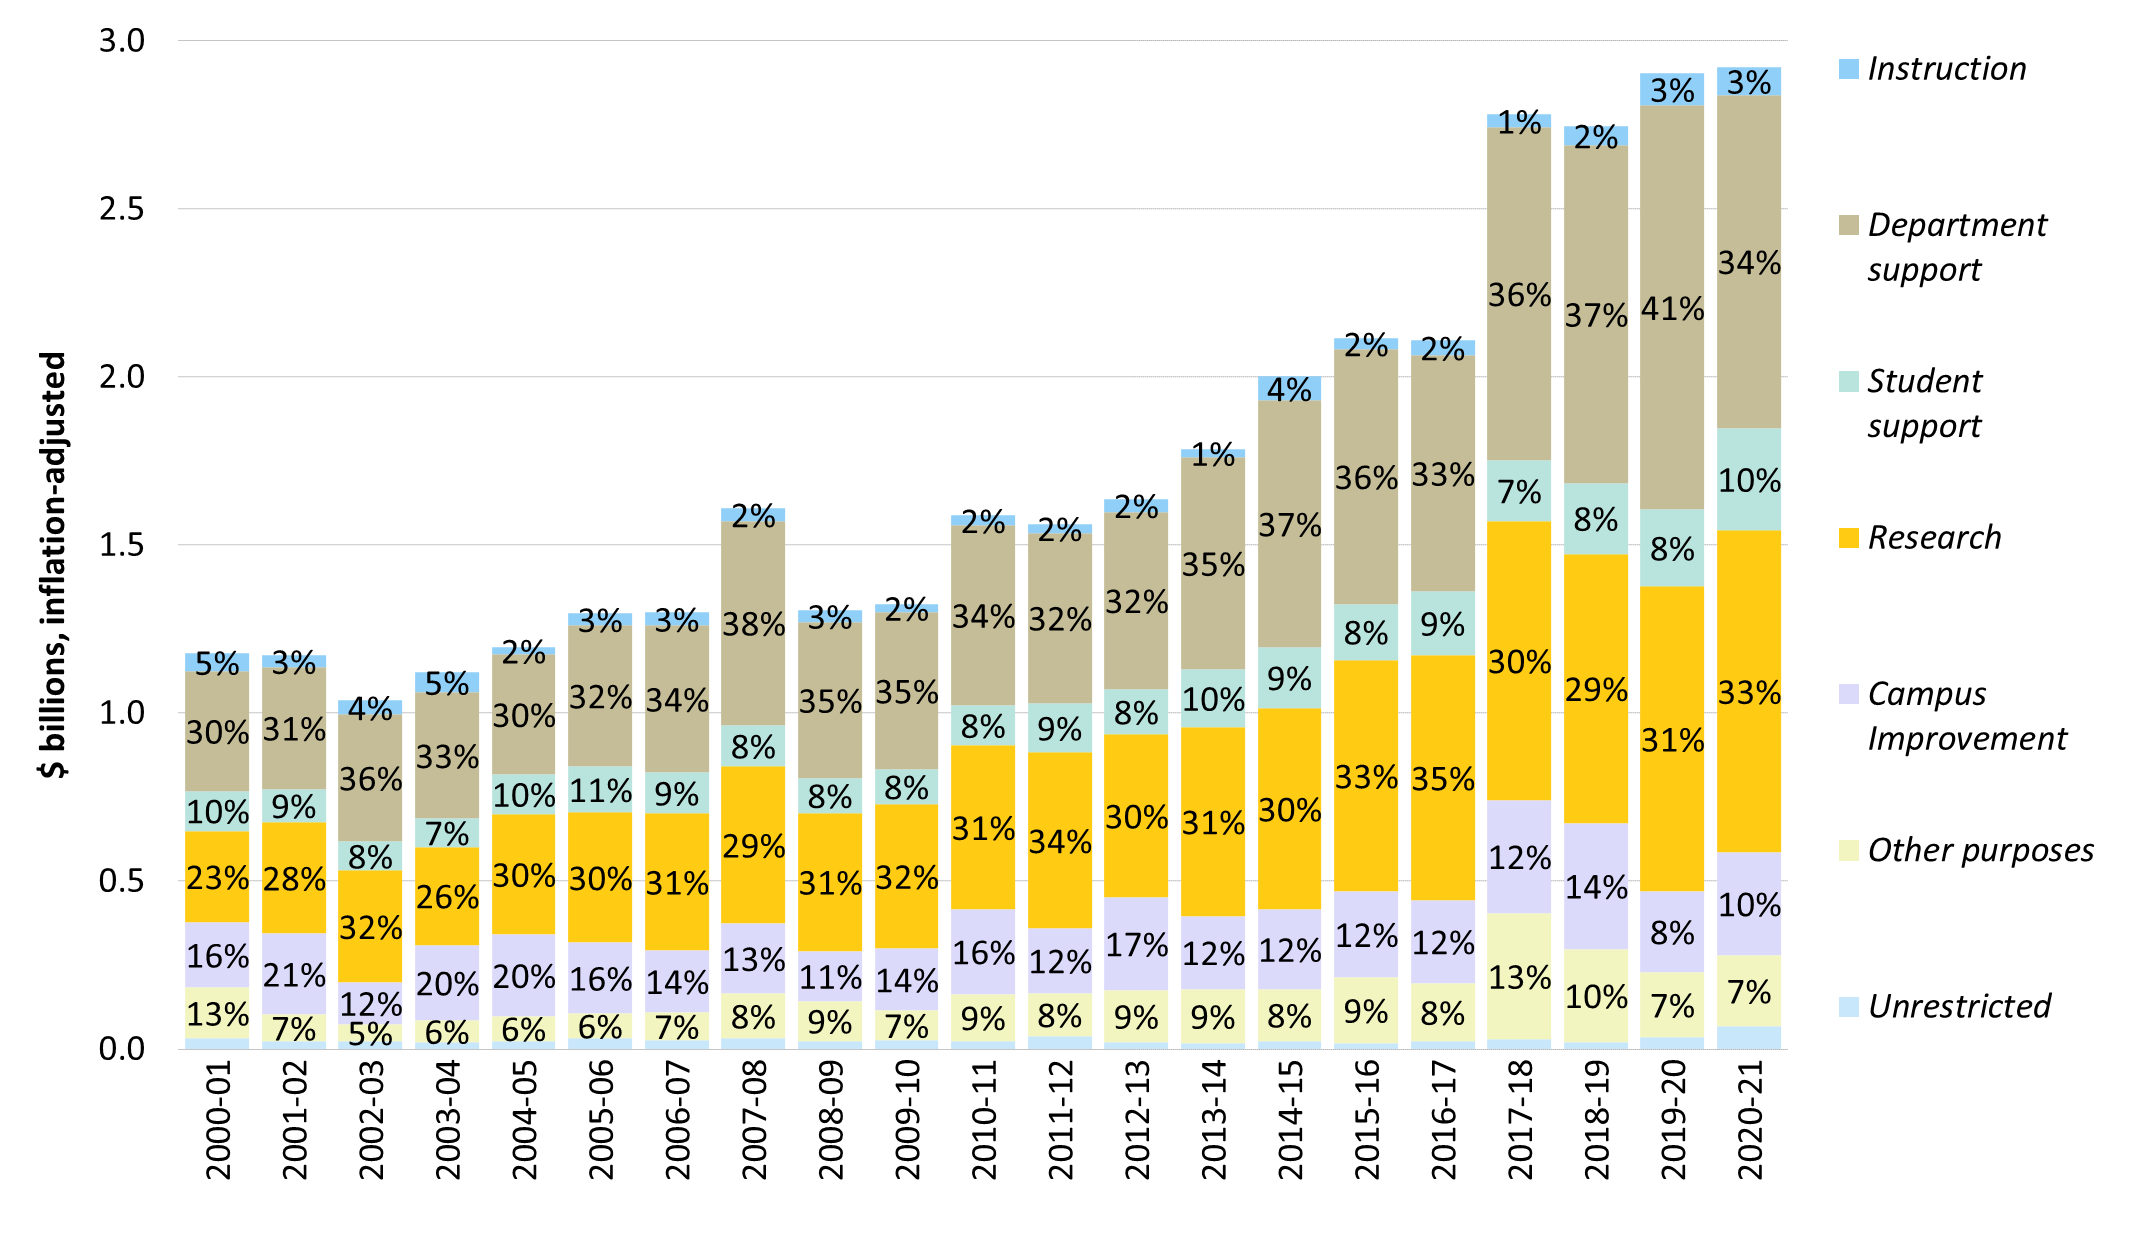
As core revenues per student have declined from $40,602 in 2000–01 to $23,895 in 2020–21, driven primarily by decreases in State General Funds on a per-student basis, the University has sought to increase revenues from other sources. Gift funds have become increasingly important. Private giving has increased; however, over 99 percent is restricted. Gift support tends to be for research, departmental support, and capital projects. The small amounts for instruction and student support cannot offset needs created by enrollment growth that has outpaced proportional growth in core revenues. Private giving varies significantly by campus and relates to the campus’ age, number of alumni, and the presence of health science programs.
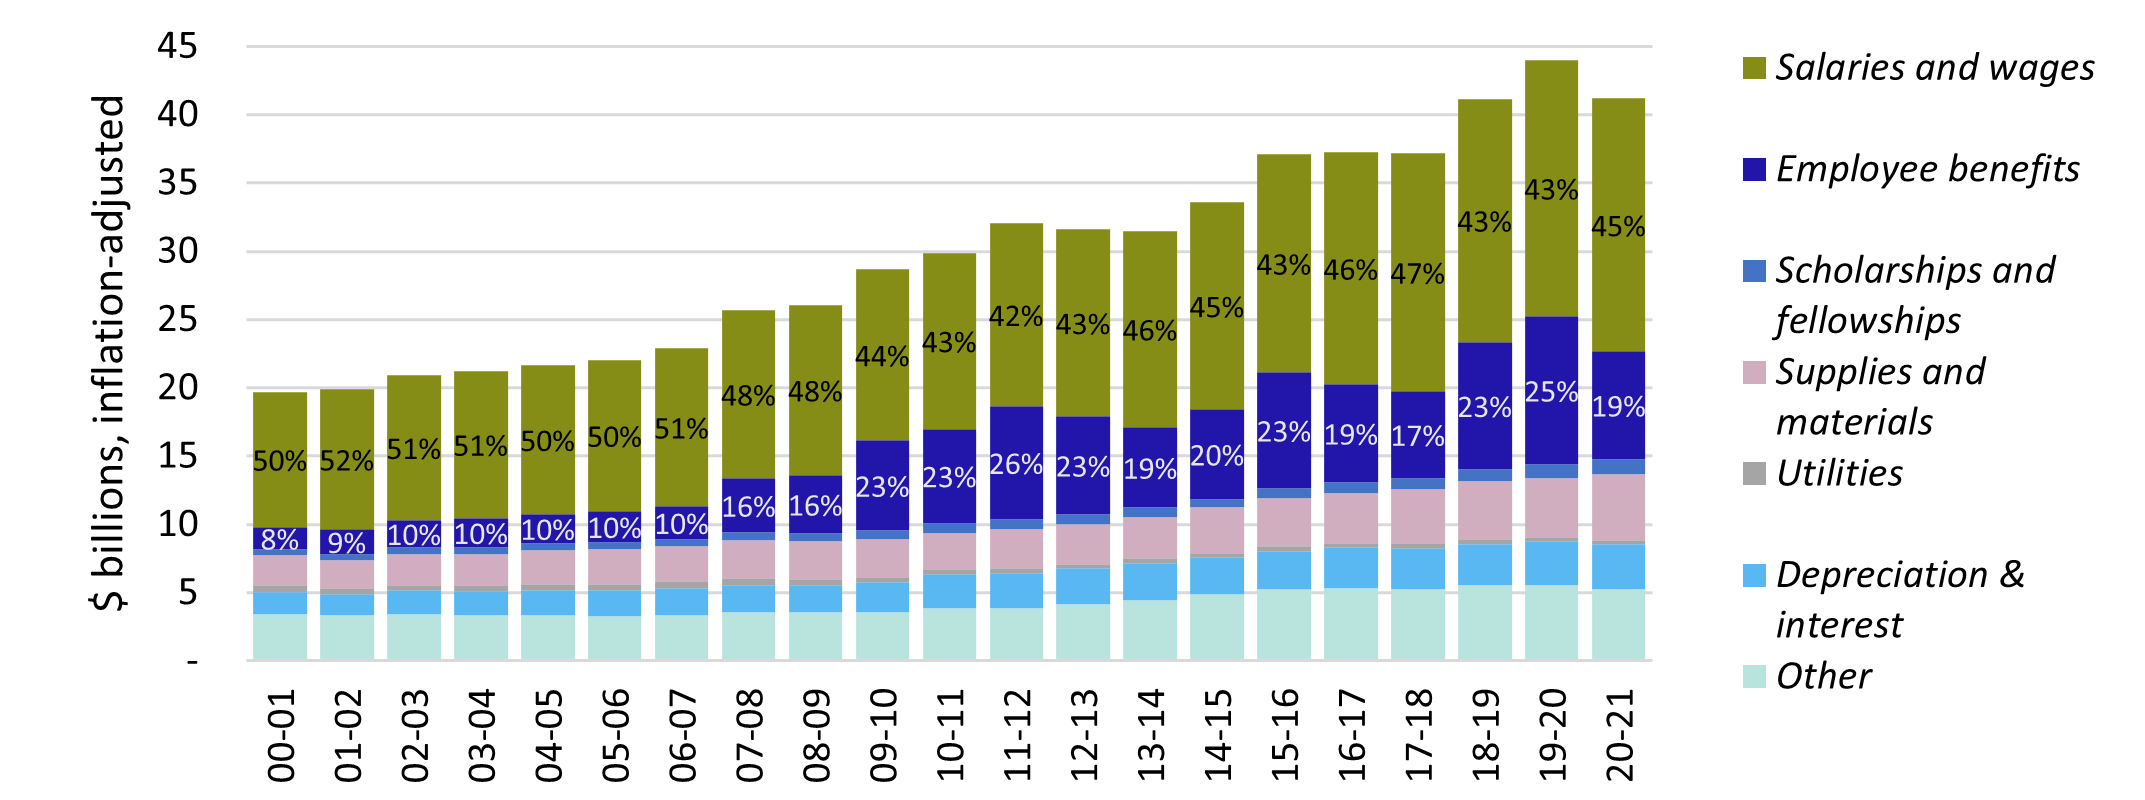
As is typical for universities, salaries and benefits for academic and support staff are the largest areas of expenditures. Although the inflation-adjusted expenditures for educating a student at UC have dropped by 29 percent since 2000, reflecting both operational efficiencies and reductions in available resources, the State’s share of this cost has fallen even more steeply. Consequently, students and their families now contribute a larger share through tuition and fees.
Chronic shortfalls in priority areas — graduate student support, faculty salaries, the ratio of students to faculty, capital renewal, the need to upgrade outdated information systems, and a focus on sustainability — present ongoing financial challenges.
Capital program and funding
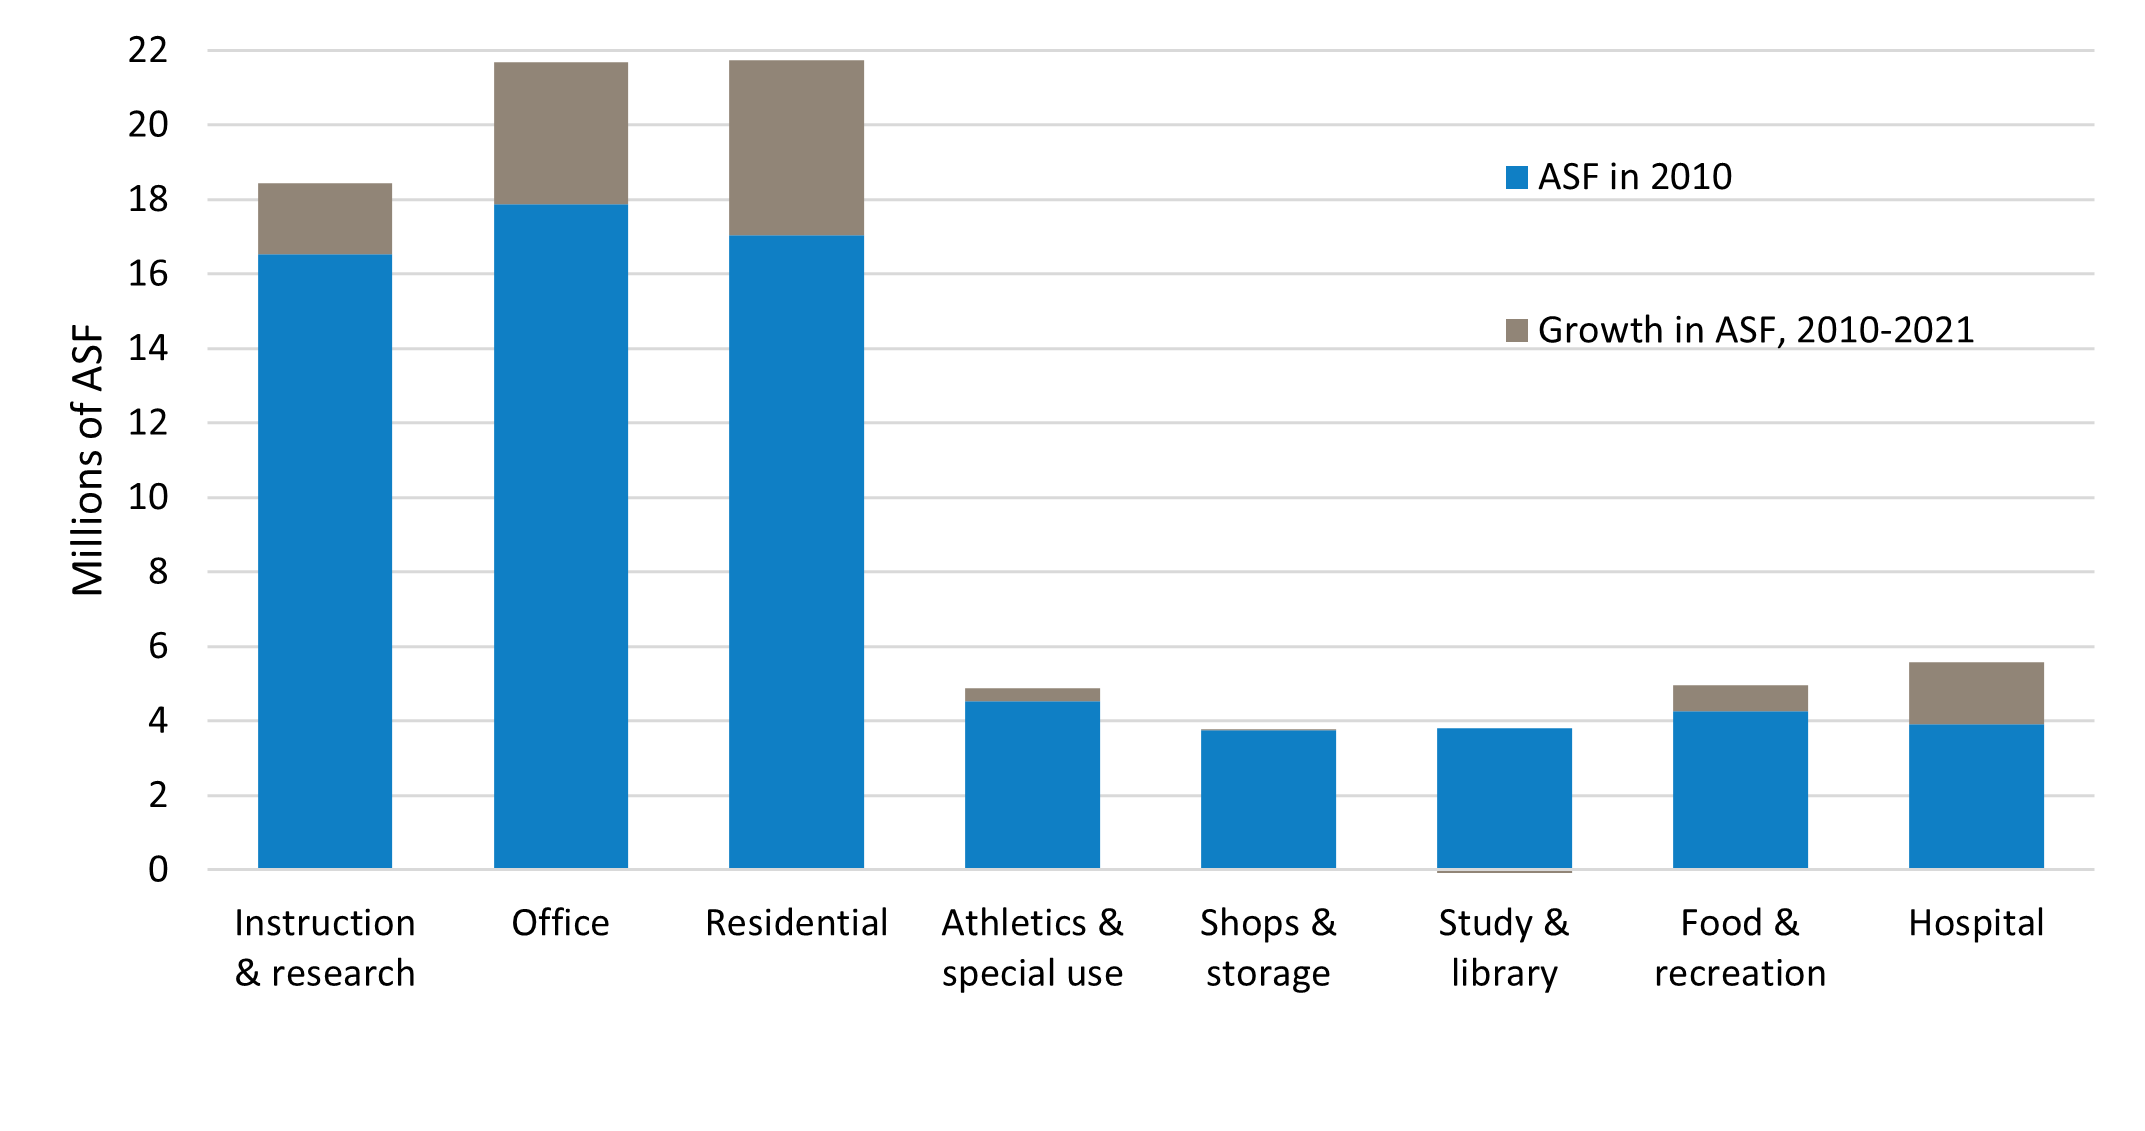
The University maintains approximately 6,000 buildings enclosing 146 million gross square feet on approximately 30,000 acres across its ten campuses, five medical centers, nine agricultural research and extension centers, and the Lawrence Berkeley National Laboratory. With such a substantial infrastructure, the University strives to be a good steward of the capital resources entrusted to its care.
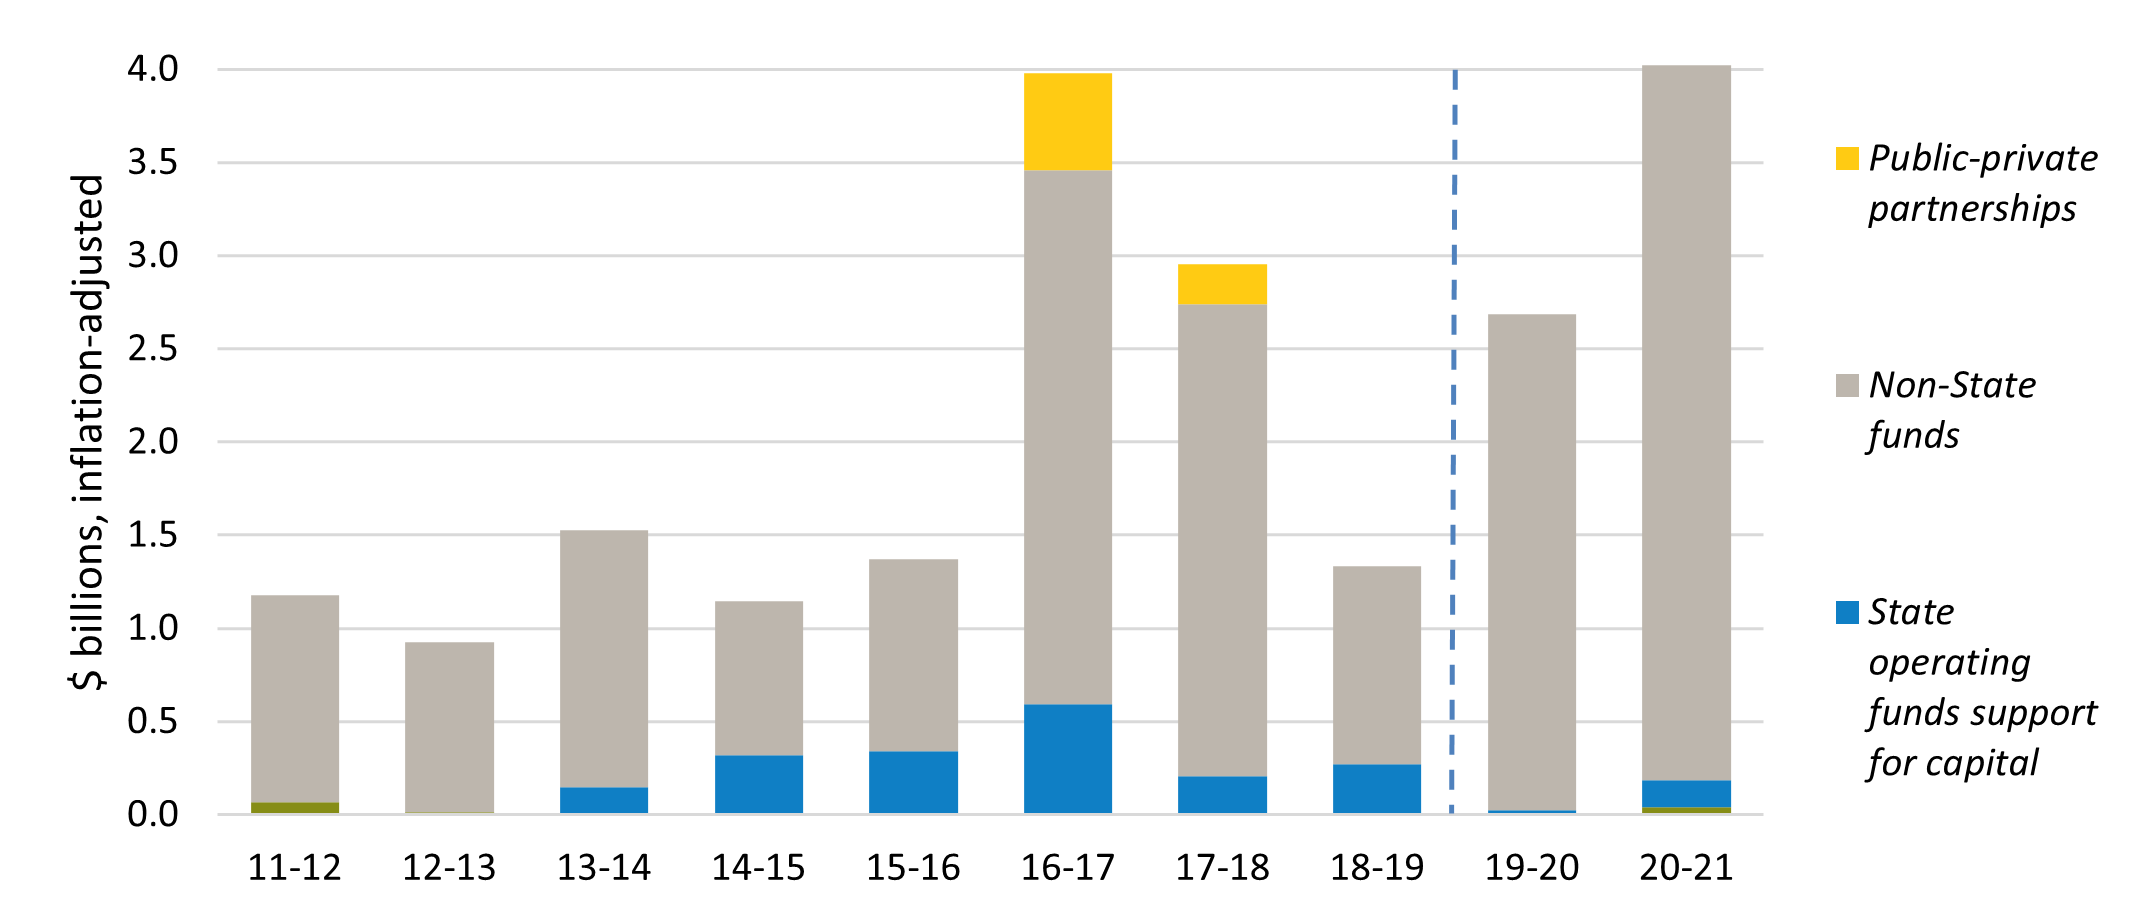
UC's capital program is funded by a combination of State and non-State funds. Historically, most of UC's core academic capital projects were funded by the State. With State funds playing a declining role over the past decade, the University has been forced to rely on other resources. In the past decade, non-State funds, including external financing that utilizes non-State sources to service the debt, have accounted for 80 percent of UC's capital program funding.
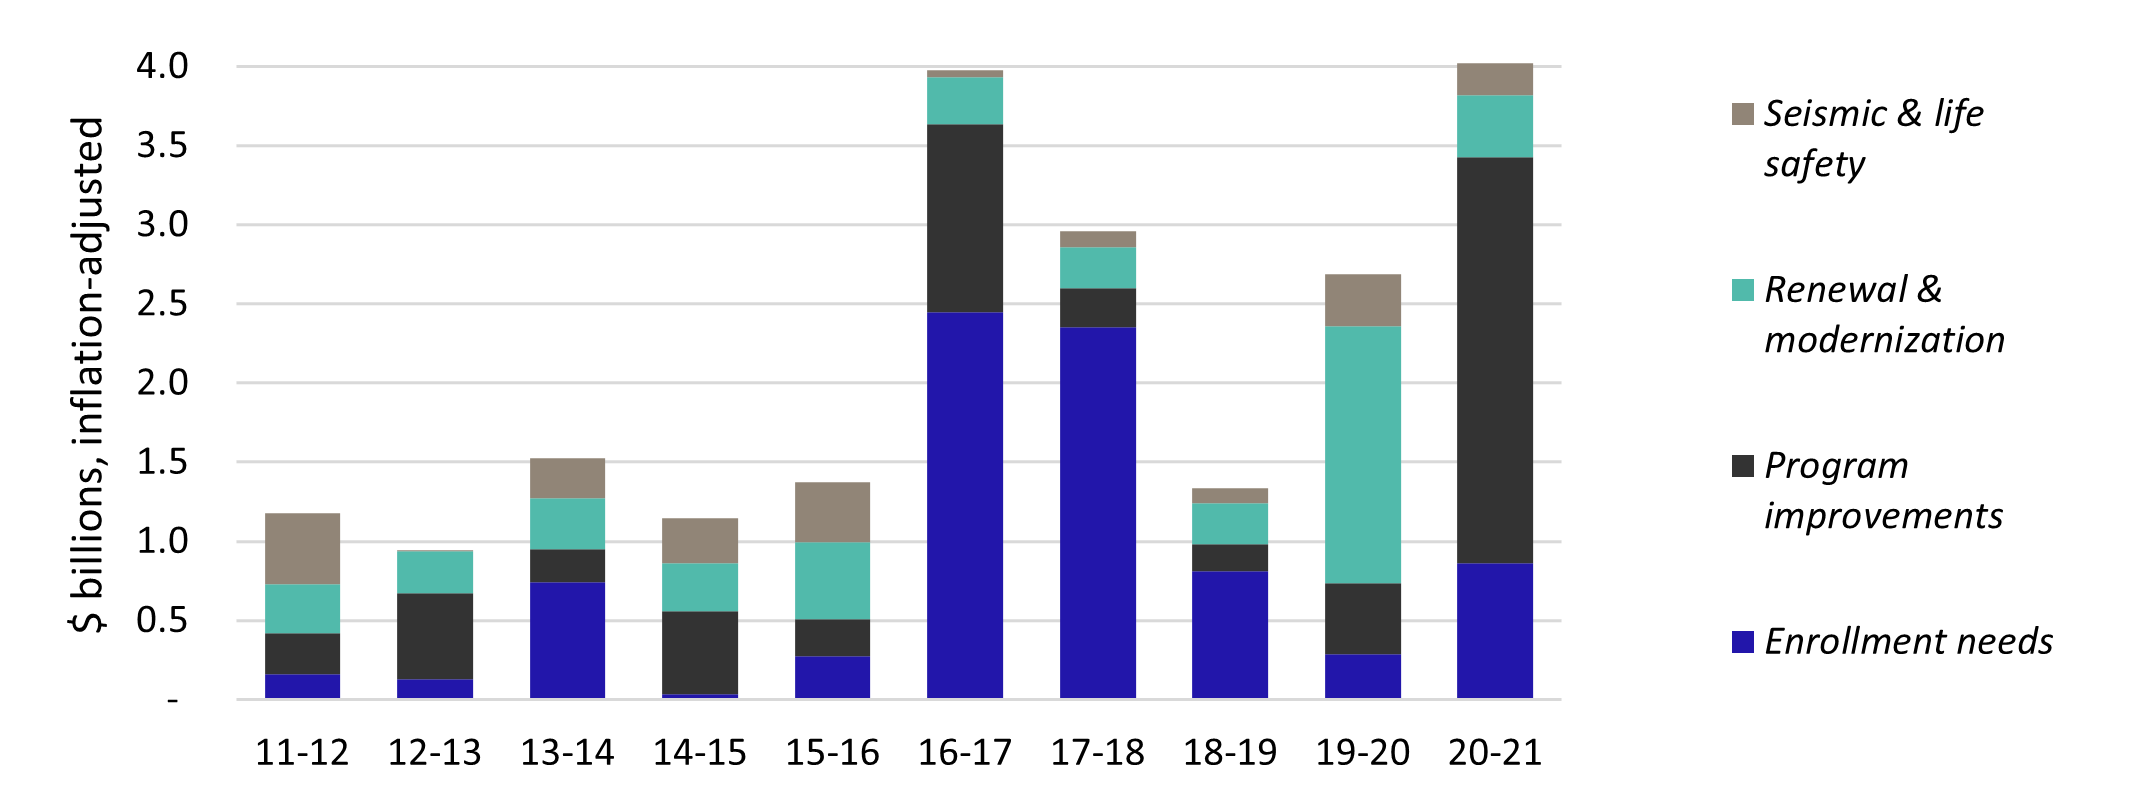
During 2020-21, UC approved capital project budgets totaling $4 billion. Almost three-fourths of the cost was met through debt financing, including external financing supported by State General Funds. Non-State sources funded the remaining capital projects.
In 2015–16 and before, most capital projects were aimed at growing core academic programs and replacing aging facilities. In more recent years (2016–17 onward), there has been an increase in projects that address enrollment growth and program improvements. The majority (56 percent) of 2020–21 capital projects were for the medical centers, and a significant number of projects (21 percent) addressed student housing for increased enrollment.
UC sustainability
The University of California is a national leader in sustainability. UC’s sustainability commitment began in 2003 with a Regental action that led to the adoption of a Presidential Policy on Green Building Design and Clean Energy Standards in 2004. Demonstrating the University’s commitment to wise stewardship of its resources and the environment, the Policy has since expanded to include multiple areas of focus: Climate Protection, Green Building Design, Clean Energy, Sustainable Transportation, Sustainable Building and Laboratory Operations, Zero Waste, Sustainable Procurement, Sustainable Food Service, Water, Sustainability in the University of California Health System, and Health and Well-Being. The University’s Sustainable Practices Policy was updated again in 2021.
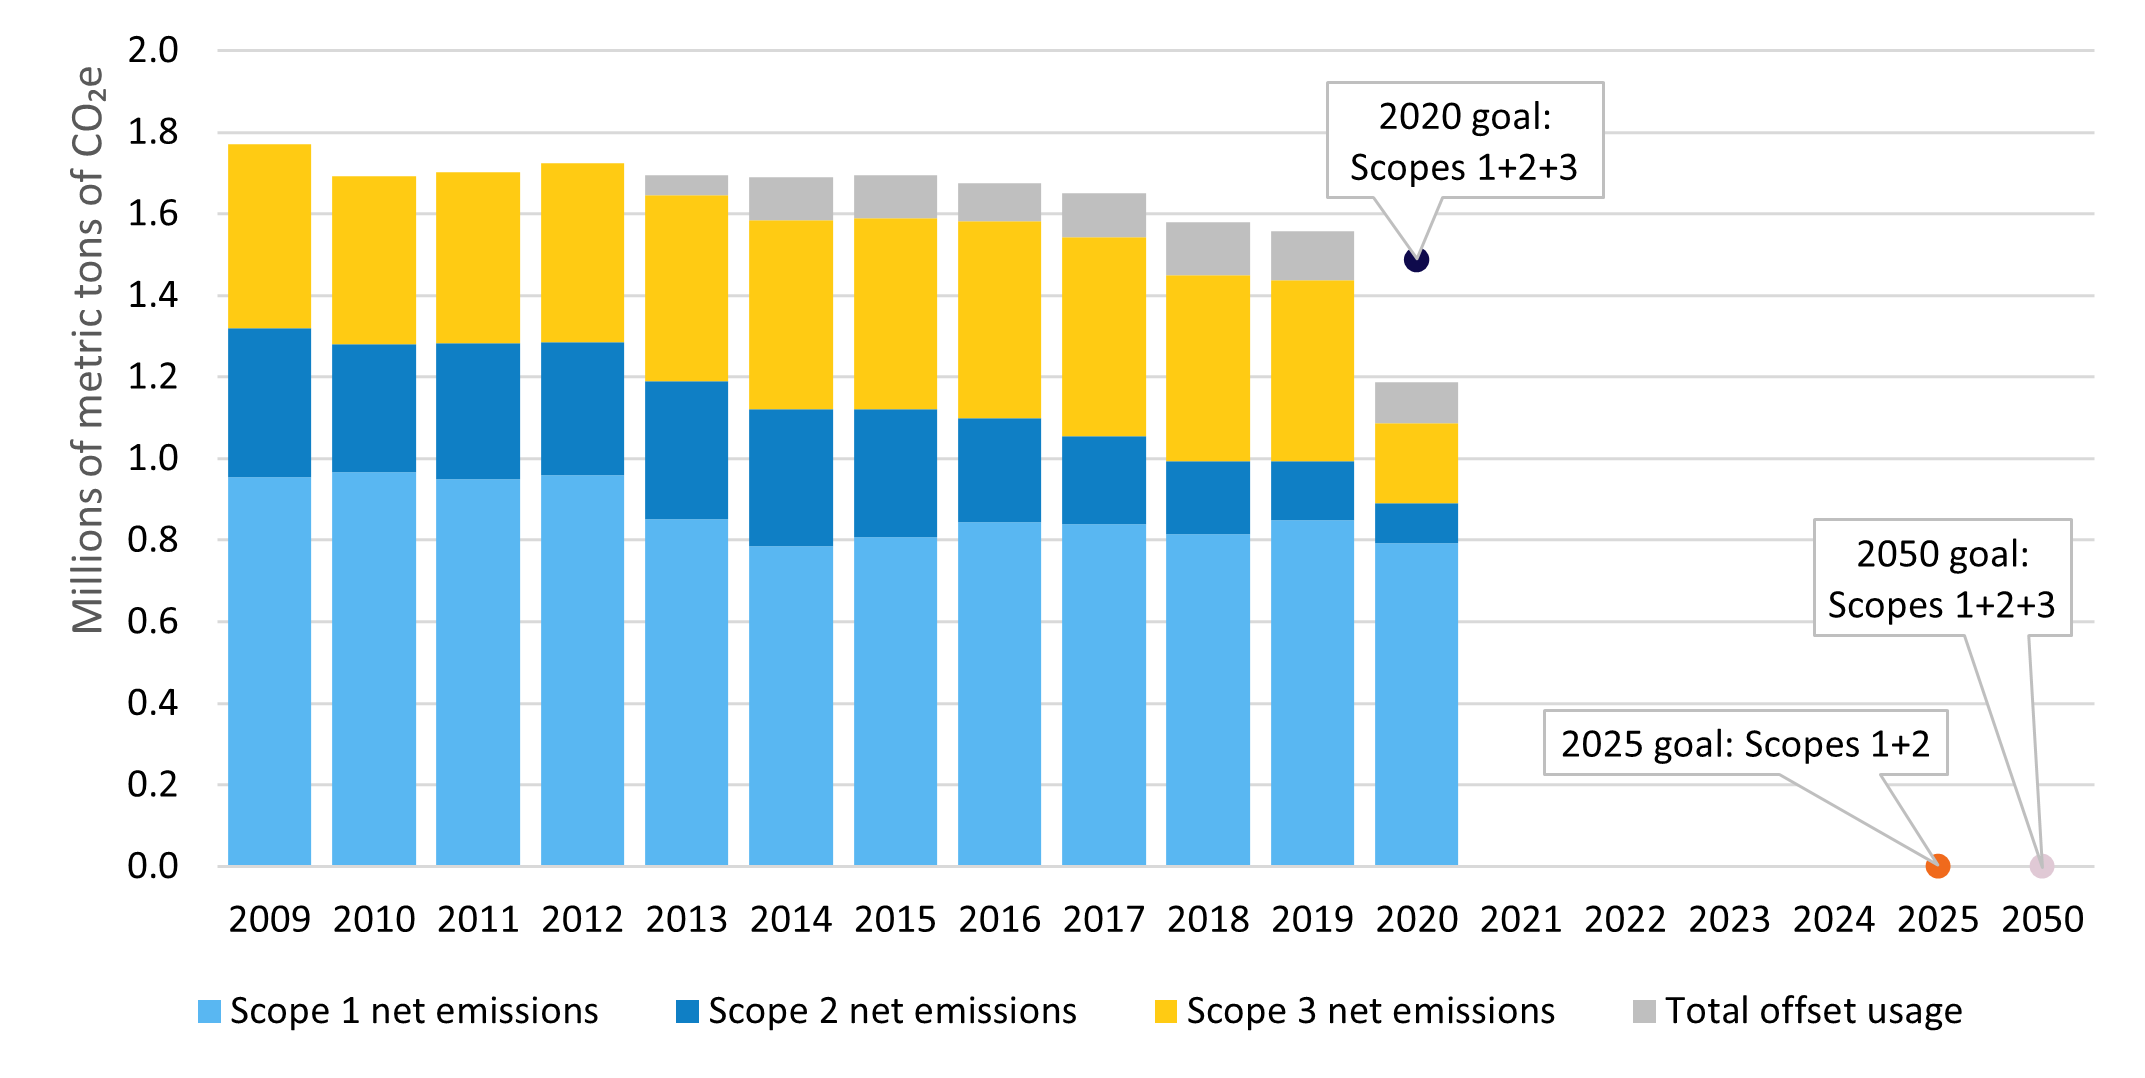
The University committed to systemwide climate action leadership in 2007, when all ten Chancellors signed the American College & University Presidents’ Climate Commitment to achieve carbon neutrality as soon as possible. Furthering this leadership, in November 2013, UC announced an initiative to achieve carbon neutrality by 2025. This initiative will make UC the first major research university system to achieve carbon neutrality. Most recently, UC Merced became the first public research university in the country to achieve carbon neutrality. Additionally, all campuses, including their health systems, achieved the University’s climate policy goal of reducing greenhouse gas emissions to 1990 levels by 2020 (based on reported emissions that will be third-party verified by early 2022).
The University’s Carbon Neutrality Initiative has advanced the University’s work on climate and carbon neutrality research and education, and furthers its leadership in sustainable business practices. Even as the campuses expand, overall greenhouse gas emissions have continued to drop due to improvements in energy efficiency, developing new sources of renewable energy, and enacting a range of related strategies to cut carbon emissions. For example, the University’s Clean Power Program is providing 100 percent clean electricity to eight campuses and three medical centers that are eligible to select an alternative energy provider. The Clean Power Program supplies approximately 30 percent of the University’s electricity use from off-campus sources. UC now generates more on-site renewable energy than any other university in the country and has over 100 renewable energy projects across the system. The University also funded 44 students with Carbon Neutrality Initiative Fellowships during the 2020–21 school year to work on projects supporting UC’s carbon neutrality goal.
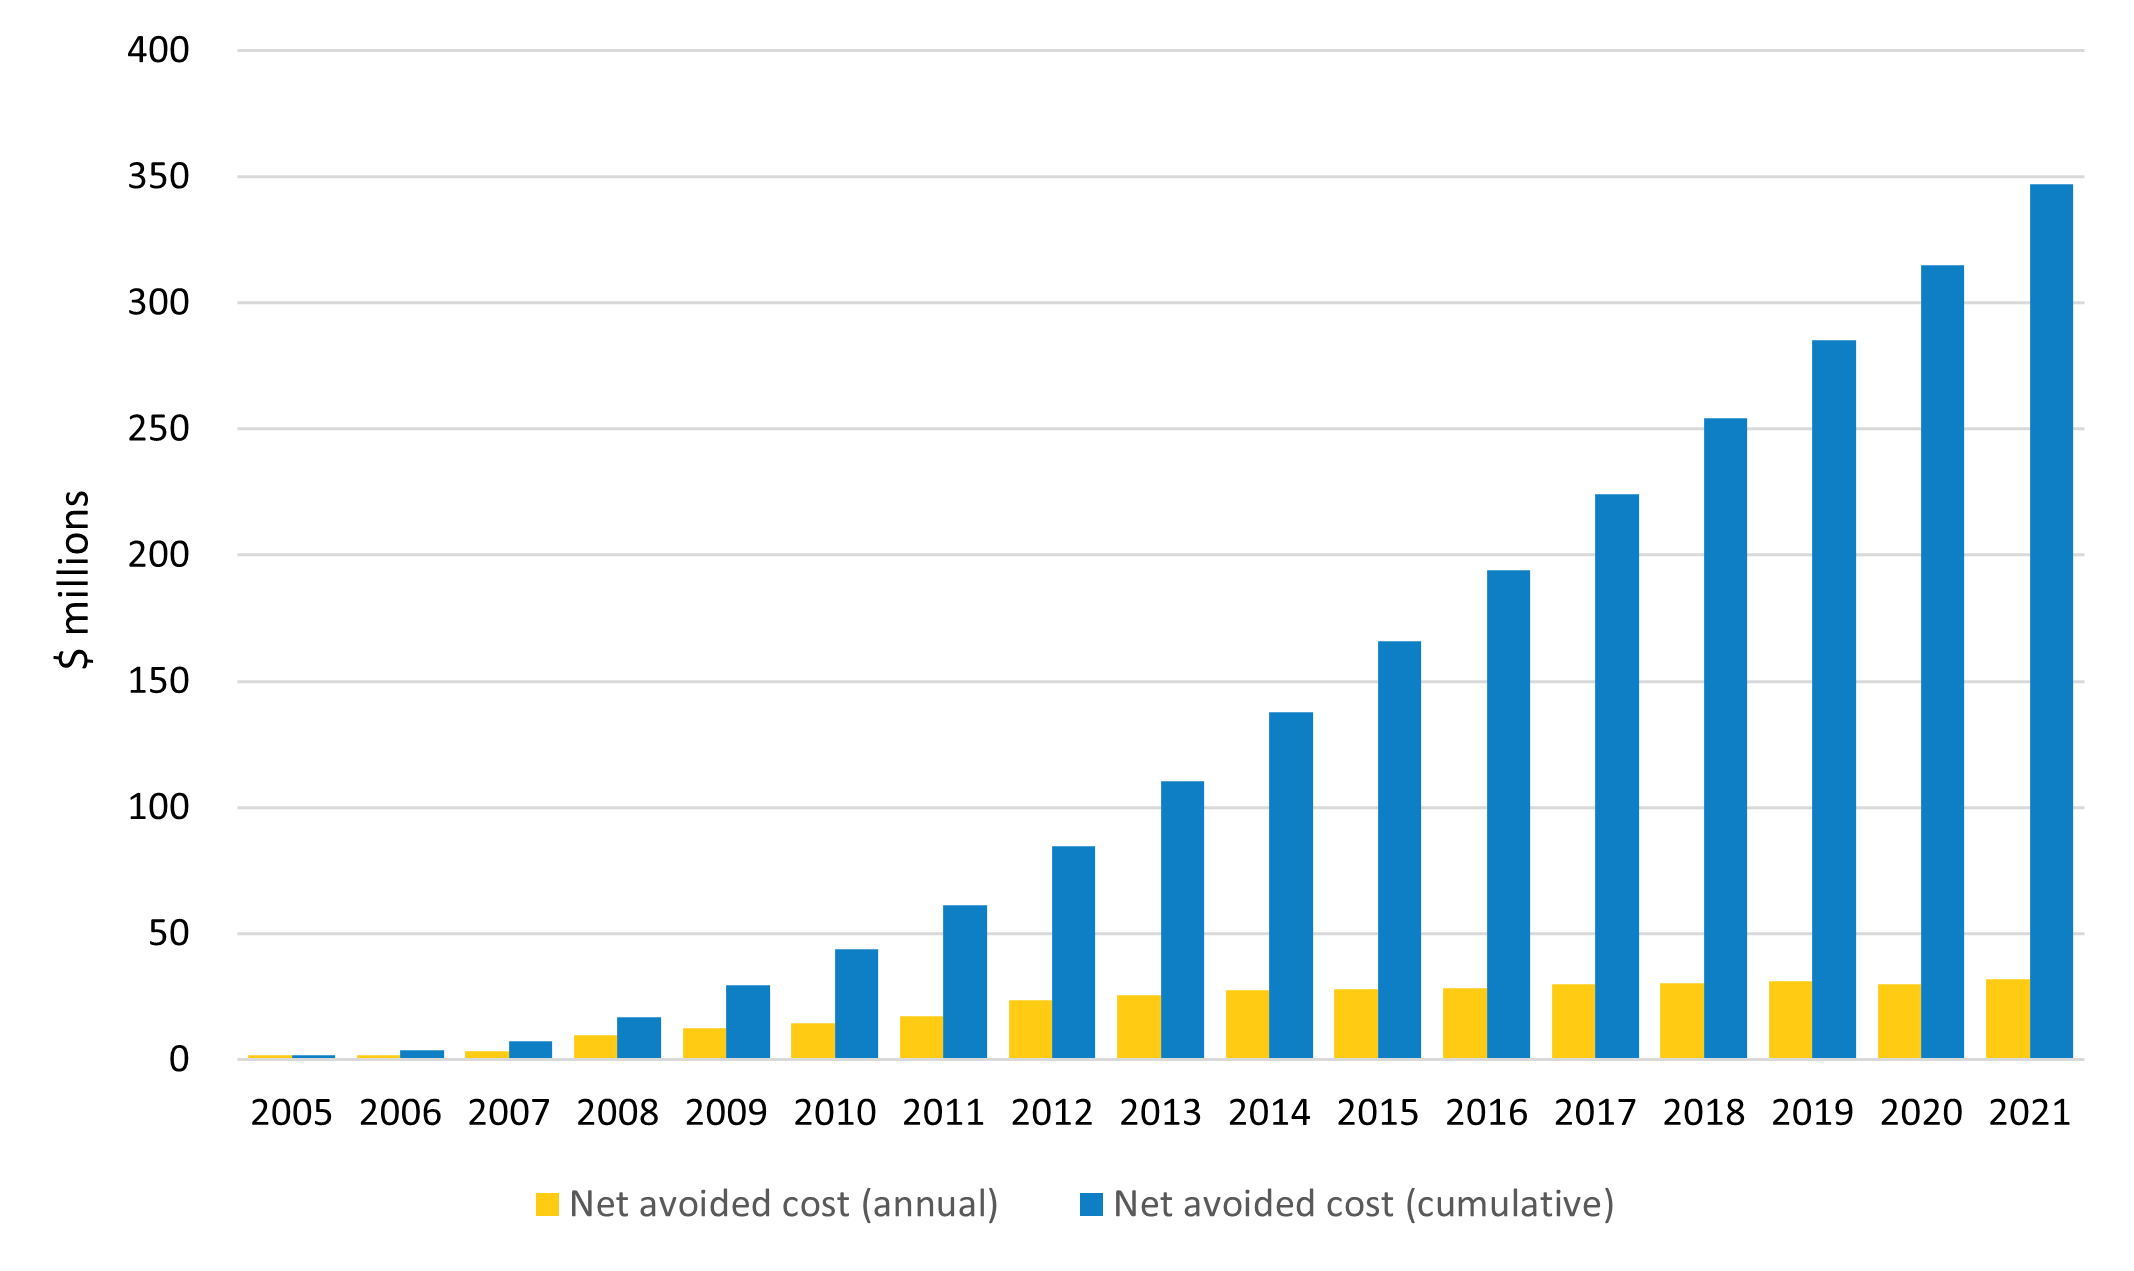
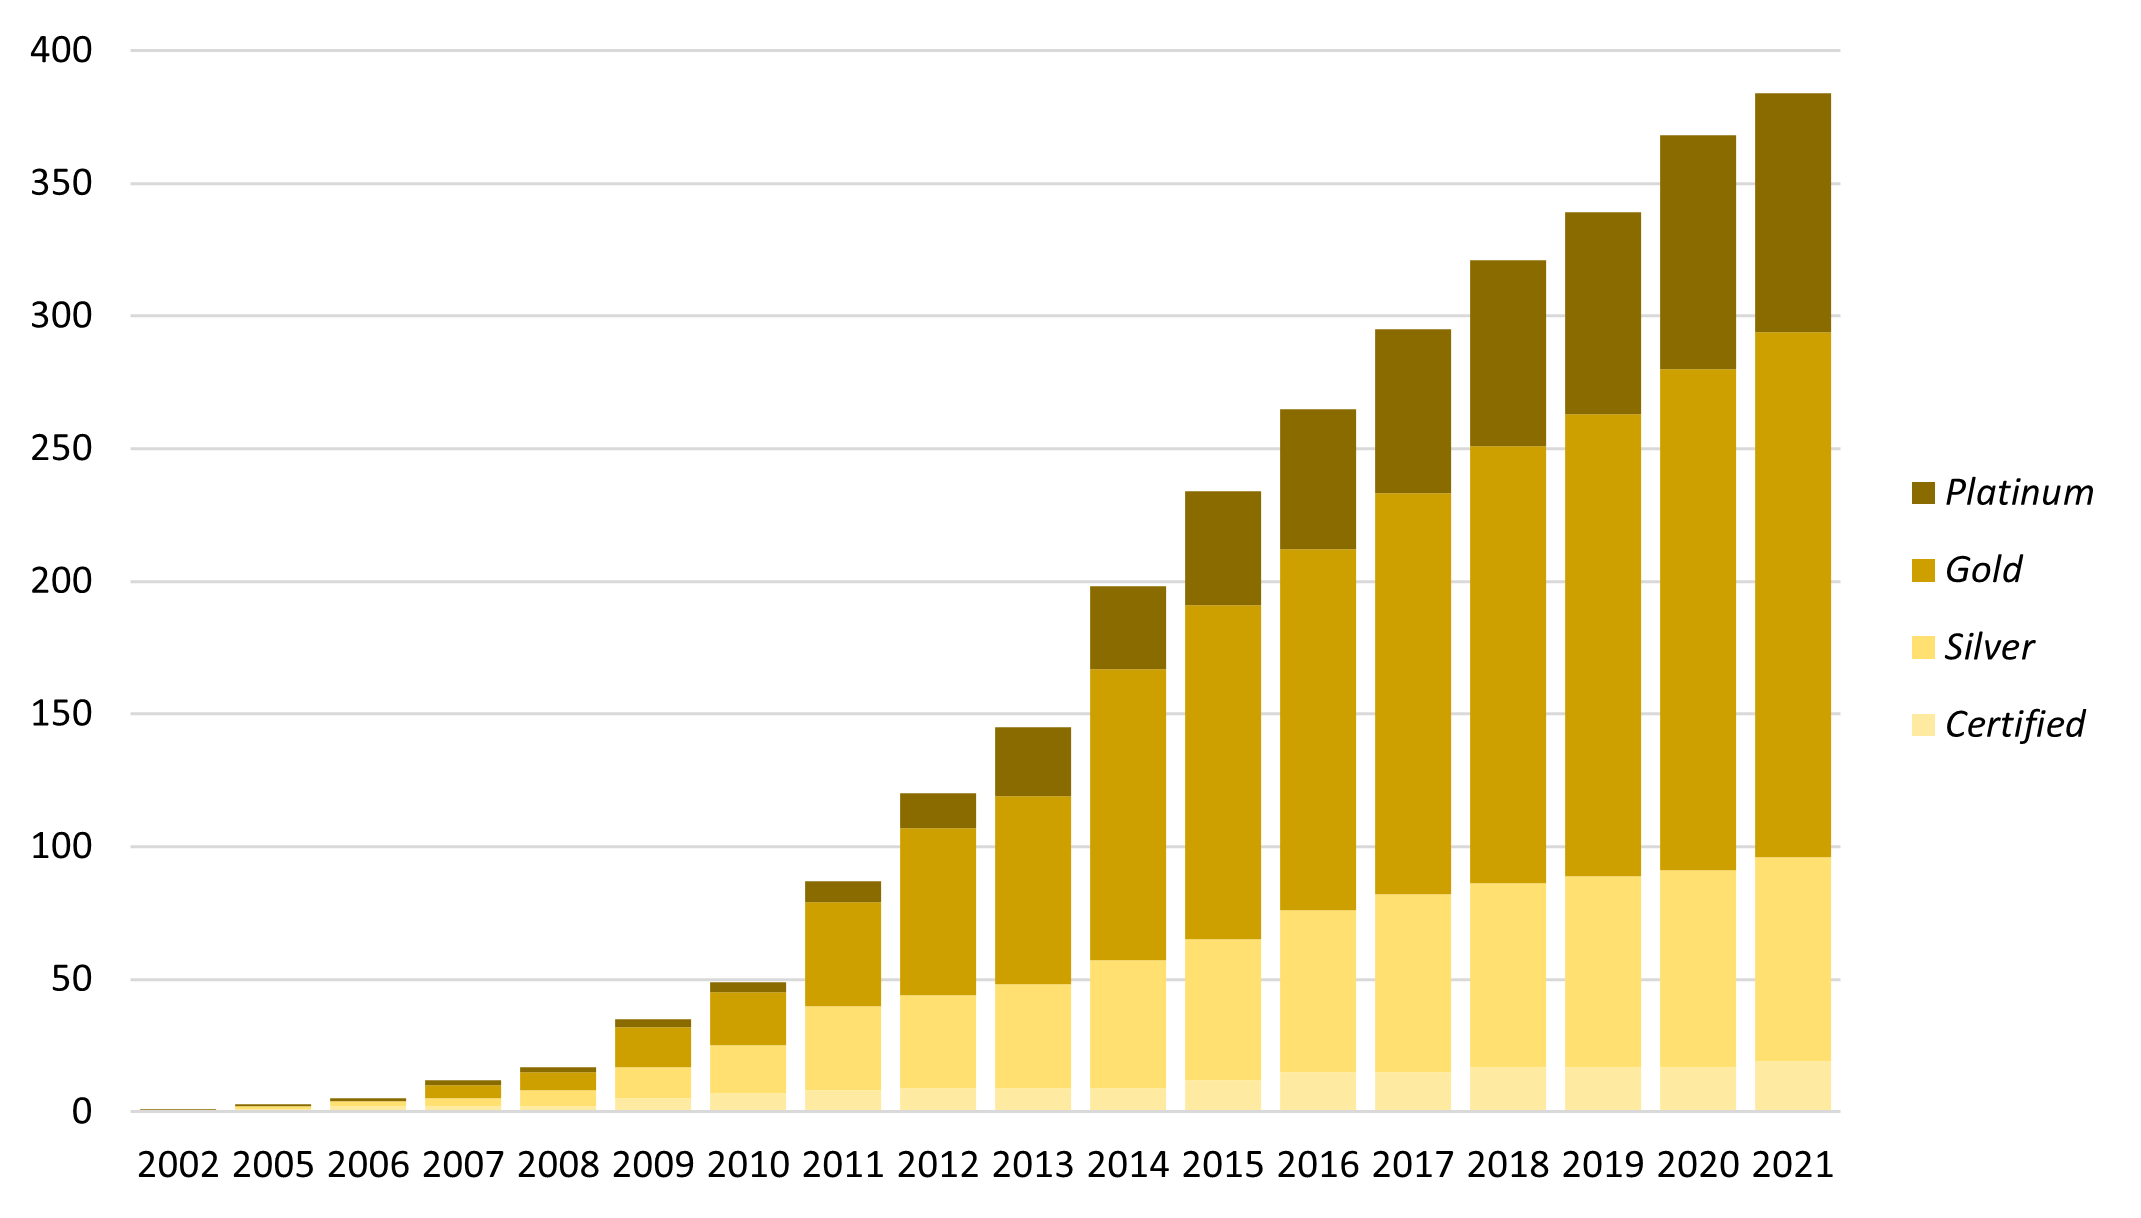
Upfront investments in energy efficiency are often costly, but energy efficiency projects across the system have so far netted approximately $347 million in cumulative avoided utility costs since 2005. Moreover, UC’s policy requiring that all new construction projects and major renovations receive LEED® (Leadership in Energy and Environmental Design) certification helps assure that campus growth does not increase energy costs and climate pollution as much as it would otherwise. As of 2021, UC has 384 LEED certifications, the most of any higher education institution in the country. In addition to LEED and energy efficiency requirements, starting in 2019, new buildings were required to take advantage of the University’s access to carbon-free electricity and not use fossil-fuel combustion for space and water heating except under special circumstances.
Additionally, UC’s fleet continues to move toward zero-emission vehicles. Systemwide, 50 percent of all new light-duty fleet vehicles purchased in fiscal year 2020–21 were electric (zero-emission) or hybrid. There are over 1,400 electric vehicle charging stations throughout the UC system.
UC Community safety plan
The UC Community Safety Plan (ucop.edu/community-safety-plan) re-envisions safety at the University of California locations and calls for transforming UC's culture, policies, and practices to ensure that all members of the community feel welcomed, respected, and protected from harm. This plan emerged from robust discussions, including two separate systemwide Presidential Symposia, and Chancellors forming campus-based safety task forces to engage their communities in re-envisioning campus safety and policing. As a result of these discussions, the UC Community Safety Plan is based on the following fundamental guidelines:
- Community and service-driven safety: All members of the UC community should feel valued, welcomed, and free from any threat of physical, psychological, or emotional harm. Individuals should receive high-quality, courteous, and accessible services. Every interaction will be held to a high standard of respect and fairness and will be monitored.
- Holistic, inclusive, and tiered response model for safety services: A tiered response model will match a call for service with the appropriate type of response and responder(s). This holistic approach will include mental health, wellness, basic needs, bias/hate response, law enforcement, emergency response, and other services through interdepartmental partnerships and cross-trainings.
- Transparency and continuous improvement through data: A systemwide dashboard with location-level detail will be created and regularly updated to inform and empower the UC community. Based on new systemwide reporting requirements and uniform standards for data collection, this information will be used to assess campus safety practices, generate recommendations for best practices, and hold the institution accountable.
- Accountability and independent oversight: A standardized and robust complaint and investigation process will be implemented through police accountability boards to broaden oversight of existing mechanisms for the community to report instances when officer actions may be inconsistent with rules, policies, and the law.
A Community Safety Data Dashboard Workgroup commenced in Fall 2021 to meet the key milestones to demonstrate our commitment to transparency and continuous improvement through data. In the first phase (2021), we posted public reports on Crimes and Use of Force data on the community safety plan website and launched a new systemwide police department workforce report. These reposted Crimes and Use of Force reports reflect data gathered and summarized according to federal and state reporting requirements.
In the second phase (2022), the workgroup will establish a standardized process to collect data from all UC locations on a quarterly basis to support systemwide reporting on community safety. These quarterly submissions will record aggregated numbers of crimes, use of force, stops, complaints, and calls for service. The workforce report will be published annually along with a budget report. The workgroup will develop a systemwide dashboard for these new, central aggregate data collections. The UC Information Center will host the systemwide dashboard starting in 2022 and key metrics will be available for annual reporting in the 2023 publication of the UC Accountability Report.
A systemwide Vehicles, Uniform, and Equipment Workgroup also commenced in Fall 2021 to provide recommendations to the visible elements for every tier in the safety model. This working group is examining similarities in appearance between local (municipal or county) law enforcement vehicles, for instance, to University of California official fleet vehicles. Further, department uniforms and vehicles within each campus may be difficult for the community to distinguish among such different roles as parking enforcement personnel, security desk staff, and sworn officers. The working group will also make recommendations regarding visual identification of new mental health response personnel who could be dispatched in emerging crisis response.
In addition, the UC Office of the President is hiring a full-time position to monitor and support the systemwide implementation of this plan while ensuring it continues to meet the evolving needs of each UC location. In summary, these improvements do not represent the end of this conversation at UC. This community-driven plan is designed to be a living document that all partners will continue to update and adapt together, considering the latest information and data.
For more information
UC’s operating budget (website)
Annual financial report (website)
Annual financial report (Medical Centers) (website)
Revenues and expenses (dashboard)
Annual reports on University private support (website)
UC’s capital programs (website)
Annual major capital projects report (website)
Ten-year capital financial plan (website)
Information on UC’s sustainability (website)
Annual sustainability report (website)
UC Community Safety Plan (website)