Accountability Report 2022

chapter 6: staff

 “Lack of leadership opportunities can prompt women to leave their careers too soon, feeling unappreciated or unrecognized in the workplace,” says Shohreh Bozorgmehri, founder of Women in Technology at UCI and chair of the advocacy group’s inaugural board of advisors. “It’s important that women have access to a solid network of allies, sponsors or mentors to feel valued and thrive.”

“Women in Technology at UCI was created from the aspiration to bring awareness to the challenges and unique experiences of women and minorities working in tech on campus, Technology is integral to all aspects of the business of higher education, but right now only less than a third of tech professionals are identified as women. By working to develop a more gender-diverse and equitable workplace, we maximize the benefits of diverse perspectives and creative ideas that advance our institution’s mission.”

WiT held an “Allyship That Makes an Impact” webinar in February 2021 that drew 331 attendees for a discussion of how allies can support women and minorities in technology. These conversations inspired the development of the Better Allies Book Club, sponsored by UCI’s Office of Information Technology to support the creation of an inclusive workplace through everyday actions.

In March 2021, WiT launched Applause, an annual peer recognition program spotlighting women who are building a culture of inclusion, equity and empowerment in their IT workplace. The organization has also sponsored career coaching for high-potential women.

“We should also continue challenging bias head-on and practicing a culture of ‘allyship’ to support minority groups. It’s important to acknowledge that anyone could make a difference by becoming an ally to women and minorities.”  


Overview

The three-pronged mission of the University of California includes teaching, research, and public service, none of which can be accomplished without the support of staff who organize and facilitate all that is required to do the work of the University. Despite the operational and financial challenges created by the COVID-19 pandemic in 2020 and 2021, UC employees quickly rose to the challenge of engaging in the University’s mission of teaching, research, and service in a remote environment. Recognizing the challenges faced by employees, the University of California adopted numerous programs and exceptions to policy, providing flexibility to the staff to conduct their work.

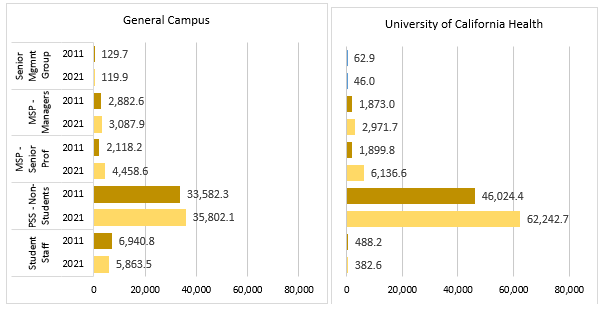
Non-academic staff employees constitute over 70 percent of UC’s workforce and are responsible for health services, student services, instruction and research support, compliance, and general administration (6.1.1). In October 2021, this group included 158,264 individuals. Overall, this staff workforce represented over 121,520 full-time equivalent (FTE) employees in that month.

Staff workforce
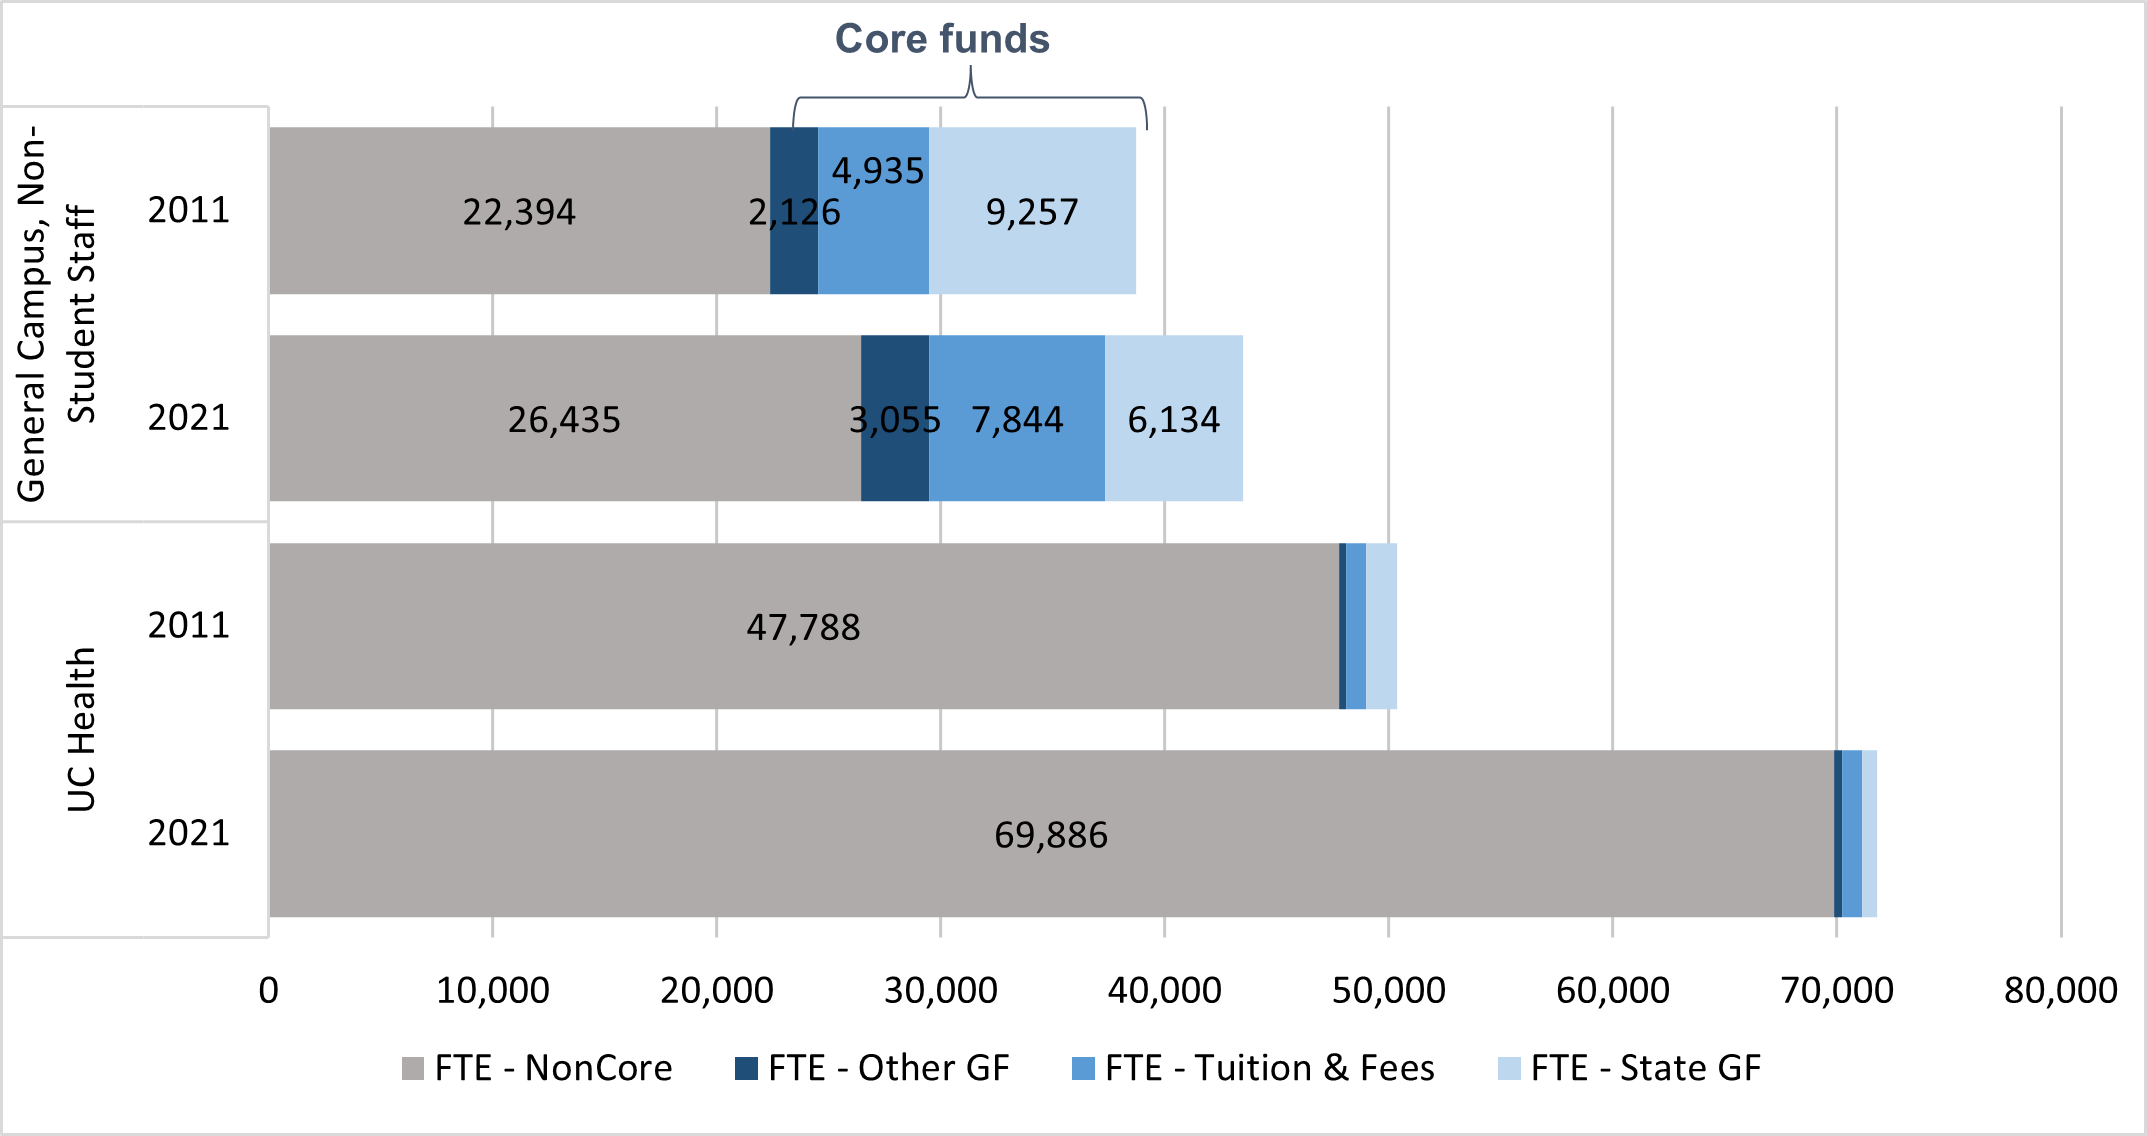
  • About six out of every ten UC staff FTE are working for the University of California Health system. These frontline workers (including doctors, nurses, administrators, technicians, and allied health professionals) are playing a critical role in California’s response to the COVID-19 pandemic. Over 97 percent of these employees are supported by non-core funds, typically the revenues generated by hospital services.
  • Students often work part-time on campus as part of their financial aid packages or for research experience. As UC campuses returned to in-person instruction, student employee headcount at general campus rose from 18,100 in October 2020 to 27,200 in October 2021.
  • General campus, non-student employees are the remainder of the University’s staff, at 43,672 FTE. This includes student services employees, career advisors, IT specialists, research administration, laboratory staff, food and auxiliary service workers, accountants, maintenance and janitorial staff, safety workers, and analysts (6.1.1).

diversity

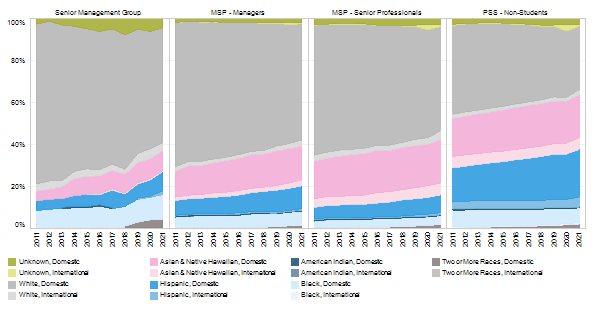
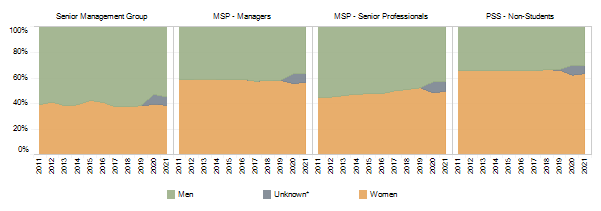
The University of California is committed to diversity and excellence in its staff workforce. Staff at UC are majority women and increasingly ethnically diverse across all personnel groups (6.1.2). However, there are variations among the different employee groups, with less diversity and women representation among senior positions. A more diverse academic and staff population is an increasingly important attribute of a thriving public research university system.

Staff compensatioN

Over the past decade, UC has relied less on core funds (State funds, tuition and fees, and other general funds) to cover the staff payroll. While UC has about 26,187 more staff FTE than ten years ago — largely due to University of California Health and student staff growth — fewer FTE are paid on core funds (6.2.1). About 17 percent of staff are paid using core funds.

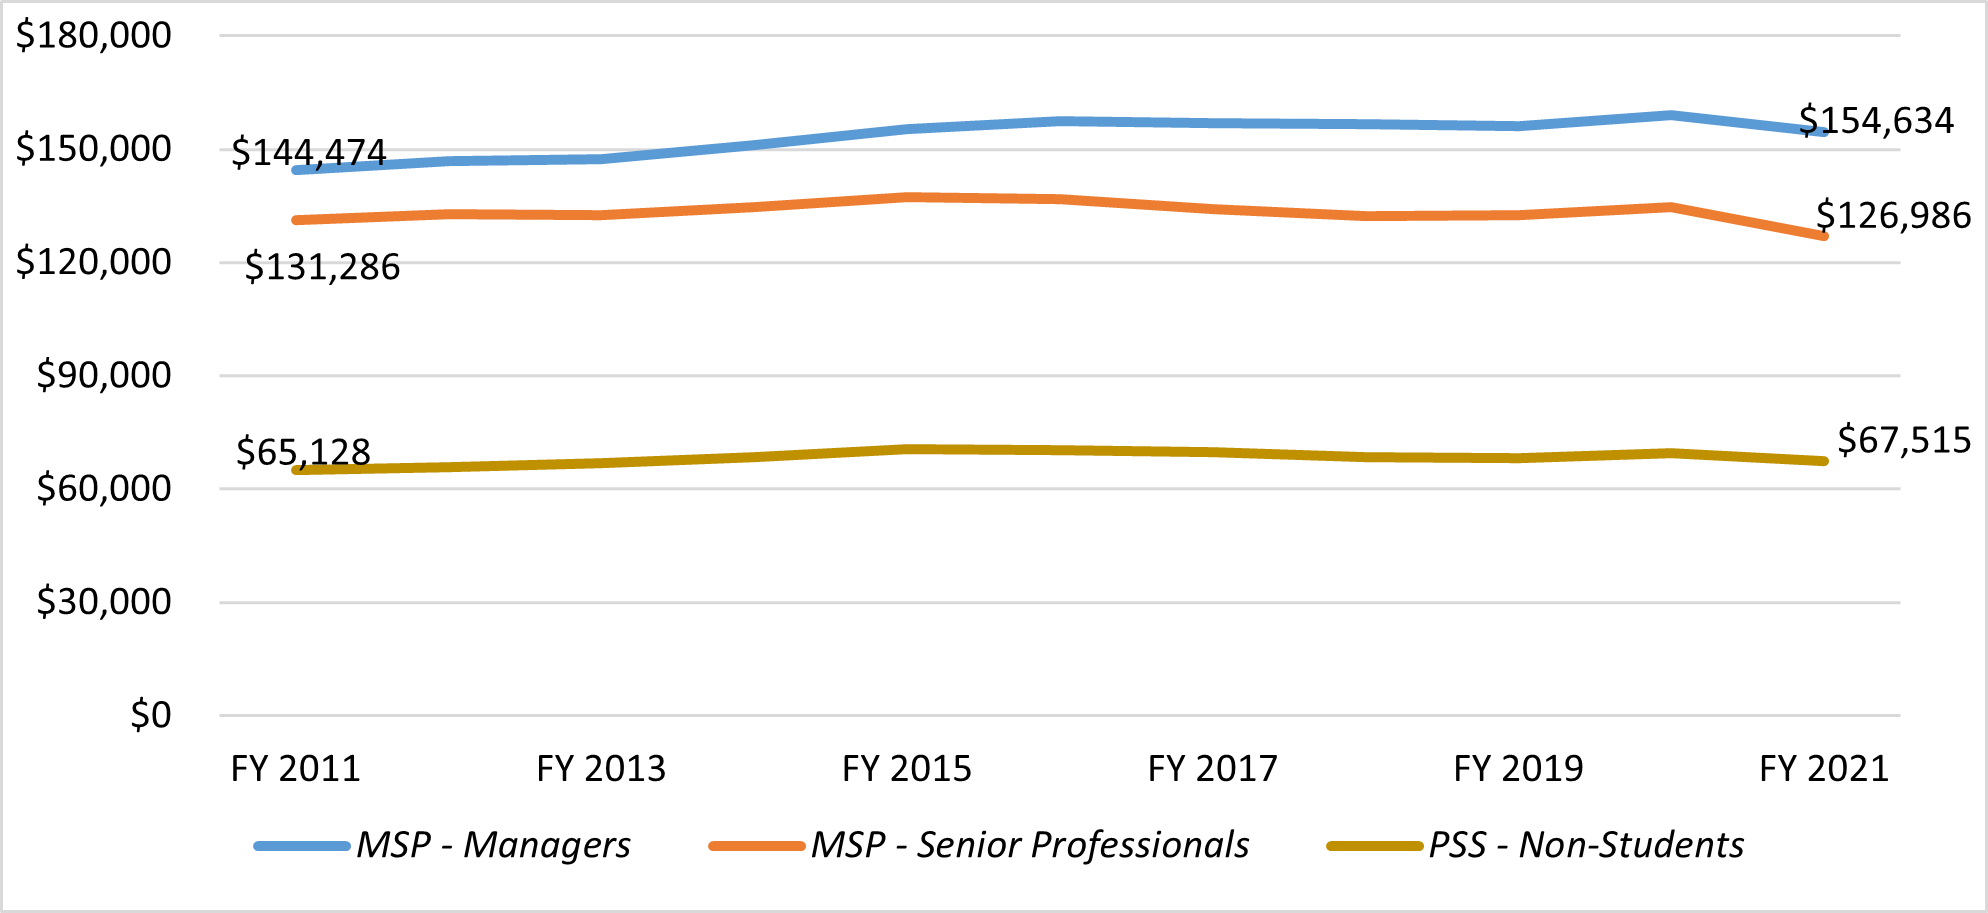
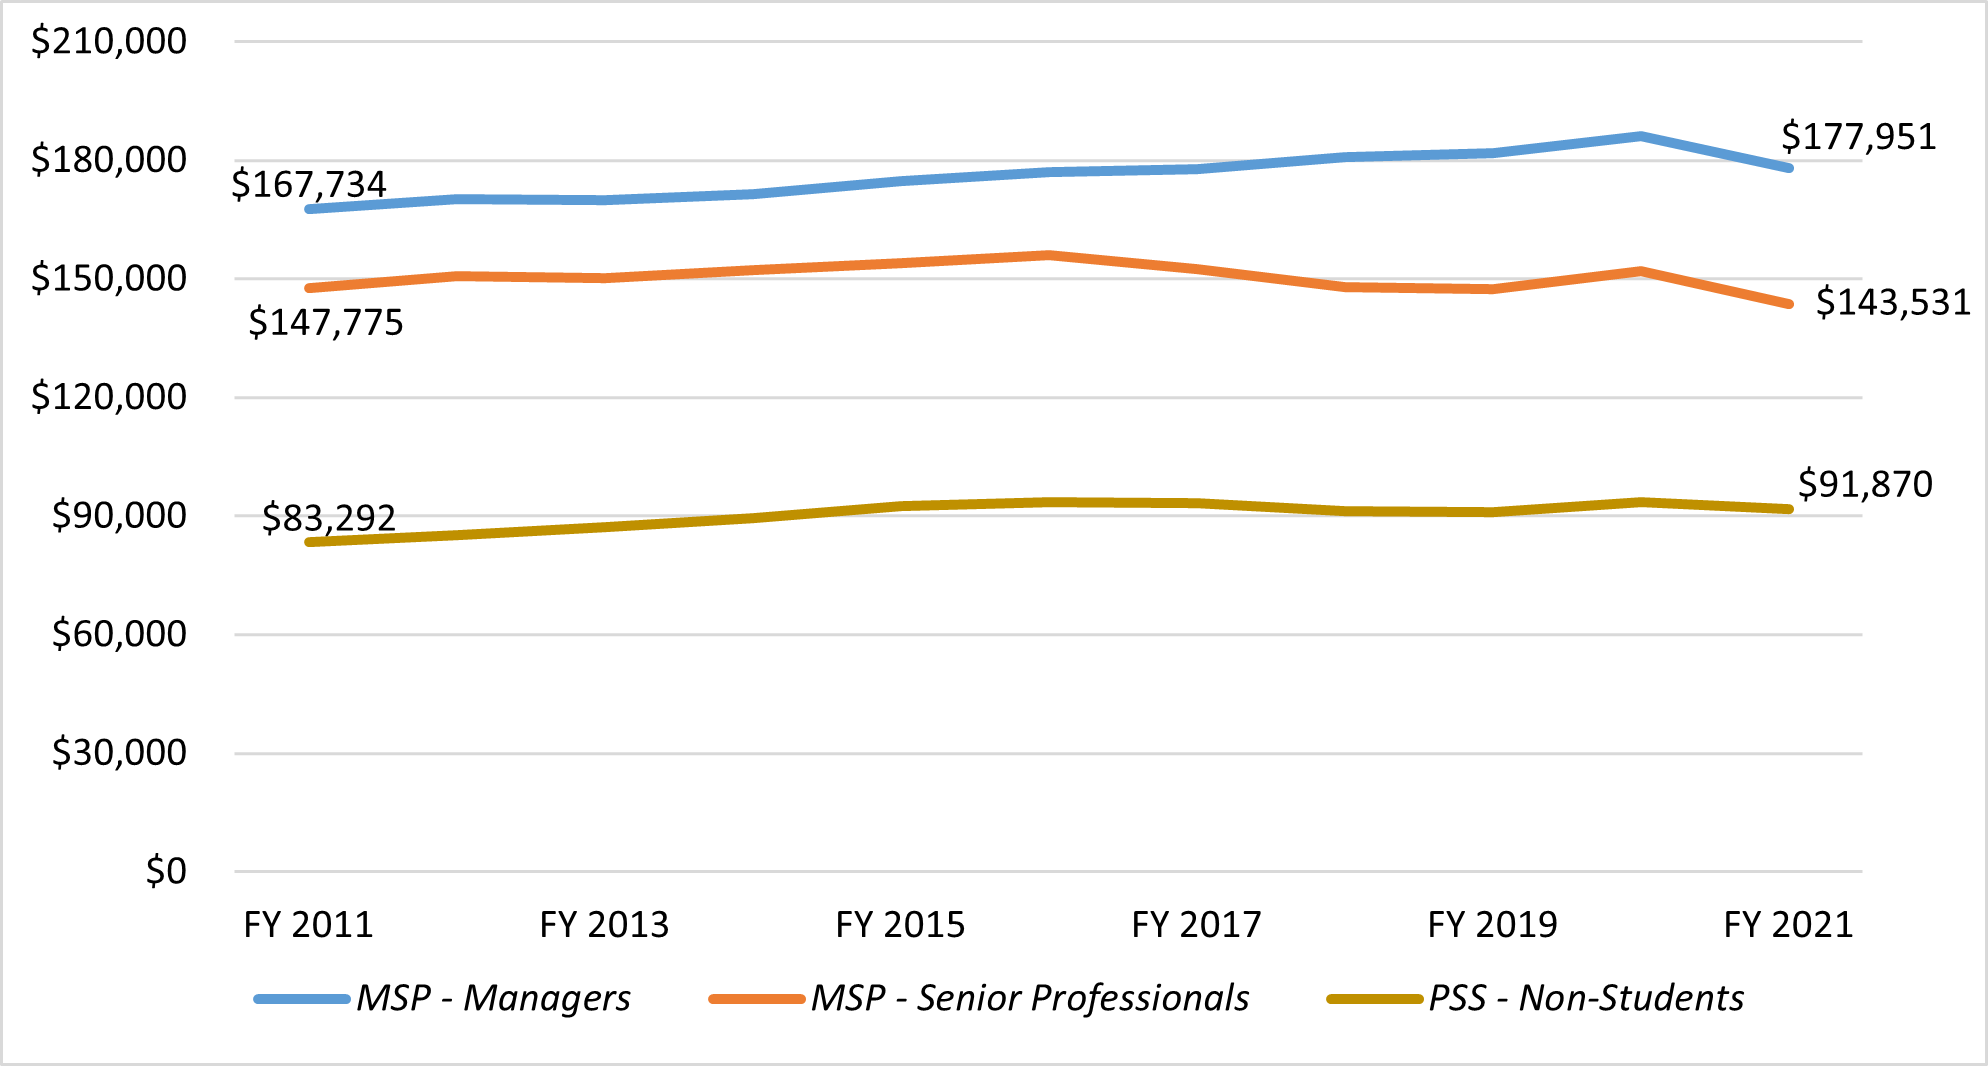
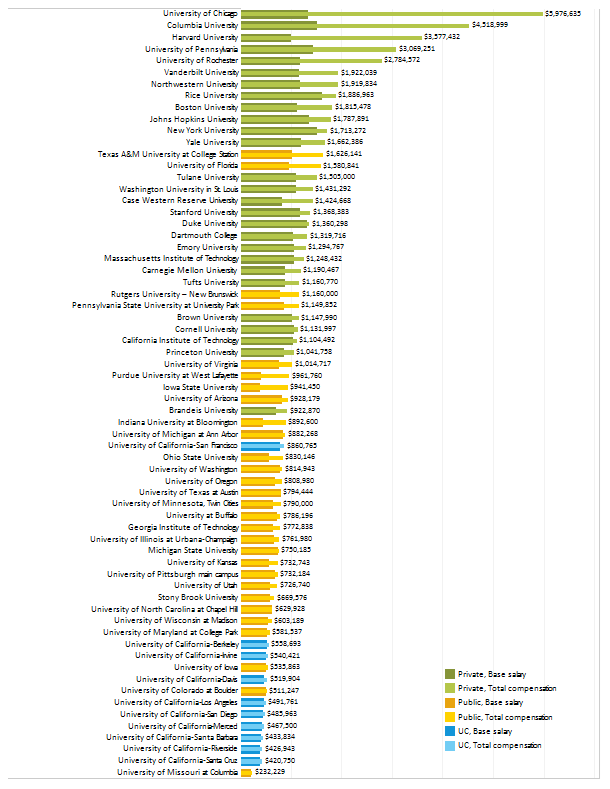
General campus career staff salaries have stayed relatively flat compared to inflation for the past decade and have increased modestly for some University of California Health professionals. Staff salaries tend to lag behind comparable market positions, and the lack of increases beyond inflation could affect staff satisfaction and turnover (6.2.2, 6.2.3). Chancellor compensation falls on the lower end when compared to peer institutions (6.2.4).

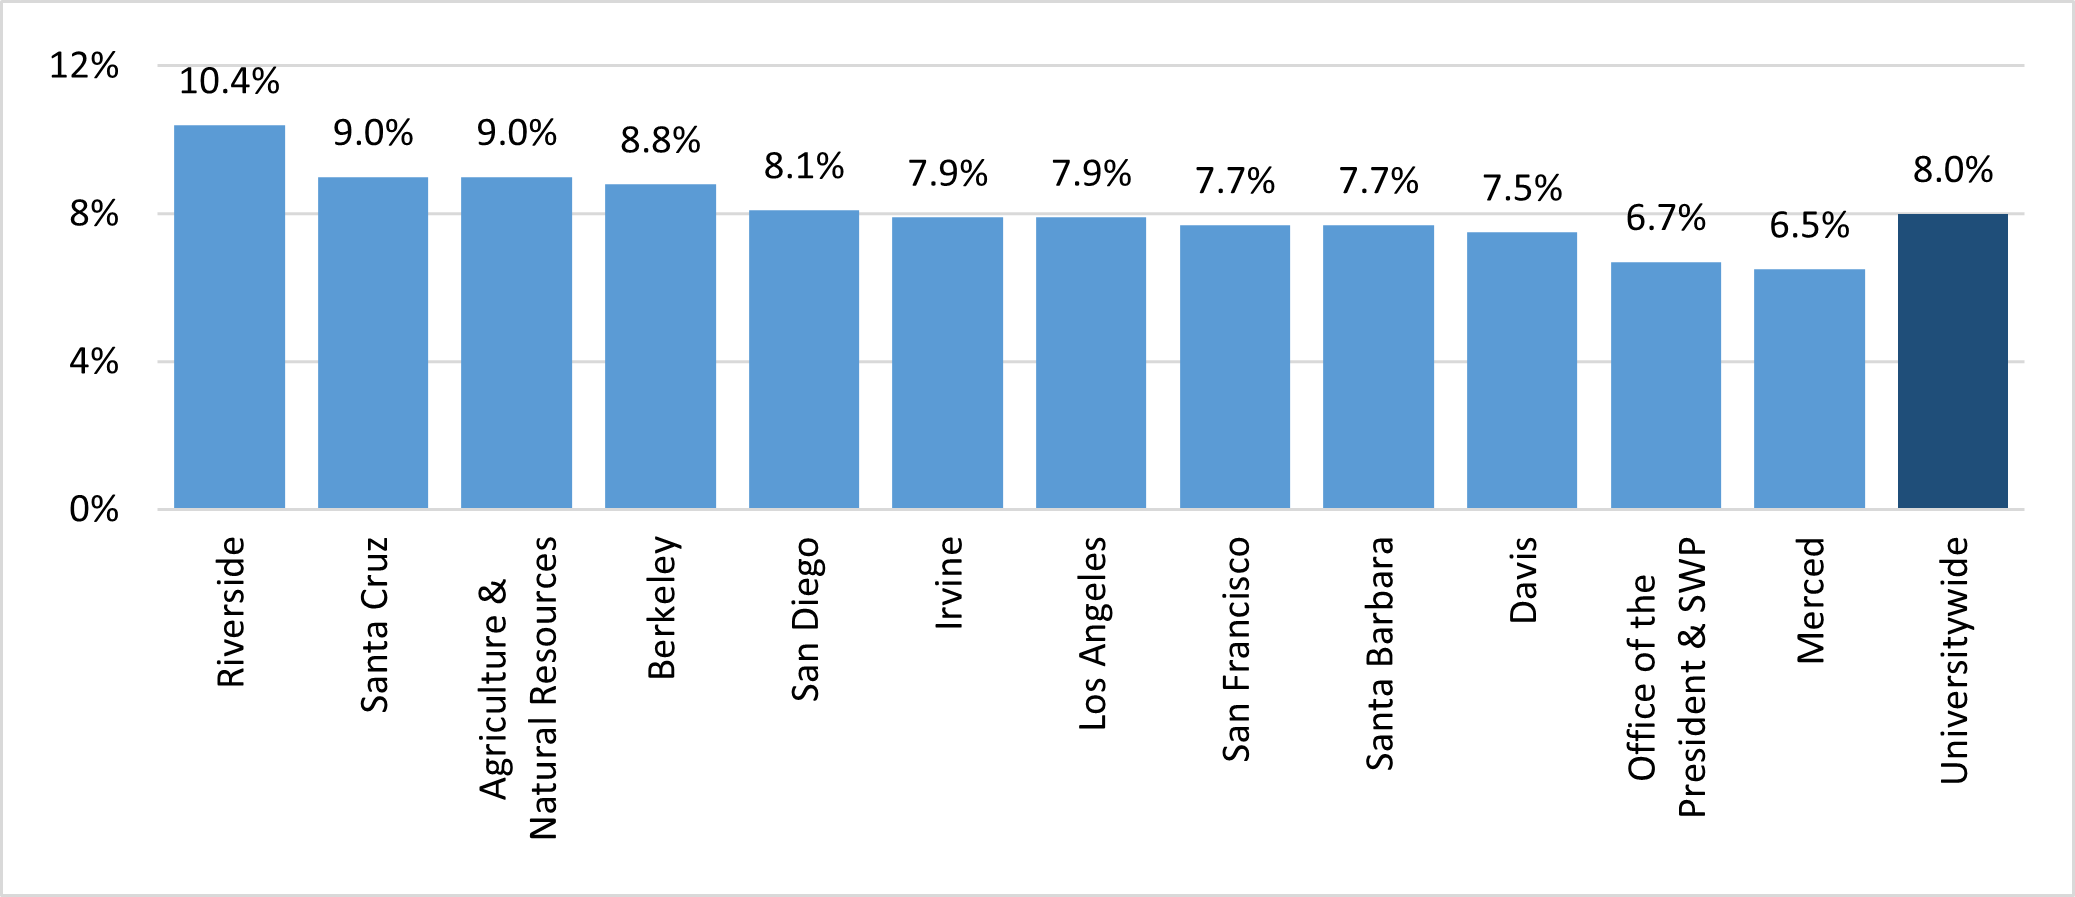
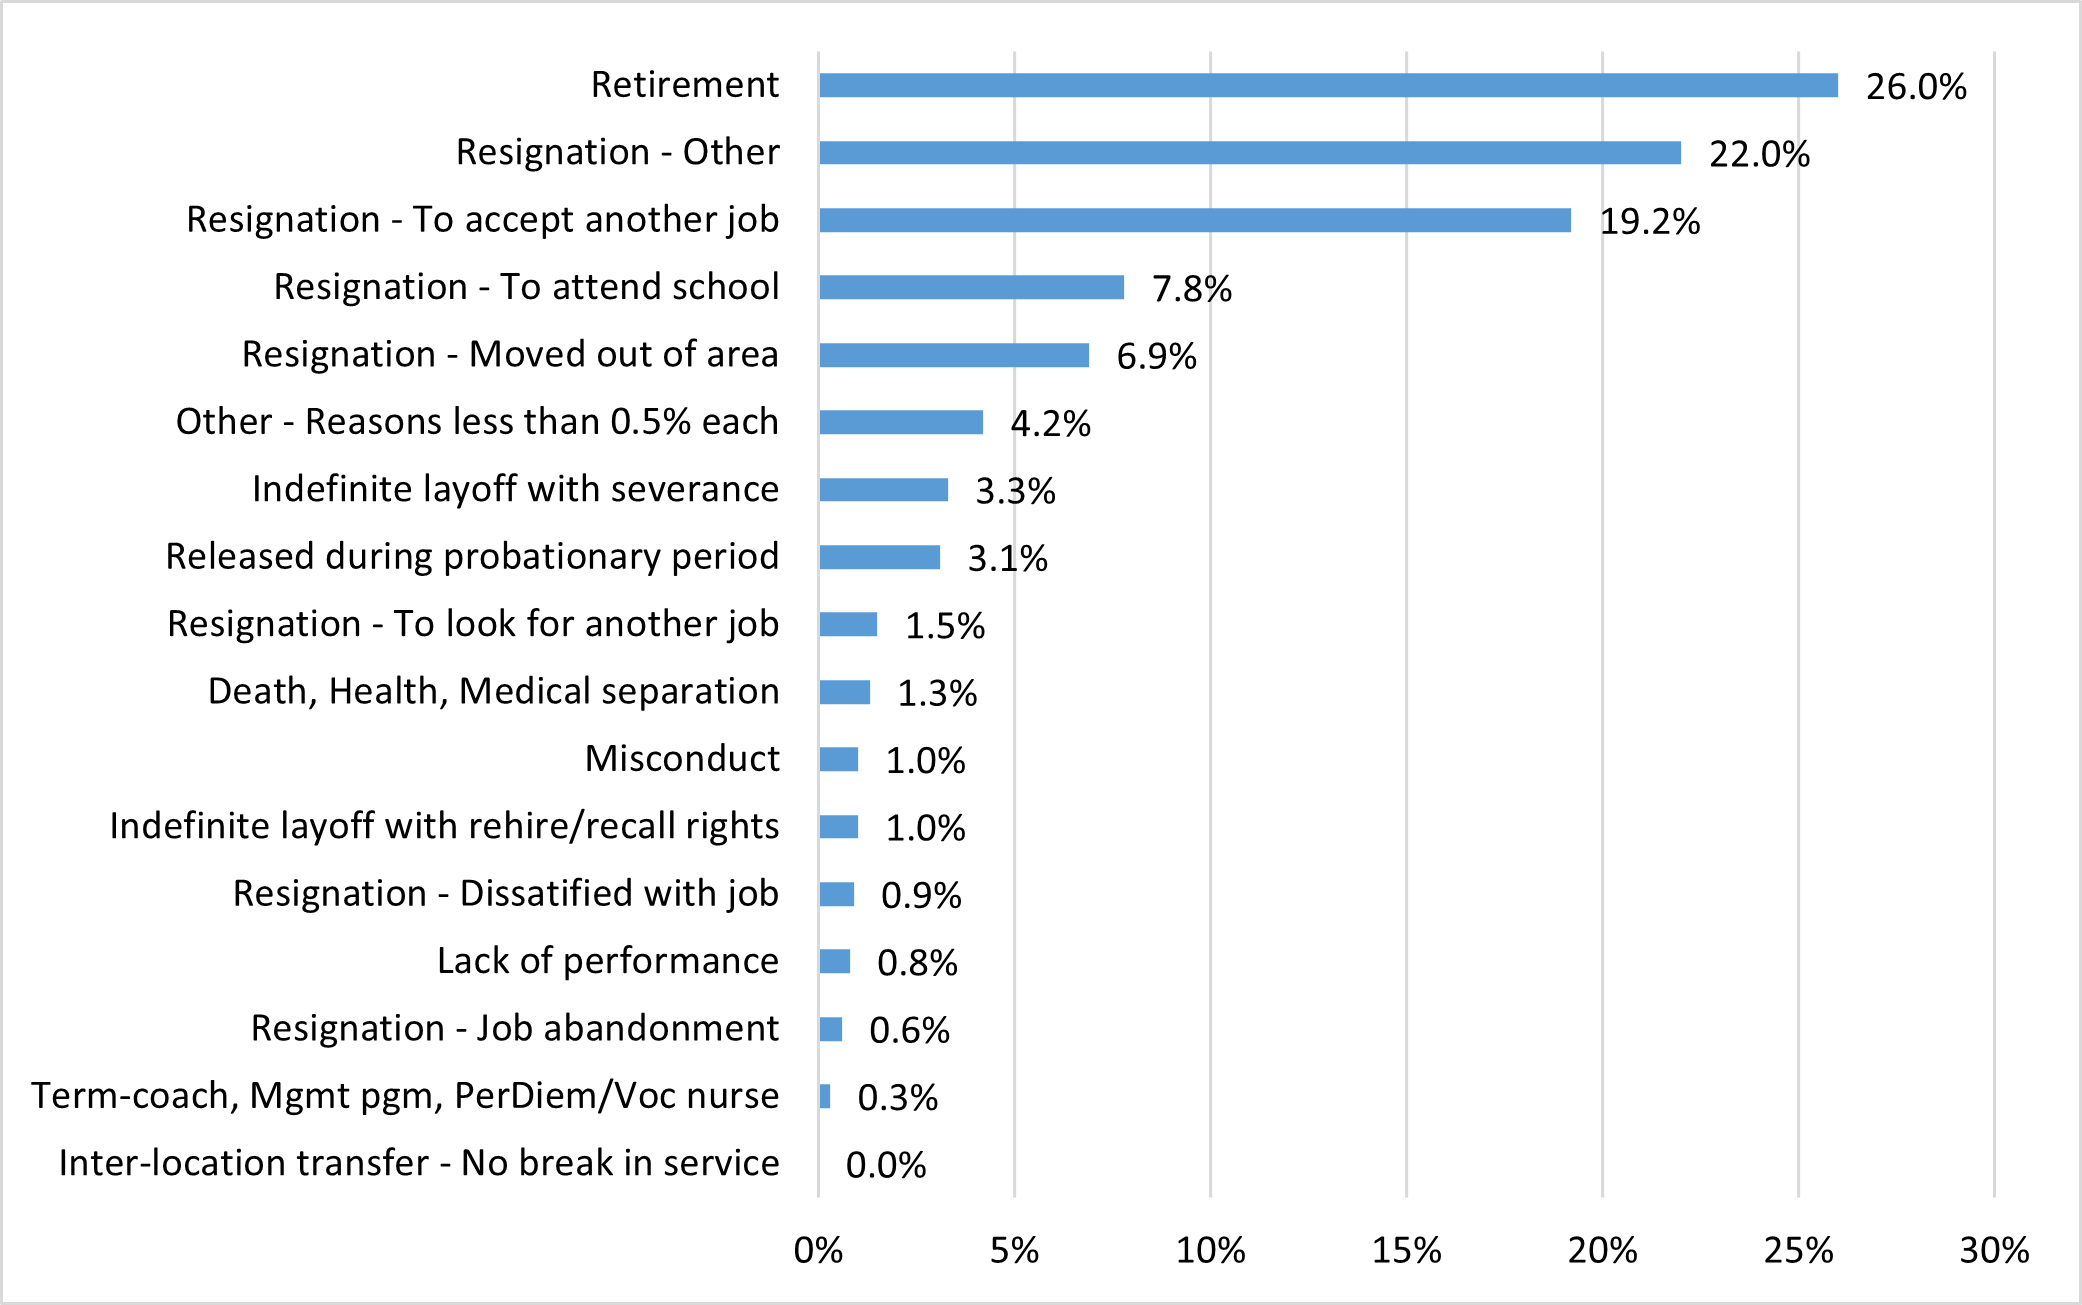
Staff separations and satisfaction

UC’s separation rate among career staff in 2021 is about eight percent (6.3.1), which is lower than it has been in a decade. More than one quarter of staff separations are due to retirement and reflect the baby-boomer generation exiting the workforce. Still, a large portion of separations are due to resignations to accept another job, to move out of the area, or for other reasons (6.3.2). The 2019 Council of University of California Staff Assemblies (CUCSA)/Systemwide Human Resources Engagement Survey shows some improvement in employee engagement since 2017 in the areas of organizational change, communication, and sustainable engagement, but that UC is still below the national norm in eight out of nine employee engagement categories. While voluntary separation is often influenced by a combination of factors, employee engagement can give us a window into the areas that might be contributing to the loss of employees to other organizations or geographic areas.


For more informatioN

Employee headcount (dashboard)

Employee FTE (dashboard)

Workforce diversity (dashboard)

Staff workforce profile (dashboard)

Annual wage reporting (dashboard)

Chancellors compensation (pdf)

CUCSA/Systemwide Human Resources Engagement Survey (website)


University of California Health staff has grown significantly as health services have expanded, while general campus, non-student support staff growth (12.3 percent) has lagged behind overall student enrollment (27.4) over the past decade.

6.1.1 Staff Full-time Equivalent (FTE), Universitywide, October 2011 to 2021

6.1.1

Source: UC Corporate Personnel System

* In 2017 and 2018, several job titles were reclassified between MSP and PSS groups. Excludes Lawrence Berkeley National Laboratory, Hastings School of the Law, and Associated Students UCLA.

General campus, non-student staff has seen the greatest growth amongst senior professionals, due to both the introduction of Career Tracks and the professionalization of UC’s workforce towards high-skilled analysis and technical capabilities. Career Tracks is a function-specific, market-aligned, job classification system that applies consistent interpretations of which positions are Management and Senior Professional (MSP) and which are Professional and Support Staff (PSS). Within PSS, there has been a significant shift away from clerical roles into student services and administrative analysis positions to manage growing campuses and student bodies.

UC operates six health systems with five academic medical centers as well as schools of medicine, dentistry, nursing, and other health sciences education and research programs. Over 59 percent of UC non-academic staff FTE work for the University of California Health system. These frontline workers (including doctors, nurses, administrators, technicians, and allied health professionals) are playing a critical role in California’s response to the COVID-19 pandemic. The growth of University of California Health FTE is also driven by service expansions, such as increases in inpatient days as well as outpatient/emergency visits. For more information, refer to Chapter 11: University of California Health.


The proportion of underrepresented staff has grown modestly at all levels in the last decade. Representation of women has grown at the senior professional levels, and has stayed high at the manager and support staff levels.

6.1.2 Racial/ethnic diversity of non-student staff by personnel program, Universitywide, October 2011 to 2021

6.1.2

6.1.3 Gender diversity of non-student staff by personnel program, Universitywide, October 2011 to 20216.1.3

Source: UC Corporate Personnel System, Unknown* category includeds both non-binary and no information.

UC has sought to improve representation of historically underrepresented domestic racial/ethnic groups. Diversity has increased steadily at all staffing levels; however, senior management positions remain less diverse. More than half of the managers and professional support staff employees are women. The percentage of women employees has remained steady within the Senior Management Group (SMG), while Senior Professionals have nearly equal gender representation. As a result of the California Gender Recognition Act (SB-179), UC recently revised self-reporting options for gender identity and sexual orientation, resulting in an increase in number of employees without gender information in UC’s centralized system of payroll, benefits, and human resources (UCPath).


In last decade, the number of staff supported by non-core funds has increased.


6.2.1 Non-student staff FTE by fund source, General campus and University of California Health, October 2011 and 20216.2.1

Source: UC Corporate Personnel System

General campus employees are increasingly paid with non-core funds such as research funds, auxiliary revenues, and other sources. Though overall general campus staff increased modestly, overall core-funded staff has decreased. Only 16 percent of staff FTE were funded by core funds in 2021, down from 21 percent a decade ago.

University of California Health almost exclusively relies on non-core funds, particularly from hospital revenues, to support its staff. Despite adding about 21,400 FTE, even fewer FTE today are paid on core funds than a decade ago.


6.2 STAFF Compensation

Over the past decade, inflation-adjusted salaries have been relatively flat for general campus staff, with slight declines for MSP employees.

6.2.2 eneral campus career staff average inflation-adjusted base salaries by personnel program, FY 2011 to 2021 

6.2.2

6.2.3 University of California Health career staff average inflation-adjusted base salaries by personnel program, FY 2011 to 2021

6.2.3

Source: UC Corporate Personnel System; California CPI-W used for inflation adjustment

Over the past ten years, salaries in inflation-adjusted dollars have increased modestly for general campus career Professional and Support Services (PSS) staff and Managers. At the same time, UC employees are contributing more to their health care costs and to the UC retirement system, putting downward pressure on the competitiveness of UC’s total compensation compared with the regional labor markets where University centers are located.

Salaries among University of California Health career staff have been increasing moderately in real dollars for Professional and Support Services (PSS) staff and Managers. This reflects market trends in wages for hospital staff and growing demand for health care professionals.

As a result of COVID-19 economic challenges, the financial measures taken during FY 2021 to achieve additional operational and salary savings have resulted in a slight decline in the average inflation-adjusted base salaries for most of the employees, more notably for Managers and Senior Professionals. 


6.2 STAFF Compensation

UC chancellors are among the lowest-paid when compared to their Association of American Universities (AAU) peers. 

6.2.4 Base salaries and additional pay for UC and AAU institution leaders

6.2.4

Source: The Chronicle of Higher Education Executive Compensation Report and institutional data sources

UC chancellors continue to be among the lowest-paid university leaders compared with their AAU peers. Nine UC chancellor salaries fall among the lowest third in this group. UC San Francisco, an exclusively graduate health science campus, is the only exception.

In response to the COVID-19 pandemic and reduction in UC revenues, the UC President and UC Chancellors voluntarily agreed to reduce their salaries by ten percent. The UC Board of Regents approved pay raises for all nine UC chancellors with undergraduate student bodies on January 2022. Given the corresponding implementation timeline, this pay increase is not reflected in the 2021 data presented here.  


The separation rate among staff was eight percent in FY 2021, up from 7.7 percent in the previous fiscal year. Retirement is the leading reason for separation.

6.3.1       Separation rates for career staff by campus and overall, FY 2021

6.3.1

6.3.2       Separation reasons for career staff, FY 2021

6.3.2

Source: UC Corporate Personnel System

Campuses experience a wide range of separation rates among their career staff, which may reflect different mixes of employees, work environments, and local job markets. High turnover is often expensive in terms of lost productivity, lost institutional knowledge, and replacement costs.

About 26 percent of separations were due to retirement, a result of the aging baby-boomer population. Resignations that are not retirement follow the widely reported Great Resignation trend. About 59 percent of separations were resignations in 2021.